VPS – Virtual poster sessions

EGU26-1853 | Posters virtual | VPS1

Measuring Geoethical Awareness and Engagement Profiles in UNESCO Global Geoparks: A Validated Scale and Evidence from Greece 

Alexandros Aristotelis Koupatsiaris and Hara Drinia

Geoethics provides a critical framework for understanding and guiding responsible human–Earth interactions, particularly within UNESCO Global Geoparks (UGGps), which function as living laboratories for geoconservation, geoeducation, and sustainable regional development. Despite growing recognition of geoethics within the geosciences, validated and standardized tools for assessing geoethical awareness—and for understanding how societal engagement with geoheritage varies across socioecological contexts—remain limited. This study addresses this gap by integrating the development, validation, and application of a Geoethical Awareness Scale (GAS) with a comprehensive mapping of residents’ geoethical perceptions and engagement profiles across nine Hellenic UGGps (Lesvos Island, Psiloritis, Chelmos–Vouraikos, Vikos–Aoos, Sitia, Grevena–Kozani, Kefalonia–Ithaca, Lavreotiki, and Meteora–Pyli).

Using an online questionnaire administered to 798 residents, we developed and psychometrically validated a 32-item GAS structured across 16 thematic axes. Exploratory and confirmatory factor analyses identified six robust dimensions of geoethical awareness: (1) geological heritage conservation and sustainable georesource use, (2) community engagement and collaborative governance, (3) sustainability through geoenvironmental education, (4) environmental challenges and risk adaptation, (5) sustainable geotourism, and (6) climate awareness and ecosystem resilience. These factors explained 60.12% of the total variance, with reliability indices ranging from acceptable to excellent. Structural equation modeling confirmed the internal validity and generalizability of the scale, establishing GAS as a reliable tool for assessing geoethical awareness in designated, protected, and managed socioecological systems.

Beyond scale validation, spatial and comparative analyses revealed generally high levels of geoethical awareness across Hellenic UGGps, alongside significant regional variability linked to local context, management visibility, and outreach practices. Sitia UGGp consistently exhibited the highest awareness levels, whereas Psiloritis and Lavreotiki UGGps showed lower scores in dimensions related to community engagement and sustainable geotourism, highlighting opportunities for targeted governance and educational interventions. Demographic and experiential factors—particularly age, education level, urban origin, prior visits to UGGps, and membership in environmental organizations—significantly influenced geoethical perceptions, underscoring the importance of experiential learning and direct engagement.

Cluster analysis further identified four distinct resident profiles: (1) highly engaged environmental stewards, (2) supportive but selective advocates, (3) moderately indifferent participants, and (4) disengaged or critical respondents. While nearly 70% of participants demonstrated strong or moderate alignment with geoethical principles and values, the remaining groups highlight the need for tailored education, participatory governance, and inclusive outreach strategies.

Overall, this integrated assessment demonstrates how validated measurement, spatial differentiation, and social profiling of geoethical awareness can inform adaptive governance and geoeducation strategies within UGGps. The findings support a transition from anthropocentric toward geocentric perspectives, positioning geoethical awareness as a key socioecological indicator for sustainability, resilience, and Earth-system stewardship in the Anthropocene.

How to cite: Koupatsiaris, A. A. and Drinia, H.: Measuring Geoethical Awareness and Engagement Profiles in UNESCO Global Geoparks: A Validated Scale and Evidence from Greece, EGU General Assembly 2026, Vienna, Austria, 3–8 May 2026, EGU26-1853, https://doi.org/10.5194/egusphere-egu26-1853, 2026.

Macaronesia (Azores, Madeira–Selvagens, Canary Islands, and Cape Verde) constitutes a natural laboratory for studying the interaction between intraplate volcanism, regional seismicity, and coastal hazards. This paper presents an integrated approach to assessing and communicating volcanic, seismic, and tsunami risks in the Canary Islands and their Macaronesian context, combining: (i) multiparametric monitoring data (IGN, INVOLCAN, CIVISA/IPMA), (ii) geophysical synthesis of the mantle structure beneath Macaronesia, and (iii) active learning experiences with university students. Case studies include the Tajogaite–Cumbre Vieja eruption (La Palma, 2021), with pre-eruptive seismic swarms, Strombolian emissions, and lava flows that affected infrastructure and necessitated evacuations; and the seismicity associated with volcanic systems and faults in the Canary Islands and Azores. The danger of tsunamis from volcanic landslides (prehistoric megatsunamis) and the UNESCO IOC NEAM early warning framework (with IPMA, INGV, CENALT, KOERI, NOA, PTWC, among others) are also discussed. Preliminary results show that integrating monitoring networks, propagation models, and educational activities based on real data improves risk understanding and community preparedness.

Goals

  • To characterize the main geological hazards in the Canary Islands and Macaronesia (active volcanism, regional seismicity, and tsunami generation/propagation), integrating historical and instrumental data.
  • Analyze the Tajogaite case (La Palma, 2021) as a recent example of risk management and civil response, highlighting lessons for monitoring and reconstruction.
  • Exploring tsunami scenarios associated with volcanic flank collapses and early warning mechanisms in the NEAM region (capacities and limitations).
  • Develop a program of academic activities with UNED students.

Methodology

  • Data sources: IGN seismic catalogs (1585–2022), IPMA/CIVISA in the Azores, volcanic monitoring bulletins (IGN/INVOLCAN), and recent literature (Frontiers, MDPI).
  • Analysis: review of eruptive chronologies and swarms (La Palma 2021), mapping of hypocenters and magnitudes, synthesis of mantle structure (tomography/seismicity), and evaluation of tsunami scenarios due to landslides.
  • Alert framework: NEAMTWS (IOC ‑UNESCO), functions of NTWCs (IPMA, INGV, CENALT, KOERI, NOA) role of the PTWC/ITIC in interoperability.

Activities

  • Seismic data practice (IGN/IPMA): download the catalog for the Canary Islands/Azores; filter by period, magnitude, and depth; visualization and heat map of hypocenters; discussion of active patterns (pre/post ‑eruptions).
  • Analysis of the Tajogaite case (2021): timeline of previous seismicity, eruptive evolution, impacts on infrastructure and population; use of bulletins and technical articles (Frontiers/MDPI/IGN).
  • Tsunami workshop: review of megatsunami deposits in the Canary Islands and basic wave attenuation modeling; coastal exposure maps; connection with Tsunami Ready (IOC).
  • Macaronesian Geodynamics Seminar: Critical Reading of the Plume vs. Tectonics Debate; Implications for Risk; Relationship with Biodiversity and Human Occupation on Islands (Socio-environmental Context).

Results

  • Technical skills: handling seismic catalogs and volcanic reports (IGN/INVOLCAN/IPMA/CIVISA), signal reading, and construction of hazard and exposure maps.
  • Integrated risk understanding: connection between tsunami monitoring, geodynamics and warning in the NEAM system, with criteria for interpreting warnings and model limitations.
  • Lessons from 2021 on La Palma: recognition of pre-eruptive indicators, evacuation logistics and reconstruction (slow cooling of lava flows, gases, geotechnical heterogeneity).
  • Impact on resilience: improving community preparedness and a culture of prevention in island environments by connecting science, education, and citizens through replicable activities.

Bibliography

  • IGN: Seismic Catalogue of the Canary Islands 1341–2022 (maps and relocations 1975–2000).
  • IPMA/CIVISA: seismic networks and maps for Azores/Madeira.
  • Geodynamic Macaronesia: Frontiers 2023 (mantle and plume review/alternatives).

How to cite: Delgado García, A.: Study of volcanic, seismic and tsunami risks in the Canary Islands and Macaronesia: integration of monitoring, models and university education for resilience., EGU General Assembly 2026, Vienna, Austria, 3–8 May 2026, EGU26-2161, https://doi.org/10.5194/egusphere-egu26-2161, 2026.

In the field of science, there is a need for a more comprehensive assessment of the potential geopolitical impacts of the transition to renewable energy. The combination of risk-prone situations such as depleting mineral resources, increasing environmental problems, rising geopolitical risks, and regional and global conflict potentials with the energy transition’s intense demand for critical minerals has made uninterrupted access to critical minerals a highly sensitive issue for the countries’ national security. The importance of these minerals, which are also heavily used in sophisticated weapon systems and ammunition, is increasing day by day. Recent events such as trade disputes between countries, resource nationalism, the COVID-19 pandemic, the Russia-Ukraine War, US President Trump’s demand to “annex” Greenland and Canada for critical minerals deposits, the US-Ukraine Minerals Deal that ensures the control of US on the critical minerals deposits of Ukraine, and the US-China trade war depending on REE’s and critical minerals have made the risk of disruption to the global economy and security even more apparent. This situation has placed critical minerals in a sensitive position in the global political economy, necessitating a reassessment of the mutual economic and political relations between the major global economies of the 21st century and resource-rich developing countries. In this process, developed countries need to enter into a new economic structure with resource-rich countries in order to maintain their prosperity and national security. The ideological divisions of the Cold War era are giving way to new alliances based on economic and technological superiority. On the other hand, due to the vital importance of critical minerals, especially for leading economic and military powers such as the US, EU, China, Russia, Japan, and India, any disruptions these countries may experience in the access of critical minerals or mutual interventions between parties in resource-rich countries carry the risk of large-scale conflict worldwide.

Protectionist, control-oriented, import-substitutionist, and divisive policies are those that most countries have implemented or have been forced to contend with regarding “critical minerals.” This situation, which has led to a resurgence of resource nationalism worldwide, also signals the beginning of a new “mercantilist” era from a global perspective. These policies, reflect the fundamental characteristics of neo-mercantilism, have formed the main axis of many countries’ “critical minerals” strategies, especially since 2016. Moreover, the United States, one of the most important advocates of economic liberalism, is leading this new era globally. The US’s national interests are driving the country to pursue neomercantilist strategies regarding critical minerals. These strategies leave other countries with no choice but to either align with the policies they contain or respond to the US with similar counter-policies. In today’s climate of international insecurity, the implementation of neo-mercantilist policies on critical minerals is becoming a necessity rather than a choice for countries. Developments in the coming period will determine whether critical minerals will be a vital aid for the clean energy transition or a bottleneck for world politics and economics due to access risks. Geologists and policymakers will need to work together on this issue.

How to cite: Tuna, İ. K.: The United States' critical minerals security policies in the context of neomercantilism and their impact on global geological studies, EGU General Assembly 2026, Vienna, Austria, 3–8 May 2026, EGU26-7904, https://doi.org/10.5194/egusphere-egu26-7904, 2026.

EGU26-12137 | Posters virtual | VPS1

The Kaleidoscopic Lens of Art: Art–Science Collaborations for Environmental Literacy and Sustainable Futures 

Rosa Coluzzi, Vito Imbrenda, Licia Fanti, Wanda Traino, Massimo de Carlo, Vincenzo Camardelli, Andrea Smilzo, Michele Cordisco, Giovanna Limone, Lorenzo Amato, Giuseppe Calamita, Emanuele Ciancia, Ilaria Gandolfi, Angela Perrone, Lucente Salvatore, Angela Pilogallo, Luigi Santopietro, and Valeria Giampaolo

Addressing contemporary environmental challenges, such as climate change, land degradation, and ecosystem transformation, requires not only scientific knowledge but also new ways of communicating complexity, uncertainty, and responsibility. Art–science collaborations are increasingly recognised as effective tools to engage diverse audiences emotionally and cognitively, fostering environmental awareness and sustainable mindsets. This contribution presents The Kaleidoscopic Lens of Art: Imaging the Environment, an interdisciplinary educational project that bridges Earth Observation science and artistic practice to promote environmental literacy and meaningful public engagement.

Developed within Italy’s PCTO (Pathways for Transversal Skills and Career Guidance) framework, the project involved third-year high school italian students working in close collaboration with researchers from the Institute of Methodologies for Environmental Analysis (IMAA) of the National Research Council (CNR) of Italy. Students analysed authentic satellite imagery and geospatial datasets related to environmental processes and human–environment interactions, including landscape change and urban–natural dynamics. Scientific data were then reinterpreted through multiple artistic languages transforming analytical evidence into visual narratives.

The educational pathway followed a blended methodology combining classroom instruction, field activities, laboratory sessions, and creative workshops. This iterative process guided students from scientific observation and data analysis to conceptual re-elaboration and artistic production. The resulting works—mixed-media paintings, architectural reinterpretations of landscapes, and digitally manipulated satellite imagery—functioned as hybrid artefacts, simultaneously conveying scientific content and eliciting emotional and ethical reflection on sustainability.

The collective exhibition COSMOS CREATIVO: Artistic Transformations of Earth from Space, presented during the European Researchers’ Night (2024–2025), demonstrated the potential of art–science collaboration to act as a powerful form of science communication. By translating complex environmental data into accessible and emotionally resonant forms, the exhibition fostered dialogue between students, scientists, and the wider public, highlighting the shared responsibility of scientific and artistic communities in communicating planetary boundaries and ecosystem fragility.

Aligned with the EU Key Competences for Lifelong Learning and SDG 4, the project offers a replicable model for integrating STEAM education, environmental awareness, and civic engagement. By positioning scientific data as both analytical tools and sources of aesthetic inspiration, The Kaleidoscopic Lens of Art illustrates how art–science collaborations can build bridges between disciplines, enhance public understanding of Earth system science, and support the cultural imagination needed to envision sustainable futures.

Keywords: interdisciplinary education, PCTO, STEM and art integration, environmental awareness, satellite imagery, geospatial data, creative learning, high school education 

How to cite: Coluzzi, R., Imbrenda, V., Fanti, L., Traino, W., de Carlo, M., Camardelli, V., Smilzo, A., Cordisco, M., Limone, G., Amato, L., Calamita, G., Ciancia, E., Gandolfi, I., Perrone, A., Salvatore, L., Pilogallo, A., Santopietro, L., and Giampaolo, V.: The Kaleidoscopic Lens of Art: Art–Science Collaborations for Environmental Literacy and Sustainable Futures, EGU General Assembly 2026, Vienna, Austria, 3–8 May 2026, EGU26-12137, https://doi.org/10.5194/egusphere-egu26-12137, 2026.

The capabilities and widespread availability of generative AI are potentially changing ways of working and studying. However, there are a lot of pitfalls and ethical questions to complicate use. Postgraduate taught (PGT) students typically study at the University of Glasgow for 12 months. They come from a wide range of institutions, where rigorous academic citation of information may not have been previously covered. Students have also been falling into the trap of AI hallucinations and losing academic integrity as they don’t realise generative AI can’t be relied upon. With this in mind a workshop was designed and run in Autumn 2025 to discuss finding reliable sources of information, how to manage/store information you find during research (including citation information), how to cite information correctly, and why this is important. The workshop included an explanation of Generative AI and student discussions on generative AI use and ethics. This work will discuss the workshop and reflect on what went well and what could be further improved. We need students to have a solid understanding of what generative AI can and can’t do, and the ethical background to decide if and when to use it, during their studies and in their future careers.

How to cite: Petrie, E.: Integrating Generative AI into good academic practice: a workshop for PGT students on sourcing, managing and citing information and Generative AI, EGU General Assembly 2026, Vienna, Austria, 3–8 May 2026, EGU26-13848, https://doi.org/10.5194/egusphere-egu26-13848, 2026.

EGU26-13997 | ECS | Posters virtual | VPS1

Ethics of Repair: From the Earth’s High Orbits to its High Seas 

Rajji Desai
The Infrastructure of Invisibility
As satellite constellations proliferate, orbital space has transitioned from a distant "above" to a kinetic, operational layer of the Earth system. This anthropogenic shell now underwrites the essential functions of modern life, including precision navigation, weather forecasting, global finance, and disaster response. Yet, this total infrastructural dependence is coupled with a profound civic invisibility. As of early 2026, the catalogue of active spacecraft exceeds 14,300, yet they remain sensory ghosts to the populations they serve. This asymmetry, in which total reliance is paired with sensory absence, allows the crises of orbital congestion, collision risk, and end-of-life disposal to be treated as economic externalities rather than urgent questions of environmental governance.
Defining the Vertical Commons
This paper proposes a transdisciplinary framework for investigating what I term the "vertical commons," a continuous, jurisdictional geography belonging to the "common heritage of mankind." This commons extends from near Earth orbital regimes down to the high seas. These are two realms increasingly unified by toxic "waste metabolisms" that operate beyond the reach of public scrutiny.
Drawing on Steven J. Pyne’s characterisation of "extreme environments," I elucidate these two frontiers as remote and technologically mediated zones. In these areas, the absence of a permanent human and ecological presence translates into diminished political urgency. Within this framing, I examine two specific geographies of abandonment:
  • The Graveyard Orbit: The region located several hundred kilometres above the geostationary belt, where defunct satellites are "parked" in perpetuity to prevent interference with operational assets.
  • The Spacecraft Cemetery: The South Pacific Ocean Uninhabited Area near Point Nemo, where controlled reentries are targeted to sink decommissioned hardware into the deep sea.
Methodology: Forensic Aesthetics as Knowledge Production
Methodologically, I deploy artistic cartography and forensic aesthetics as modes of environmental inquiry rather than mere communication. This approach moves beyond outreach to treat creative practice as a rigorous form of knowledge production. By translating public orbital catalogues, disposal protocols, and re-entry narratives into a suite of visual propositions, I render these hidden infrastructures and their afterlives perceptible and therefore contestable. This method surfaces the embodied, affective, and justice-relevant dimensions of the vertical commons that are often sidelined in conventional environmental social science.
Ethics of Repair
To theorise the affective stakes of this transformation, I introduce the concept of vertical solastalgia. This is a specific form of grief triggered not by damaged ground alone, but by the slow sacrifice of a once legible sky and an assumedly inexhaustible high seas. Here, grief is not merely a sentiment; it is an epistemic signal, or a way of seeing that resists the amnesia encouraged by massive altitude and remoteness.
By reframing the graveyard orbit and the spacecraft cemetery as a single and layered geography of abandonment, this paper argues for an expanded environmental ethic. We must dissolve the artificial separations between land, sea, and sky, reframing the vertical commons not as a convenient sink for decommissioned technology, but as a domain of collective care, stewardship, and urgent repair.

How to cite: Desai, R.: Ethics of Repair: From the Earth’s High Orbits to its High Seas, EGU General Assembly 2026, Vienna, Austria, 3–8 May 2026, EGU26-13997, https://doi.org/10.5194/egusphere-egu26-13997, 2026.

EGU26-16189 | Posters virtual | VPS1

Beyond Equality: Early-Career Perspectives on Equity in Geoscience 

Angela Che Ing Tang

Early-career researchers play a central role in advancing geoscience, yet their research trajectories are shaped not only by scientific challenges, but also by structural conditions that influence access, recognition, and sustainability. While equal-opportunity frameworks aim to ensure fairness through consistent treatment, they may still produce uneven outcomes when differences in experience, workloads, contribution, and risk exposure are not fully recognised. These conditions are particularly consequential for early-career researchers navigating mobility and temporary contracts. The uneven distribution of invisible academic labour further shapes who remains visible and who is able to sustain a research career.

Framing these dynamics as shared research challenges allows early-career researchers to learn from one another’s experiences, reduce impostor syndrome, and make visible the human side of scientific work. Equity is a shared responsibility: institutions and organisations can improve transparency around structural conditions, while research communities and scientific societies can reduce inequities by shaping participation, recognition, and visibility within existing constraints. This includes flexible participation models, transparent evaluation practices, and greater recognition of non-visible contributions that support more equitable and inclusive research environments. By treating equality and fairness as shared problem-solving spaces rather than individual burdens, this perspective aims to support more inclusive and sustainable pathways for early-career researchers in geoscience.

How to cite: Tang, A. C. I.: Beyond Equality: Early-Career Perspectives on Equity in Geoscience, EGU General Assembly 2026, Vienna, Austria, 3–8 May 2026, EGU26-16189, https://doi.org/10.5194/egusphere-egu26-16189, 2026.

Underground mining supplies essential metals that are indispensable for the energy transition and digital technologies. In this context, mountain landscapes around the globe are profoundly transformed, not only at the surface, but also underground on a large scale. Hidden subsurface landscapes develop progressively below the earth surface. A better understanding of the interconnections between subterranean metal extraction, landscape change, energy use and metal consumption is essential for future visions of sustainable resource management. In the current study, the Harz Mountains in Northern Germany serves as a case study to analyze the development of historical mining landscapes in a spatio-temporal and interdisciplinary context including especially geological, geomorphological, hydrological and cultural aspects. The natural landforms has been transformed significantly by ore extraction forming a new hybrid mining landsape.

The project on mining landscapes is carried out at the UNESCO-World heritage site Samson Mine in St. Andreasberg, which was one of the deepest mines in the 19th century and shows an almost 400-year mining history of silver. The research results are communicated to a wider public in the museum. In this regard the study is embedded in geographical environmental education (GEE), in which global learning and the Sustainable Development Goals (SDGs) form central components. Historical mining serves as a learning platform to reflect on current challenges of global metal extraction and energy use.

Historical perspectives reveal how mining landscapes have been shaped over centuries, how the rate of extraction increased with technical and social innovations or stagnated due to various crises, and they may show, most important, the cultural drivers of ore extraction. In this regard a geocultural concept for science communication has been developed for the Samson Mining Museum integrating digital forms of geovizualisations such as Structure-from-Motion (SfM), GIS-Applications and Augmented Reality (AR). They have the potential to make the underground visible and at the same time to show landscape changes over longer time periods. The fundamental starting element of the educational concept is the staff-guided mine tour through the original historical mine as an authentic and emotional experience. The didactic progression consists of the real-life experience in the mine, followed by locating, capturing, understanding, contextualizing, and reflecting mine-related topics in a local to global context through hybrid digital media in the museum to enhance geographical core competences, and finally transferring the acquired knowledge and interconnections to the real landscape – from Analog via Digital to Real-World explorations (ADR-Concept). The project is supported by fundings schemes on cultural heritage in Lower Saxony by the Ministry of Science and Culture of Lower Saxony (zukunft.niederdsachsen.de).

How to cite: Iturrizaga, L.: Geocultural Education and Digital Geovisualizations of Mountain Mining Landscapes: From Analog via Digital to Real-World explorations – a conceptional approach, EGU General Assembly 2026, Vienna, Austria, 3–8 May 2026, EGU26-16962, https://doi.org/10.5194/egusphere-egu26-16962, 2026.

EGU26-20122 | ECS | Posters virtual | VPS1

Developing Matrix-Matched Empirical Calibrations for EDXRF Analysis of Peat-Alternative Growth Media 

Thulani De Silva, Carmela Tupaz, Maame Croffie, Karen Daly, Michael Gaffney, Michael Stock, and Eoghan Corbett

A key reason for the widespread use of peat-based growth media in horticulture is their reliable nutrient availability when supplemented with fertilisers. However, due to environmental concerns over continued peat-extraction and use, peat-alternatives (e.g., coir, wood fibre, composted bark, biochar) are increasingly being used commercially. These alternative media often blend multiple materials, making it crucial to understand elemental composition and nutrient interactions between components. This study evaluates whether benchtop Energy Dispersive X-ray Fluorescence (EDXRF) can provide a rapid method for determining the elemental composition of peat-alternative components.

Representative growing media components (peat, coir, wood fibre, composted bark, biochar, horticultural lime, perlite, slow-release fertilisers, and trace-element fertiliser) were blended in different ratios to generate industry-representative mixes. Individual components and prepared mixes were dried and milled to ≤80 μm. An industry-representative mix (QC-50: 50% peat, 30% wood fibre, 10% composted bark, 10% coir, with fertiliser and lime additions) and 100% peat were analysed by EDXRF (Rigaku NEX-CG) for P, K, Mg, Ca, S, Fe, Mn, Zn, Cu and Mo, and compared against ICP-OES reference measurements. The instrument’s fundamental parameters (FP) method using a plant-based organic materials library showed large discrepancies relative to ICP-OES (relative differences: 268–390 084%) for most elements in both QC-50 and peat, with the exception of Ca in QC-50 (11%). These results confirm that the FP approach combined with loose-powder preparation is unsuitable for accurate elemental analysis of organic growing media.

An empirical calibration was subsequently developed using 18 matrix-matched standards (CRMs, in-house growing media and individual component standards). Matrix matching is challenging because mixes are mostly organic by volume, yet variable inorganic amendments (e.g., lime, fertilisers, and sometimes perlite) can strongly influence XRF absorption/enhancement effects. Calibration performance was optimised iteratively using QC-50 as the validation sample, until relative differences were <15% for all elements. When applied to 100% peat, agreement with ICP-OES results improved substantially for some macro-elements (e.g. Mg 10%, Ca 1%, S 19%) but remained poor for most trace elements (28–96%), demonstrating limited transferability of this calibration method across different elements and matrices tested.

Overall, these results demonstrate that loose powder preparation does not provide sufficiently robust accuracy for EDXRF analysis of organic growing media even with meticulous empirical matrix-matched calibration. We are therefore developing a pressed pellet method using a low-cost wax binder to improve sample homogeneity (packing density) and calibration transferability. Twenty unknown mixes will be analysed using both loose powder and pressed-pellet calibrations, and agreement with reference data (ICP-OES) will confirm method validation, supporting the development of EDXRF as a novel approach for growing media analysis.

How to cite: De Silva, T., Tupaz, C., Croffie, M., Daly, K., Gaffney, M., Stock, M., and Corbett, E.: Developing Matrix-Matched Empirical Calibrations for EDXRF Analysis of Peat-Alternative Growth Media, EGU General Assembly 2026, Vienna, Austria, 3–8 May 2026, EGU26-20122, https://doi.org/10.5194/egusphere-egu26-20122, 2026.

EGU26-21525 | ECS | Posters virtual | VPS1

Extreme Academic Tales for Recorded Extreme Tails in Greece 

Panayiotis Dimitriadis

One of the most life-changing experiences for scientists is when real-world events challenge theoretical knowledge and standard models in the literature. When facing such circumstances, scientists, instead of feeling disappointment and discouragement, must seize the opportunity to expand their knowledge and adjust for flaws in their initial assumptions, as academic integrity is rooted in fundamental scientific values, such as honesty and fairness. Considering this, and after decades of post-graduate, PhD, and post-doctoral studies in the fields of Hydraulics, Hydrology, and Stochastics, we witnessed a series of unprecedentedly extreme events in academia involving the official regulations for tenured professorships in Greece. These regulations mandate the formation of an Academic Board for candidate evaluation by randomly drawing lots from a pool of professors whose scientific fields are relevant to the subject of the position. This is intended to avoid "pre-designed" boards (i.e., those formed by blocking certain experts —often highly qualified ones— from the draw and favouring others —often poorly qualified ones— who may have scientific and financial conflicts of interest regarding specific candidates), which can cause severe long-term degradation of the educational system. Unexpectedly, even after multiple repetitions and strong reassurance regarding the validity of the above procedure, the probability of the outcomes (specifically, the consistent drawing of a handful group of lots) reached the extreme order of millionths. In this presentation, we will discuss these experiences with extremes and whether the concepts of statistical significance and reliability indices in scientific literature and academic regulations should be revisited.

How to cite: Dimitriadis, P.: Extreme Academic Tales for Recorded Extreme Tails in Greece, EGU General Assembly 2026, Vienna, Austria, 3–8 May 2026, EGU26-21525, https://doi.org/10.5194/egusphere-egu26-21525, 2026.

EGU26-557 | ECS | Posters virtual | VPS2

Temperature-driven shift intensifies 21st-century Amazon droughts 

Ronaldo Albuquerque, Djacinto M. dos Santos, Vitor F. V. V. Miranda, Leonardo F. Peres, Ricardo M. Trigo, Ana M. B. Nunes, Margarida L. R. Liberato, Célia M. Gouveia, and Renata Libonati

The Amazon Basin (AB) is experiencing an intensification of hydroclimatic extremes, with droughts becoming more frequent, widespread, longer, and severe in the 21st-century. While precipitation deficits have historically been the primary driver of these events, the role of rising air temperatures and the consequent increase of atmospheric evaporative demand (AED) remains poorly quantified. Understanding the relative contributions of these factors is crucial for assessing AB resilience and potential tipping points under ongoing global warming. Here, we analyzed drought evolution across the AB over 45 years (1980–2024) using the Standardized Precipitation-Evapotranspiration Index (SPEI) derived from ERA5-Land reanalysis data. To isolate the contribution of atmospheric evaporative demand (CAED) to drought severity, we compared the standard SPEI with a modified SPEI version based on constant climatological AED.

Furthermore, we applied a rarity index to systematically rank drought events by intensity and spatial extent, enabling a standardized comparison of the exceptional 2023/24 event with historical benchmarks. Our analysis reveals that the 2023/24 drought (AD-23/24) was the most extreme event on record, affecting over 88% of the basin’s area and having a magnitude four times that of the average of the previous top-5 droughts. Notably, the recurrence of high-ranking drought years since 2020 underscores a persistence of extreme conditions in the 2020s. Crucially, the CAED analysis uncovers a distinct temporal regime shift occurring after 2005. While earlier droughts were primarily precipitation-driven, the post-2005 era is characterized by a predominantly evapotranspiration-driven regime, in which climate change-induced warming significantly amplifies drought intensity through increased AED. This intensification is further linked to sea surface temperature anomalies in the Tropical Indian, Tropical Pacific, and North Atlantic oceans. These findings demonstrate that the AB has entered a new hydroclimatic phase in which temperature-driven AED is overtaking precipitation deficits as the primary driver of exceptional drought events. This shift suggests that warming is likely exacerbating drought severity, posing unprecedented challenges for ecosystem stability and water security in the region.

How to cite: Albuquerque, R., M. dos Santos, D., F. V. V. Miranda, V., F. Peres, L., M. Trigo, R., M. B. Nunes, A., L. R. Liberato, M., M. Gouveia, C., and Libonati, R.: Temperature-driven shift intensifies 21st-century Amazon droughts, EGU General Assembly 2026, Vienna, Austria, 3–8 May 2026, EGU26-557, https://doi.org/10.5194/egusphere-egu26-557, 2026.

EGU26-676 | ECS | Posters virtual | VPS2

Radar Polarimetry to Characterize Overshooting Convection in the Western Ghats of India 

Harikrishna Devisetty, Murali Krishna Uriya Veerendra, Bhishma Tyagi, Subrata Kumar Das, Kaustav Chakravarty, Chandramuni Survase, and Padma Kumari Burrala

This study provides the first high-resolution polarimetric radar observations of Overshooting Convective Storms (OCS) over the Western Ghats (WG), India using the newly installed SSPA-based X-band Radar at HACPL, Mahabaleshwar. Three post-monsoon OCS events (15, 23, and 24 October 2025) were analysed using PPI, RHI, CFAD products and ERA5 Atmospheric fields. All storms exhibited strong vertical growth, with echo-top heights of 17.6–19.8 km (15 Oct), 16.5 km (23 Oct), and 17.8 km (24 Oct), and peak reflectivity values of 59.6, 63.3, and 52.1 dBZ, respectively. Notably, significant reflectivity (>40 dBZ) persisted above 16 km, confirming deep overshooting intrusions. Polarimetric signatures showed clear mixed-phase and ice-growth processes, including KDP up to 3–4° km⁻¹, enhanced ZDR in the rainy regions, and reduced ρhv (0.92–0.96) within convective cores, indicating liquid water content, riming, and graupel/hail production. ERA5 diagnostics revealed favorable conditions for deep convection, with strong mid-tropospheric ascent (–0.6 to –0.8 Pa s⁻¹), high moisture, and pronounced convergence over the WG. These results demonstrate intense post-monsoon overshooting convection in complex terrain and highlight the capability of X-band Polarimetric radar to reveal the storm microphysics and vertical structure in an orographically challenging environment.

How to cite: Devisetty, H., Uriya Veerendra, M. K., Tyagi, B., Das, S. K., Chakravarty, K., Survase, C., and Burrala, P. K.: Radar Polarimetry to Characterize Overshooting Convection in the Western Ghats of India, EGU General Assembly 2026, Vienna, Austria, 3–8 May 2026, EGU26-676, https://doi.org/10.5194/egusphere-egu26-676, 2026.

This study is motivated by the observation of a unique intraseasonal power in the upper tropospheric equatorial meridional winds over the Western Hemisphere during boreal winter. The presence of intraseasonal power at both westward and eastward wavenumbers is unusual and intriguing, as the dominant tropical modes of intraseasonal variability typically exhibit little amplitude in equatorial meridional winds and are instead characterized by strong zonal wind perturbations. Furthermore, the intraseasonal disturbances are confined to the upper troposphere.  The spatial structure and dynamical characteristics of these disturbances are consistent with those of mixed Rossby-gravity waves (MRGWs), indicating the presence of intraseasonal MRGWs in the atmosphere. A systematic relationship between the location and amplitude of the intraseasonal MRGWs and the upper-tropospheric westerlies suggests that background circulation is fundamental to their existence. This hypothesis is investigated through a set of diagnostic analyses guided by the dispersion relation of a linear shallow water model incorporating a homogeneous background flow. The results not only explain the emergence of intraseasonal MRGWs but also the overall distribution of meridional wind power throughout the troposphere. The strength and direction of the background flow govern the observed spatial and temporal characteristics of MRGWs via Doppler shifting of intrinsic MRGWs. Consequently, the spectral power distribution of equatorial meridional wind perturbations across pressure levels represents a composite of MRGWs that have been Doppler-shifted by a range of background flow regimes.

How to cite: Mehak, M. and Ettammal, S.: Can Background Circulation Facilitate Intraseasonal Mixed Rossby-Gravity Waves over theCentral-Eastern Pacific?, EGU General Assembly 2026, Vienna, Austria, 3–8 May 2026, EGU26-691, https://doi.org/10.5194/egusphere-egu26-691, 2026.

EGU26-731 | ECS | Posters virtual | VPS2

Evolving Characteristics in Western Disturbances over the Hindu Kush Himalayas 

Spandita Mitra, Divya Sardana, and Ankit Agarwal

Western Disturbances (WD) are key atmospheric phenomena over northern India, Pakistan, and the Western Himalayas, especially during winter months (December to February). In recent years, increasing variability in these systems has been observed across all seasons, notably pre-monsoonal months (March to May), although thorough investigation remains underexplored. The study evaluates the shifting behaviour and structure in WDs across two climatologically distinct periods – 1950 to 1976 and 1977 to 2022, corresponding to the well-documented 1976-1977 climate shift. In this study, vorticity-based WD track data, coupled with the ERA5 reanalysis dataset, have been utilised to analyse the shift. Behavioural changes are quantified through frequency trends, maximum vorticity distribution and mean track, while structural evolution is examined through composite vertical profiles of key atmospheric variables.  The study unravels notable increase in WD frequency during the pre-monsoon season in recent decades, accompanied by a westward shift in WD origins and longer track durations, thereby enhancing the potential for moisture transport. Furthermore, substantial strengthening of upper-level zonal winds, intensified mid-tropospheric convection, and atmospheric moisture availability have been observed through structural analysis. Such transformations indicate a transition of WD towards hybrid systems with enhanced convective features, thereby elevating the potential for extreme precipitation events during the pre-monsoon period. This improved understanding of the evolving WD dynamics is critical for hydrological planning, climate action, strategies and disaster preparedness in the highly vulnerable Himalayan and adjoining regions.

How to cite: Mitra, S., Sardana, D., and Agarwal, A.: Evolving Characteristics in Western Disturbances over the Hindu Kush Himalayas, EGU General Assembly 2026, Vienna, Austria, 3–8 May 2026, EGU26-731, https://doi.org/10.5194/egusphere-egu26-731, 2026.

EGU26-1290 | ECS | Posters virtual | VPS2

Variation of atmospheric properties during a dust episode over central Himalayan region using Lidar observation and auxiliary data 

Shishir Kumar Singh, Narendra Singh, Vikas Rawat, Mayank Chauhan, and Subhajit Debnath

This work investigates a prominent dust event that occurred over Nainital, Uttarakhand, during 14-18 May 2025. Continuous micro pulse lidar (MPL) observations provided evidence of significant aerosol enhancement during the event. Distinct elevated aerosol layers were observed between 1 and 2.5 km above ground level, where backscatter coefficients increased to approximately 5×10⁻³ km⁻¹ sr⁻¹ and extinction values ranged between 0.8 and 1.2 km⁻¹. The persistence of these layers indicated long-range transport rather than local sources. Satellite-based aerosol optical depth (AOD) data from MODIS confirmed these enhancements, showing values doubling from 1.1-1.5 to above 2.2 during the peak dust intrusion. Meteorological observations documented elevated daytime temperatures between 20.1 ± 1.3 and 26.8 ± 1.6 °C and a marked reduction of relative humidity to below 50%, suppressing aerosol scavenging. Wind speeds intensified, with nocturnal maxima up to 5.6 ± 1.1 m/s and predominantly westerly to northwest directions (230°- 265°), favoring dust transport from western source regions. Synoptic-scale 850 mb wind analyses further corroborated persistent strong westerlies guiding mineral aerosols from the Thar Desert and Indo-Gangetic plains into the Himalayan foothills. The results highlight the importance of integrating lidar measurements with meteorological and reanalysis datasets to capture both vertical and horizontal characteristics of dust intrusions in mountainous regions. 

How to cite: Singh, S. K., Singh, N., Rawat, V., Chauhan, M., and Debnath, S.: Variation of atmospheric properties during a dust episode over central Himalayan region using Lidar observation and auxiliary data, EGU General Assembly 2026, Vienna, Austria, 3–8 May 2026, EGU26-1290, https://doi.org/10.5194/egusphere-egu26-1290, 2026.

EGU26-1839 | ECS | Posters virtual | VPS2

Observed Lifecycle of Convective Precipitation over Tibetan Plateau Based on the FY-4A Geostationary Satellite 

Chun Guo, Jianhua Yin, Zengxin Pan, Lin Zang, and Feiyue Mao

With the intensification of global warming, deep convective system(DCS) precipitation over the Tibetan Plateau(TP) has become increasingly frequent, which plays a vital role in regulating the regional hydrological cycle. Previous studies have focused on instantaneous convective activity, little elaborating on the evolutionary processes and rainfall of DCSs throughout their whole lifecycle. Here, based on the continuous observations from the FY-4A geostationary satellite, this study investigates the characteristics and evolution of DCSs over TP from 2022 to 2023 through our previous full-lifecycle tracking algorithm from initiation to dissipation. Furthermore, the effects of key meteorological factors on DCSs evolution are revealed.

Results indicate that DCSs are mostly short-lived (3–6 h lifecycle), and more than 85% of convective precipitation occurs during summer from June to August. DCSs concentrate in the central-eastern TP, with an occurrence probability exceeding 12% in summer. Additionally, the area and rainfall rate of DCSs typically reach their peaks at the middle stage of the lifecycle. After the dissipation of the convective core, the persistence time of cirrus can reach 5%–28% of the core’s lifecycle. Controlled variable analysis reveals that convective available potential energy (CAPE) and precipitable water (PW) synergistically regulate the development of convective systems: under conditions of high CAPE (500-103 J kg-1) and high PW (>50 mm), the area of cores expands to the largest extend. However, the maximum lifecycle and peak precipitation of DCSs occur under conditions of moderate wind shear (5-10 m s-1).

This study explores the full-lifecycle evolutionary patterns of DCS over the TP and the regulatory effects of meteorological conditions over TP, laying a theoretical foundation for future research on regional precipitation and climate change in the region.

How to cite: Guo, C., Yin, J., Pan, Z., Zang, L., and Mao, F.: Observed Lifecycle of Convective Precipitation over Tibetan Plateau Based on the FY-4A Geostationary Satellite, EGU General Assembly 2026, Vienna, Austria, 3–8 May 2026, EGU26-1839, https://doi.org/10.5194/egusphere-egu26-1839, 2026.

Although compound drought and heatwave extremes have recently drawn much attention globally, there exist three interesting issues (i.e., event detection, temperature diversity, and interpretable reconstruction) to explore as follows: --First, as drought events can spread over space and evolve over time, how can we perform event detection as accurately as possible? Are there differences in coastal/inland regions?  --Second, whether droughts are always concurrent with heatwaves remains unknown. Moreover, how temperature abnormalities evolve spatiotemporally during drought development and how their associated categories are distributed globally are not fully understood. --Third, it is common sense that droughts and associated near-surface temperature anomalies can be attributed to amplified vertical subsidence and anomalous anticyclonic circulations from dynamic perspectives. However, one open and interesting issues remain unknown: That is, whether hydrometeorological situations under droughts can be reproduced directly utilizing variability of atmospheric dynamics and what specific roles atmospheric dynamics play in drought reconstruction.
 
To explore the three issues mentioned above, our recent achievements are as follows:
-- First, regarding accurate event detection and type division, we identified global-scale seasonal-scale meteorological drought events following the recently proposed 3D DBSCAN-based workflow of event detection. The 3D DBSCAN (Density-Based Spatial Clustering of Applications with Noise) clustering algorithm can directly obtain arbitrarily shaped point collections over a given 3D space. Subsequently, these detected drought events are further grouped into inland and coastal types, as the observations revealed that some droughts over coastal regions originate from, extend to, or are accompanied by long-term precipitation deficits over adjacent oceans. [see algorithm cases (https://doi.org/10.1016/j.aosl.2022.100324), Glo3DHydroClimEventSet(v1.0) products (https://doi.org/10.1002/joc.8289) , and global drought detection (https://spj.science.org/doi/10.34133/olar.0016 ) ]
--Second, regarding diversity of temperature extremes compounded with droughts, we investigated this fundamental issue from the perspectives of temperature abnormality–based drought classification and statistical characteristics of process evolution. The major procedures and achievements were as follows. First, the detected global-scale 3D DBSCAN-based drought events of our study were employed and assigned to Hot, Cold, Normal, and Hybrid categories utilizing a self-designed temperature abnormality–based classification algorithm; the associated global-scale occurrences of these four event categories were approximately 40%, 10%, 30%, and 20%, respectively, and in turn, they displayed statistically significant (p value < 0.05) increasing, decreasing, decreasing, and increasing trends, respectively, during 1980–2020.   [see diversity of temperature anomalies (https://spj.science.org/doi/10.34133/olar.0017 ) ]
--Third, regarding dynamically-based reconstruction of compound droughts and heatwaves, we employs three kinds of dynamic features (i.e., vertical velocity, relative vorticity, and horizontal divergence) for hydrometeorological reconstruction (e.g., precipitation and near-surface air temperature) under drought situations through a so-called XGBoost (extreme gradient boosting) ensemble learning method. The study adopts the reconstruction scheme on the interannual variability and finds dynamically based reconstruction feasible, seemingly regardless of seasonality and drought-inducing mechanisms. More importantly, from interpretable perspectives, global-scale analysis of dynamic contributions helps discover unexpected dynamic drought-inducing roles and associated latitudinal modulation. That is, low-level cyclonic/anticyclonic anomalies contribute to drought development in the northern middle and high latitudes, while upper-level vertical subsidence contributes significantly to tropical near-surface temperature anomalies concurrent with droughts. [see paper (https://doi.org/10.1175/JHM-D-22-0006.1)]

How to cite: Liu, Z.:  Global-scale compound Droughts and heatwaves: inland/coastal type grouping, diversity of temperature extremes, and dynamically-based Interpretable reconstruction, EGU General Assembly 2026, Vienna, Austria, 3–8 May 2026, EGU26-2053, https://doi.org/10.5194/egusphere-egu26-2053, 2026.

Carbon dioxide removal (CDR) is critical to net-zero pathways achieving the Paris Agreement 1.5°C target, yet its effectiveness in reducing humid heat stress risks remain uncertain. Here we examine the hysteresis and reversibility of humid heat stress in China under CDR scenarios. Humid heat responds asymmetrically during warming and CO2 removal especially in eastern and southern China, producing a hysteretic and partially reversible trajectory. This results from unequal adjustments of temperature and relative humidity, which constrain heat-stress recovery even as global temperatures decline. Moist static energy analysis indicates suppressed vertical energy export over eastern China and enhanced transport of warm moisture from tropical oceans, sustaining humid heat during CO2 removal. Consequently, severe humid heat stress persists, with over 6.4 billion people affected, more than 66% of which is due to hysteresis. These findings highlight enduring heat-related risks and the urgent need for adaptation alongside mitigation.

How to cite: Ma, Q.: Committed and Irreversible Humid Heat Stress Risk in China Despite Carbon Dioxide Removal, EGU General Assembly 2026, Vienna, Austria, 3–8 May 2026, EGU26-2384, https://doi.org/10.5194/egusphere-egu26-2384, 2026.

EGU26-4071 | Posters virtual | VPS2

African Easterly Waves as Drivers of Saharan Dust Transport and PM2.5 Extremes in the Intra-Americas Region 

Alejandro Jaramillo-Moreno and Carla Sabrina Vázquez-Jiménez

African Easterly Waves (AEWs) are a dominant synoptic-scale feature of the tropical atmosphere, widely recognized for their role as precursors of tropical cyclones and for modulating summertime rainfall over the Atlantic basin and adjacent regions. However, their potential influence on the transport of Saharan dust across the Atlantic and its impacts on air quality has received comparatively less attention. In this study, we investigate the role of AEWs in modulating Saharan dust transport and its relationship with high PM2.5 concentration episodes over the Yucatán Peninsula. Using reanalysis data, we document a pronounced seasonal cycle in dust transport, with maximum concentrations during boreal summer (June–August), coinciding with the peak activity of AEWs. Spectral analysis reveals a significant contribution at periods of 4–9 days, consistent with the characteristic timescales of AEWs. To quantify their impact on air quality, intense dust events associated with AEWs were identified based on anomalies exceeding one standard deviation and compared with episodes of poor air quality driven by particulate matter. Our results indicate that AEWs account for approximately 26–31% of PM2.5 pollution episodes linked to dust over the Yucatán Peninsula, with event durations ranging from 1 to 8 days. These findings highlight the important role of AEWs in shaping the synoptic-scale variability of aerosol transport and surface air quality in the Yucatán Peninsula and southern Mexico, underscoring their relevance beyond tropical cyclogenesis and precipitation, particularly during the boreal summer.

How to cite: Jaramillo-Moreno, A. and Vázquez-Jiménez, C. S.: African Easterly Waves as Drivers of Saharan Dust Transport and PM2.5 Extremes in the Intra-Americas Region, EGU General Assembly 2026, Vienna, Austria, 3–8 May 2026, EGU26-4071, https://doi.org/10.5194/egusphere-egu26-4071, 2026.

EGU26-4128 | ECS | Posters virtual | VPS2

Intraseasonal Modulation of the Chocó Low-Level Jet by the Madden–Julian Oscillation 

Julian Toro-Arenas, Alejandro Jaramillo-Moreno, Luis Fernando Carvajal-Serna, and Óscar José Mesa-Sanchez

The Madden–Julian Oscillation (MJO) is the dominant mode of intraseasonal variability (30–90 days) in the tropical atmosphere, characterized by eastward-propagating convective and circulation anomalies that strongly modulate tropical and regional climate. Through its large-scale dynamical perturbations, the MJO influences moisture transport, low-level circulation, and precipitation over regions far removed from its primary convective center. However, its role in regulating low-level moisture fluxes over northwestern South America has received comparatively limited attention. In this study, we investigate the influence of the MJO on moisture transport toward Colombia, with particular emphasis on its modulation of the Chocó Low-Level Jet. Using MERRA-2 reanalysis, we characterize intraseasonal variability in low-level moisture advection and wind fields associated with different MJO phases defined by the Real-time Multivariate MJO (RMM) index. The analysis examines changes in low-level moisture transport, wind intensity, and large-scale convergence associated with the zonal displacement of the MJO convective envelope. Results show that the strength of the Chocó Jet depends strongly on the longitudinal position of the MJO convective center. Certain MJO phases enhance moisture transport from the eastern Pacific toward Colombia, favoring orographic ascent along the Andes and organized convection over the Colombian Pacific region, while other phases are associated with weaker moisture fluxes and reduced convergence. These findings highlight the role of the MJO in regulating intraseasonal moisture transport and low-level circulation over northwestern South America.

How to cite: Toro-Arenas, J., Jaramillo-Moreno, A., Carvajal-Serna, L. F., and Mesa-Sanchez, Ó. J.: Intraseasonal Modulation of the Chocó Low-Level Jet by the Madden–Julian Oscillation, EGU General Assembly 2026, Vienna, Austria, 3–8 May 2026, EGU26-4128, https://doi.org/10.5194/egusphere-egu26-4128, 2026.

EGU26-4971 | ECS | Posters virtual | VPS2

Synoptic-Scale Mechanisms And Climate Oscillation Influences On The Monsoon Breaks Of The Indian Summer Monsoon System 

Jadeera Aboobaker and Dr. Sarmistha Singh

The Indian Summer Monsoon Rainfall (ISMR), occurring from the month of June to September, is characterized by intraseasonal variability in the form of active and break spells. Monsoon breaks are periods of sparse to no rainfall, marked by positive outgoing longwave radiation anomalies, above-normal pressures, and clear-sky conditions. These monsoon breaks can have socioeconomic impacts due to their effect on crop growth stages, irrigation planning, and water management. This study aims to investigate the synoptic-scale systems responsible for the onset and sustenance of monsoon breaks over the Western Ghats and other parts of India to improve future predictability of the same. Rainfall data from 1901 to 2025 is used to identify break spells and classify them into short, moderate, and long-duration events. Subsequently, decadal rainfall composites are constructed. These composites reveal patterns of rainfall suppression and enhancement over the Indian subcontinent, equatorial Indian Ocean and West Pacific. Although the spatial structure of rainfall anomalies remains consistent, slight decadal variabilities are observed. Composite analyses of outgoing longwave radiation, and upper and lower tropospheric winds are used to diagnose the synoptic features associated with monsoon breaks. Case studies of recent drought years, 2002 and 2015, highlight the role of upper tropospheric anticyclones, northward displacement of the monsoon trough, and dry air intrusion from West Asia in sustaining and prolonging the breaks, confirming previous studies. The influence of large scale climate oscillations such as ENSO, EQUINOO, and the Boreal Summer Intraseasonal Oscillation (BSISO) on monsoon break frequency and duration is investigated using statistical and machine learning tools, with the aim of informing the development of improved predictive frameworks for monsoon breaks.

How to cite: Aboobaker, J. and Singh, Dr. S.: Synoptic-Scale Mechanisms And Climate Oscillation Influences On The Monsoon Breaks Of The Indian Summer Monsoon System, EGU General Assembly 2026, Vienna, Austria, 3–8 May 2026, EGU26-4971, https://doi.org/10.5194/egusphere-egu26-4971, 2026.

EGU26-6493 | Posters virtual | VPS2

A framework for modeling aerosol-cloud-lightning interactions: Validation of charge structure and aerosol effects 

Weishan Wang, Guoxing Chen, and Yijun Zhang

This study develops a novel framework within the Weather Research and Forecast Model for modeling aerosol-cloud-lightning interactions. The framework explicitly represents aerosol-cloud interactions by prescribing aerosols with two configurations: an idealized setup, where both cloud condensation nuclei (CCN) and ice nucleating particles (IN) are assumed to have a single chemical composition and spatially uniform distributions; and a quasi-realistic configuration, with multi-species aerosols assigned spatially varying distributions, where hygroscopic components act as CCN, dust particles act as IN, and all aerosol species influence radiative transfer. Cloud microphysics is coupled with detailed charge separation and discharge processes to enable the lightning simulation. The framework is evaluated using two thunderstorms in Guangdong, China. For an isolated storm, the model successfully reproduces the observed tripolar charge structure (positive–negative–positive), demonstrating its capability in simulating cloud electrification. For a frontal storm, it captures well the observed precipitation and lightning, and shows that increasing CCN suppresses the rainfall while enhancing the lightning. Higher CCN concentrations produce more numerous but smaller cloud droplets, which suppresses the coalescence into rain droplets, allows a greater number of droplets to loft into the upper troposphere, and forms more but smaller cloud ice particles. This boosts graupel–ice collisions, intensifies non-inductive charging, strengthens the upper positive charge and the vertical electric-field gradient, ultimately increasing the lightning frequency. In contrast, no significant aerosol-induced invigoration of updrafts is observed. These results highlight the dominant role of aerosol microphysical effects over dynamical invigoration in modulating thunderstorm electrification and lightning activity.

How to cite: Wang, W., Chen, G., and Zhang, Y.: A framework for modeling aerosol-cloud-lightning interactions: Validation of charge structure and aerosol effects, EGU General Assembly 2026, Vienna, Austria, 3–8 May 2026, EGU26-6493, https://doi.org/10.5194/egusphere-egu26-6493, 2026.

EGU26-8881 | ECS | Posters virtual | VPS2

Effect of decadal land use change on WRF model-simulated surface meteorological parameters over the Indian region 

Ipsita Putatunda, Rakesh Vasudevan, and Randhir Singh

Variations in land surface characteristics directly alter surface biophysical properties like albedo, roughness length, and canopy resistance, leading to changes in surface radiative and turbulent fluxes. These changes influence sensible and latent heat fluxes, which can further regulate surface temperature, evapotranspiration, and near-surface moisture transport. Thus, variations in surface fluxes associated with changes in land-surface properties can regulate convective instability, moisture convergence, and can modulate short-range rainfall characteristics and their predictability. Such land–atmosphere feedbacks are particularly important over the Indian region, where strong seasonal contrasts and heterogeneous land surfaces play a critical role in shaping rainfall variability. Hence, this study investigates the sensitivity of short-range precipitation forecasts over India to decadal changes in land use and vegetation during the pre-monsoon and monsoon periods. USGS 24-category land use data based on the 1994 landscape is used as the control run. Seven different simulation experiments are conducted using WRF model with various land use and vegetation data from MODIS and ISRO; ie: Experiment1 (MODIS 2001, USGS LAI and VF default), Experiment 2 (MODIS 2001, LAI and VF default), Experiment 3 (MODIS 2019, LAI and VF default), Experiment 4 (MODIS 2001, with Urban Class of 2019, LAI, and VF default), Experiment 5 (MODIS 2001, with water bodies of 2019, LAI, and VF default), Experiment 6 (MODIS 2019, LAI and VF of 2019), Experiment 7 (ISRO 2018-2019, VF and LAI default). A comprehensive assessment based on quantitative error metrics and categorical forecast skill scores demonstrates statistically significant improvements in rainfall forecast performance following the assimilation of updated land-use and vegetation datasets.  These statistically robust improvements indicate that realistic representation of land-surface conditions contributes meaningfully to enhanced short-range precipitation predictability. The computed Extreme Dependency Index (EDI) values indicate an enhanced ability of the model to capture rare extreme rainfall events following the incorporation of updated land-use information. The incorporation of realistic land-use classifications derived from MODIS and ISRO datasets led to improved simulations of surface meteorological variables, including temperature, wind speed, relative humidity, surface pressure, and surface fluxes. Corresponding improvements were also observed in the vertical atmospheric profiles for wind, temperature, and specific humidity profiles. These enhancements indicate a more realistic depiction of land–atmosphere interactions and boundary-layer processes in the model.

How to cite: Putatunda, I., Vasudevan, R., and Singh, R.: Effect of decadal land use change on WRF model-simulated surface meteorological parameters over the Indian region, EGU General Assembly 2026, Vienna, Austria, 3–8 May 2026, EGU26-8881, https://doi.org/10.5194/egusphere-egu26-8881, 2026.

EGU26-9211 | ECS | Posters virtual | VPS2

Kilometer Scale Climate Modeling of Extremes: Evaluation of the NonHydrostatic Regional Climate Model (NHRCM) over Pakistan 

Muhammad Mamoor, Akif Rahim, Muhammad Yaseen, Raheela Naz, Tasneem Kosar, Nadeem Tariq, and Amina Akif

Rising global warming is accelerating climate extremes at regional scales worldwide. Capturing these extremes at the regional level requires high resolution climate modeling capable of representing complex topography and strong land atmosphere interactions. In this study, a high-resolution Non-Hydrostatic Regional Climate Model (NHRCM) is configured at a kilometer scale resolution (5 km) through dynamic downscaling of the MRI AGCM 3.2 outputs developed by the Meteorological Research Institute of Japan (MRI). Daily precipitation and temperature (maximum and minimum) data are generated at 5 km resolution for the historical period (1980–2000) and the future period (2081–2100) under the high emission climate scenario SSP585. The performance of the downscaled climate variables is evaluated against ERA5 Land data after resampling to the same resolution as the NHRCM. Statistical metrics and extreme climate indices are used to quantify model skill and biases at regional and sub regional scales over Pakistan. The results reveal a strong correlation in high elevation regions of Pakistan compared to the plains. After evaluating model performance, precipitation and temperature extreme indices are calculated for both historical and future periods. The findings indicate an increase in precipitation in the southern regions of Pakistan, accompanied by rising temperatures. These trends are also associated with an increase in short-duration intense rainfall events during summer and prolonged dry conditions in winter. Furthermore, the frequency of heatwaves is expected to rise by the end of the century across Pakistan, along with increasing temperatures in snow fed regions. Overall, this study highlights the added value of high-resolution nonhydrostatic regional climate modeling in understanding and assessing climate extremes over Pakistan, providing a robust foundation for future climate impact assessments and adaptation planning.


How to cite: Mamoor, M., Rahim, A., Yaseen, M., Naz, R., Kosar, T., Tariq, N., and Akif, A.: Kilometer Scale Climate Modeling of Extremes: Evaluation of the NonHydrostatic Regional Climate Model (NHRCM) over Pakistan, EGU General Assembly 2026, Vienna, Austria, 3–8 May 2026, EGU26-9211, https://doi.org/10.5194/egusphere-egu26-9211, 2026.

EGU26-14298 | Posters virtual | VPS2

Characterizing cold pools in the ITCZ using soundings from the ORCESTRA campaign 

Raphaela Vogel, Lennart Mann, Nina Robbins-Blanch, and Nicolas Rochetin

In this study we analyze the occurrence of cold pools in the tropical Atlantic during the ORCESTRA field campaign (August to September 2024), using data collected from over 2000 soundings. We first tested whether the method to detect cold pools based on the mixed-layer height, developed for shallow convective cold pools in the winter trades during EUREC4A, is applicable to the deep convective regime of the ITCZ. The validation by a surface-based detection method and the investigated recovery behaviour of the mixed layer after a cold pool demonstrates its applicability to this environment. On this basis, we examine the distribution and properties of cold pools within the tropical Atlantic. A total of 26% of all ORCESTRA soundings detected cold pools, compared to only 7% during the EUREC4A campaign in the winter trades. The ITCZ region with the highest moisture content and presumably deepest convection features the largest number of cold pools. This presentation will further discuss how the cold pool strength and frequency correlate with wind, moisture and stability.

How to cite: Vogel, R., Mann, L., Robbins-Blanch, N., and Rochetin, N.: Characterizing cold pools in the ITCZ using soundings from the ORCESTRA campaign, EGU General Assembly 2026, Vienna, Austria, 3–8 May 2026, EGU26-14298, https://doi.org/10.5194/egusphere-egu26-14298, 2026.

EGU26-15029 | Posters virtual | VPS2

All-Sky Camera Upward-looking Thermal Infrared Cloud Characteristics 

Matthew Miller and Sandra Yuter

Satellite data sets are the primary source of observations of cloud characteristics, but downward-looking passive sensors cannot see lower-level clouds obscured by higher clouds nor cloud bases. Observations of low clouds with downward-looking satellite IR are hampered by the small brightness temperature differences between the low cloud top and the underlying surface. In contrast, upward-looking thermal IR can readily distinguish warm clouds against the cold sky. By sampling thermal IR cloud characteristics across the diurnal cycle, upward looking thermal IR observations have the potential to yield improved understanding of transitions in cloudiness at sunrise and sunset and differences in the relative importance of different cloud processes with and without SW fluxes.

Our thermal IR all-sky camera was assembled from commercially available, off-the-shelf parts. The key components are a FLIR Boson thermal IR camera and a FLIR PTU-5 pan-tilt mount. The IR camera has a 50° field of view and a resolution of 640x500 pixels. To obtain imagery of the entire sky, the pan-tilt mount points the camera at 14 different directions, each varying in azimuth and elevation. The volume coverage pattern is executed once per minute, and the entire sky is sampled in less than 30 seconds. The images are then stitched together in software to yield a hemispherical array of IR brightnesses from horizon to horizon.

From the imagery we can infer cloud fraction, cloud coverage characteristics relating to the size and shapes of cloud elements, and estimate the altitude of cloud bases at all times of day. Sequences of images reveal the evolution of individual cloud elements and provide information on the phase space of cloud properties across the diurnal cycle and to related to air mass changes, such as the passage of fronts. Combined with other data from lidar and visible all sky cameras, the upward-looking thermal IR data on cloud outer surface temperature details at small spatial scale (10s of meters) and few minute time scale have high potential to yield new insights on cloud initiation and dissipation.

We will detail the performance of the thermal IR all-sky camera and analyze derived cloud characteristics in the context of data from visible wavelength all-sky imagery and additional atmospheric observations.

How to cite: Miller, M. and Yuter, S.: All-Sky Camera Upward-looking Thermal Infrared Cloud Characteristics, EGU General Assembly 2026, Vienna, Austria, 3–8 May 2026, EGU26-15029, https://doi.org/10.5194/egusphere-egu26-15029, 2026.

EGU26-15265 | ECS | Posters virtual | VPS2

Is ERA5 Fit for Purpose? A Global Multi-Variable Evaluation of Reanalysis Strengths and Weaknesses 

Warren Lewis, Sandra Yuter, and Matthew Miller

Reanalysis products, which blend weather model output with observations are commonly used as substitutes for observations to assess numerical weather prediction model forecast skill, the accuracy of climate model historical realizations, and AI training. However, the quality of reanalysis output is not uniform across all variables, times of day, seasons, or geographic settings. This study evaluates the strengths and weaknesses of ERA5 reanalysis (0.25° grid) over a multi-year period by comparing them to worldwide hourly surface observations from over 1200 stations, buoys, and radiosonde vertical profiles.

Our analysis focuses on several metrics across the diurnal cycle (7 AM and 3 PM local time) and during temperature outlier events (< 10th percentile and > 90th percentiles for the 30-year climatology). Results indicate that ERA5 provides reliable 2-meter air temperatures in most regions, but shows a frequent dry bias in dewpoint of greater than 3 ℃ more than 5% of the time for many stations in the Dry and Mediterranean climate zones. ERA5 often underestimates warm events (> 90th percentile), with the largest cold biases, less than -3 ℃ occurring more than 11% of the time in the Mediterranean climate zone. Temperature and dewpoint biases are amplified in complex terrain, and dewpoint biases tend to be larger near coastal locations. To investigate whether higher spatial resolution mitigates these issues, we also examine the performance of the ERA5-Land product  (0.1° grid). These findings emphasize the importance of evaluating the adequacy of purpose when using reanalysis for specific applications, since performance can vary significantly by variable, time of day, season, and climate zone.

How to cite: Lewis, W., Yuter, S., and Miller, M.: Is ERA5 Fit for Purpose? A Global Multi-Variable Evaluation of Reanalysis Strengths and Weaknesses, EGU General Assembly 2026, Vienna, Austria, 3–8 May 2026, EGU26-15265, https://doi.org/10.5194/egusphere-egu26-15265, 2026.

EGU26-16394 | ECS | Posters virtual | VPS2

S2S Forecast Skill Assessment for Summer Monsoon Drought Warning 

Sreepriya Sukumaran and Ankit Agarwal

Persistent extreme weather anomalies lasting several weeks to months can lead to drought and compound dry–hot extremes, posing serious socio-economic risks in the Indian monsoon region. Although subseasonal-to-seasonal (S2S) prediction systems have advanced, the extent to which these models represent drought-relevant hydroclimatic variability over India has not been adequately quantified. Here, we focus on evaluating the hindcast quality of weekly accumulated precipitation and temperature from multiple S2S models with lead times up to six weeks during the JJAS season over India. These model hindcast outputs and IMD observations are regridded to a common 0.5° resolution and analyzed using deterministic forecast skill metrics at various lead times, statistical bias correction is then applied to isolate systematic model errors, followed by SPI-based drought diagnostics, and compound dry–hot extreme indices are derived and computed. The analysis reveals modest forecast skill at early lead times, followed by a systematic decline as lead time increases, with precipitation predictability deteriorating more rapidly than temperature predictability. Although the models generally capture the large-scale spatial distribution of drought-prone regions, they significantly underestimate the frequency and spatial extent of compound dry–hot conditions, exhibiting pronounced regional dependence across India. These results highlight key limitations and identify opportunities to enhance subseasonal drought early-warning systems. 

Keywords: Subseasonal-to-seasonal predictability, Indian Summer Monsoon, Drought, Climate extremes, Hindcast evaluation

How to cite: Sukumaran, S. and Agarwal, A.: S2S Forecast Skill Assessment for Summer Monsoon Drought Warning, EGU General Assembly 2026, Vienna, Austria, 3–8 May 2026, EGU26-16394, https://doi.org/10.5194/egusphere-egu26-16394, 2026.

EGU26-18616 | ECS | Posters virtual | VPS2

Investigation of phthalate emissions from incense stick, scented candle and perfume through a chamber experiment  

Fnu Anshika and Bernhard Rappenglueck

Phthalate exposure has been rampant with the growing use of these compounds in personal care  and other plastic products. Phthalates have been associated with endocrine, neurological, and reproductive disorders resulting from their continuous release from plastic surfaces throughout their lifecycle. These endocrine disruptors are used in personal care products to increase their shelf life. This paper aims to identify phthalates and their concentration in three test materials, perfume, scented candles, and incense sticks, through a chamber experiment. This experiment aids in understanding phthalate emissions into air during the use of these materials in indoor environments. Sampling was performed using Tenax TA tubes, which were placed inside the glass chambers for 30 minutes while maintaining a positive flow rate using a mass flow controller and pump. The tubes capture gas-phase phthalates efficiently. The tubes were then further analyzed using TD-30 and GC/MS. Three phthalates, which were detected in the test materials, were dimethyl phthalate (DEP), dibutyl phthalate  (DBP), and butyl benzyl phthalate (BBP). The phthalate concentration was found to be high in incense sticks, with DEP being the most prominent phthalate, followed by DBP. Scented candles had the high concentration of DBP, followed by BBP. A similar pattern was observed in perfumes. The high concentrations of these compounds detected in the test materials underscore growing concerns about the widespread use of phthalates in  manufacturing of plastic products.

How to cite: Anshika, F. and Rappenglueck, B.: Investigation of phthalate emissions from incense stick, scented candle and perfume through a chamber experiment , EGU General Assembly 2026, Vienna, Austria, 3–8 May 2026, EGU26-18616, https://doi.org/10.5194/egusphere-egu26-18616, 2026.

EGU26-18929 | ECS | Posters virtual | VPS2

Black crust as a passive sampler of urban pollution on the heritage buildings in Delhi, India: An analytical and modelling approach 

Gaurav Kumar, Bhola Ram Gurjar, Mukesh Sharma, and Chandra Shekhar Prasad Ojha

Delhi is one of the most polluted megacities in the world. Since the ancient era, Delhi has been known for its rich heritage sites like the Red Fort, Humayun’s Tomb, and Qutub Minar, which are UNESCO World Heritage Sites. In this study, we investigate urban pollution-linked alterations at the heritage buildings (HBs) of Delhi, India, through a comparative characterization of deposited black crust (BC) and the underlying red sandstone (RS) collected from the exposed surfaces of the HBs. The BC on HBs can act as an integrative passive sampler of urban pollution, recording particulate matter, reactive gases (SOx/NOx), and associated heavy metal deposition. To achieve this objective, we applied a multi-analytical workflow combining X-ray diffraction (XRD), X-ray fluorescence (XRF), scanning electron microscopy with energy-dispersive X-ray spectroscopy (SEM–EDX), Fourier transform infrared spectroscopy (FTIR), carbonaceous analysis, and inductively coupled plasma mass spectrometry (ICP-MS) resolved phase assemblages, morphology, major-elemental composition profiles, and signatures of trace elements. The outcome suggests that the urban pollution sources, including vehicular emissions, road/construction/soil dust, industrial activity, and biomass burning, were identified as fingerprints of calcium (Ca) and sulfur (S) in the formed BC at the RS substrate. In this scenario, BC was enriched with Ca and S, which may cause sulfation phenomena to occur at the RS substrate as it contains low intrinsic Ca. Therefore, gypsum was identified as a dominant deteriorating agent, along with weddellite, bassanite, while carbon and heavy metals were also embedded in BC relative to the RS substrate. Additionally, in this work, a modeling approach is also utilized to assess the pollution dispersion impacts on the built HBs and linkage with BC deposition, which was employed using coupled WRF (Weather Research and Forecasting) and AERMOD (the American Meteorological Society/Environmental Protection Agency Regulatory Model) technique. Hence, considering these analytical and modelling approaches contributes to applying the site-specific conservation and preservation interventions in similar urban polluted environments.

How to cite: Kumar, G., Gurjar, B. R., Sharma, M., and Ojha, C. S. P.: Black crust as a passive sampler of urban pollution on the heritage buildings in Delhi, India: An analytical and modelling approach, EGU General Assembly 2026, Vienna, Austria, 3–8 May 2026, EGU26-18929, https://doi.org/10.5194/egusphere-egu26-18929, 2026.

EGU26-19311 | ECS | Posters virtual | VPS2

A Phase-Plane Representation of the Convective Life Cycle: Characterizing Diabatic and Adiabatic Drivers during the Indian Summer Monsoon 

Soumili Chakraborty, Akshaya Nikumbh, Vijit Maithel, and Tukaram Zore

Tropical deep convection evolves as a cyclic process, but most observational and modeling studies diagnose convection through regional or domain-based contrasts, obscuring how key physical processes vary across different stages of the convective life cycle. The convective life cycle in the tropics is frequently conceptualized through recharge discharge processes. While valuable, this framework can be extended with more granular, phase specific diagnostics to better understand the distinct physical processes governing each stage of convection. Here, we build on existing phase-plane approaches to represent convection as a cyclic process, using column-integrated moist static energy (MSE) and its temporal tendency as the primary state variables. The phase plane is constructed with column integrated MSE along the horizontal axis and its temporal derivative along the vertical axis. While adhering to the established recharge–discharge paradigm, we extend this terminology by defining four distinct, cycle-consistent stages on the phase plane: Build-up, Cresting, Decay, and Recovery. Applying this framework to the Indian Summer Monsoon (ISM) core region, we map quasi-geostrophic (QG) omega-scaled precipitation components onto the MSE phase plane  to investigate the relative contributions of diabatic heating  and adiabatic forcing across the convective life cycle. These stage dependent signatures demonstrate the utility of the MSE phase plane for attributing and relative importance of dynamical and diabatic processes across the convective life cycle. Final results and extended analyses will be presented and discussed at the conference.

How to cite: Chakraborty, S., Nikumbh, A., Maithel, V., and Zore, T.: A Phase-Plane Representation of the Convective Life Cycle: Characterizing Diabatic and Adiabatic Drivers during the Indian Summer Monsoon, EGU General Assembly 2026, Vienna, Austria, 3–8 May 2026, EGU26-19311, https://doi.org/10.5194/egusphere-egu26-19311, 2026.

EGU26-20505 | ECS | Posters virtual | VPS2

Cost-Effective ECMWF AIFS Ensemble Inference for Subseasonal Forecasting in East Africa  

Eunice Koech, Nishadh Kalladath, Anthony Mwanthi, Alex Ogelo, Jason Kinyua, Hillary Koros, Mark Lelaono, Herbert Misiani, Tamirat Bekele, Hussen Seid, Masilin Gudoshava, and Ahmed Amdihun

In Eastern Africa, subseasonal forecasts are critical for early warning systems as climate extremes severely impact food security and livelihoods. ECMWF Artificial Intelligence Forecasting System (AIFS ENS v1.0) , an ensemble-based probabilistic data-driven forecast model developed by ECMWF offers unprecedented opportunities for regional applications through AI-driven weather prediction, but GPU compute costs and data access challenges limit deployment. As participants in the ECMWF AI Weather Quest, we developed solutions enabling cost-effective, cloud-based AIFS ensemble forecasting tailored for regional climate centers.  


We implemented a workflow (https://github.com/icpac-igad/ea-aifs) leveraging Google Cloud Platform infrastructure. Initial conditions are accessed via ECMWF's IFS data stored at AWS (Amazon Web Service) open data program at S3 Cloud storage using GRIB index-kerchunk, and VirtualiZarr methods for efficient data streaming without local storage overhead. The workflow employs experimental FP16 (half-precision) inference on AIFS ensemble models along with the standard FP32, evaluating GPU memory requirements and enabling deployment on cost-effective T4/L4 GPUs rather than expensive A100 instances.  


Verification results from the SON (September-October-November) 2025 season as part of the AI Weather Quest demonstrates that Team Fahamu's submission using AIFS ensemble forecasts for temperature and mean sea-level pressure outperforms climatology benchmarks. Regional evaluation over East Africa reveals promising subseasonal skill for temperature at lead times of 2-4 weeks—critical timescales for agricultural planning and anticipatory drought/flood action—while evaluation of precipitation forecasts is ongoing. This method provides a scalable template for regional climate centers globally to operationalize state-of-the-art AI weather models cost-effectively, advancing the democratization of advanced forecasting capabilities. 

How to cite: Koech, E., Kalladath, N., Mwanthi, A., Ogelo, A., Kinyua, J., Koros, H., Lelaono, M., Misiani, H., Bekele, T., Seid, H., Gudoshava, M., and Amdihun, A.: Cost-Effective ECMWF AIFS Ensemble Inference for Subseasonal Forecasting in East Africa , EGU General Assembly 2026, Vienna, Austria, 3–8 May 2026, EGU26-20505, https://doi.org/10.5194/egusphere-egu26-20505, 2026.

EGU26-21148 | ECS | Posters virtual | VPS2

Nocturnal boundary-layer ventilation failure governs heatwave persistence in South Asia 

Md. Aminul Haque Laskor, Salah Uddin Ahmed Dipu, Faysal Bhuiyan, and A.K.M. Saiful Islam

Persistent heatwaves across South Asia impose severe and growing impacts, yet the atmospheric processes that sustain extreme heat over multiple days remain incompletely understood. This study aims to determine whether heatwave persistence is driven by failures of nocturnal boundary-layer ventilation, rather than by daytime temperature extremes alone. We analyze pre-monsoon (March–May) heatwaves across South Asia (65°E–98°E, 5°N–35°N) from 1981 to 2024 using ERA5 hourly reanalysis, which includes near-surface air temperature, boundary-layer height, near-surface winds, and surface sensible heat flux. Heatwaves are identified using a percentile-based definition of daily maximum temperature, and nighttime conditions are diagnosed consistently using local solar time. Nocturnal ventilation is quantified through a physically interpretable ventilation potential combining nighttime boundary-layer height and near-surface wind speed, complemented by diagnostics of turbulent mixing and nocturnal cooling. We find that heatwave nights are consistently characterized by suppressed nocturnal ventilation, including shallow boundary layers, weak winds, and reduced turbulent exchange, and that reductions in nighttime ventilation are more strongly associated with heatwave duration and nighttime heat accumulation than daytime temperature anomalies. Composite analyses further indicate that ventilation and turbulent mixing weaken before heatwave onset and remain suppressed throughout the persistence phase, with particularly pronounced effects in humid regions such as Bangladesh. Our findings demonstrate that nocturnal boundary-layer ventilation failure is a central physical mechanism controlling heatwave persistence and suggest that incorporating nighttime atmospheric processes into heatwave monitoring and early-warning frameworks is essential for anticipating prolonged and high-impact heat extremes.

How to cite: Laskor, Md. A. H., Dipu, S. U. A., Bhuiyan, F., and Islam, A. K. M. S.: Nocturnal boundary-layer ventilation failure governs heatwave persistence in South Asia, EGU General Assembly 2026, Vienna, Austria, 3–8 May 2026, EGU26-21148, https://doi.org/10.5194/egusphere-egu26-21148, 2026.

EGU26-186 | ECS | Posters virtual | VPS3

3D-Printed Electrochemical Sensor for Rapid Detection of Phenolic Oxidation Products Relevant to Organic Aerosol Formation 

Abhishek Raj, Pushpendra Yadav, Ankit Sahai, and Rahul Swarup Sharma

Phenolic compounds are key precursors and intermediates in the formation and aging of secondary organic aerosols (SOA), particularly in biomass-burning plumes and urban atmospheres. However, their detection typically requires laboratory-based chromatographic or mass-spectrometric techniques, limiting rapid or on-site characterization. The current research present a fully 3D-printed electrode (3D-PE) platform produced via hybrid material extrusion additive manufacturing, providing a compact, low-cost, and field-deployable tool for electrochemical quantification of atmospheric phenolics. The device integrates PLA-based structural components with graphene and silver conductive layers deposited in a single manufacturing step. Cyclic voltammetry measurements demonstrate clear and distinct redox signatures for representative phenolic structures, with oxidation potentials of 0.48–0.68 V and well-resolved reduction peaks. These redox behaviors correspond to functional groups commonly found in lignin-derived and anthropogenically emitted aromatic species.

The 3D-PE operates with sample volumes as low as 50 µL, suitable for extracts from aerosol filters, cloud water, or fog samples. Its electroactive surface area (5.8–6.7 mm²) and high electron-transfer efficiency from the graphene electrode enable sensitive detection of trace phenolic compounds. The platform’s portability and rapid response offer new opportunities for quantifying oxidation intermediates during field campaigns, studying heterogeneous oxidation pathways, and investigating Secondary Organic Aerosol (SOA) formation dynamics.

This work demonstrates that additive manufacturing provides a promising route for developing next-generation, customizable atmospheric chemistry sensors. The 3D-printed electrochemical platform can complement established mass-spectrometric techniques by enabling low-cost, high-frequency measurements of reactive organic compounds that play central roles in SOA formation and atmospheric oxidative chemistry.

How to cite: Raj, A., Yadav, P., Sahai, A., and Sharma, R. S.: 3D-Printed Electrochemical Sensor for Rapid Detection of Phenolic Oxidation Products Relevant to Organic Aerosol Formation, EGU General Assembly 2026, Vienna, Austria, 3–8 May 2026, EGU26-186, https://doi.org/10.5194/egusphere-egu26-186, 2026.

EGU26-323 | ECS | Posters virtual | VPS3

Aerosol-cloud interactions under fine-mode and coarse-mode aerosol conditions over the monsoon region of Pakistan 

Kashif Anwar, Yangang Liu, Abdulhaleem Labban, and Özgür Zeydan

Abstract

The densely populated monsoon region of Pakistan, influenced by a diverse mix of natural and anthropogenic aerosols, provides a natural laboratory to investigate aerosol impacts on cloud properties. Using a decade-long (2015–2024) dataset from MODIS, MERRA-2, and ERA5, we examine the response of non-precipitating warm clouds to fine-mode and coarse-mode aerosols. We find positive correlations between aerosol optical depth (AOD) and cloud effective radius (CER), with stronger sensitivity to fine-mode AOD. The relationships of AOD with cloud optical thickness (COT) and liquid water path (LWP) are generally negative, but more pronounced for coarse-mode AOD. These aerosol-cloud relationships are strongly modulated by meteorological conditions: low relative humidity and low lower-tropospheric stability enhance the negative AOD–COT and AOD–LWP responses. Additionally, the sensitivity of aerosol-cloud relationships to meteorology is greater for fine-mode AOD than coarse-mode. These results highlight the importance of aerosol size and ambient meteorology in determining cloud microphysical responses, providing insight into aerosol cloud interactions in a region critical for South Asian climate.

How to cite: Anwar, K., Liu, Y., Labban, A., and Zeydan, Ö.: Aerosol-cloud interactions under fine-mode and coarse-mode aerosol conditions over the monsoon region of Pakistan, EGU General Assembly 2026, Vienna, Austria, 3–8 May 2026, EGU26-323, https://doi.org/10.5194/egusphere-egu26-323, 2026.

EGU26-1603 | ECS | Posters virtual | VPS3

BASIC: A Boosted Aerosol-Size-Integrated XCO2 Retrieval Algorithm 

Zhujun Li and Siwei Li

Accurate retrieval of the dry-air mole fraction of CO₂ (XCO₂) is essential for tracking emissions and supporting mitigation. However, aerosols significantly alter photon path lengths through scattering and absorption, making them the largest variable error source in XCO₂ retrieval. Current efforts to improve aerosol treatment in XCO₂ retrievals, such as the Atmospheric CO₂ Observations from Space (ACOS) algorithm for the Orbiting Carbon Observatory-2 (OCO-2), primarily focus on enhancing prior estimates of aerosol optical depth (AOD), vertical distribution, and optical properties. Yet, aerosol particle size distribution (PSD) parameters—a critical microphysical factor contributing to nonlinear variations in aerosol optical properties—are held fixed and excluded from the ACOS retrieval, thereby introducing additional biases into the XCO₂ results.

To address this challenge, we developed a Boosted Aerosol-Size-Integrated XCO₂ (BASIC) retrieval algorithm that concurrently retrieves XCO₂ and aerosol PSD parameters from OCO-2 observations. Validation at five Total Carbon Column Observing Network (TCCON) sites in East Asia shows that BASIC reduces the root-mean-square error (RMSE) by 30% and 13% compared to the standard and bias-corrected OCO-2 products, respectively. The improvement primarily stems from BASIC’s ability to generate forward-modeled spectra that more closely match observations than those from ACOS, particularly in the O₂ A-band, which is highly sensitive to aerosols. These results highlight the importance of incorporating variable aerosol PSD in retrievals and demonstrate that BASIC more accurately represents aerosol effects on radiative transfer. Our findings suggest that PSD-aware retrievals can significantly improve the accuracy of satellite-derived XCO₂ estimates under highly variable aerosol loading conditions, such as those in East Asia.

How to cite: Li, Z. and Li, S.: BASIC: A Boosted Aerosol-Size-Integrated XCO2 Retrieval Algorithm, EGU General Assembly 2026, Vienna, Austria, 3–8 May 2026, EGU26-1603, https://doi.org/10.5194/egusphere-egu26-1603, 2026.

EGU26-2329 | ECS | Posters virtual | VPS3

Quantifying Urban Biogenic CO2 Fluxes in Greenhouse Gas Budgets: A Scalable Framework and Case Study 

Qing Luo, Ricard Segura-Barrero, Alba Badia, Thomas Lauvaux, Junwei Li, Jia Chen, and Gara Villalba

To advance urban sustainability and achieve climate neutrality, cities are proposing various decarbonization strategies through nature-based solutions, including the implementation of green infrastructures (GI). Accurately quantifying urban biogenic CO2 exchange is essential for developing robust greenhouse gas budgets and for distinguishing biogenic from anthropogenic contributions to atmospheric CO2 in urban environments.

This study systematically reviews current approaches for estimating urban biogenic CO2 fluxes from both measurement- and model-based perspectives, evaluating their advantages, limitations, and applicability in urban contexts. Building on this review, we present an optimized framework to quantify urban biospheric CO2 fluxes using the Vegetation Photosynthesis and Respiration Model (VPRM) driven by a high-resolution land cover map and sentinel-2 satellite data. The framework is applied to the Metropolitan Area of Barcelona for April and December 2023 at a 10 m spatial resolution. Results show that evergreen needleleaf forests and croplands act as significant carbon sinks in April, with biogenic CO2 uptake offsetting approximately 10% of anthropogenic CO2 emissions in April and 4% in December. A cross-city comparison of urban vegetation cover, climatic conditions, and the biogenic offset effects indicates that increased vegetation cover does not necessarily translate into a proportionally stronger carbon sink. Nevertheless, this study proposes that a standardized framework for accounting for biogenic CO2 fluxes and uptake should be established to provide critical support for GI-based mitigation strategies in urban planning.


How to cite: Luo, Q., Segura-Barrero, R., Badia, A., Lauvaux, T., Li, J., Chen, J., and Villalba, G.: Quantifying Urban Biogenic CO2 Fluxes in Greenhouse Gas Budgets: A Scalable Framework and Case Study, EGU General Assembly 2026, Vienna, Austria, 3–8 May 2026, EGU26-2329, https://doi.org/10.5194/egusphere-egu26-2329, 2026.

EGU26-3325 | ECS | Posters virtual | VPS3

Long Term Analysis of Aerosol Properties Over the Eastern Mediterranean Using Grasp Retrieved AERONET Data 

Ahmet Semih Çetiner and S. Yeşer Aslanoğlu

This study presents a comprehensive climatological analysis of aerosol optical and microphysical properties over the Eastern Mediterranean, utilizing long-term AERONET measurements from Mersin/Erdemli (IMS-METU) site. The Generalized Retrieval of Aerosol and Surface Properties (GRASP) algorithm was used to retrieve key parameters, including Aerosol Optical Depth (AOD), Single Scattering Albedo (SSA), and Volume Size Distribution, offering robust separation of surface and aerosol properties.

Results revealed a distinct seasonal cycle in aerosol loading, with AOD peaking in summer (July-August) due to fine-mode pollution and exhibiting a secondary peak in spring (April) driven by mineral dust transport from desert regions. The annual mean SSA displays a negative spectral slope, decreasing from ~0.93 at 440 nm to ~0.90 at 1020 nm, indicating a background atmosphere dominated by fine-mode urban-industrial aerosols. Although winter months exhibit the lowest total aerosol load due to wet scavenging, they display the strongest absorption characteristics. The imaginary refractive index significantly exceeds 0.015, and SSA values drop sharply during winter, attributed to Black Carbon emissions from domestic heating. The volume size distribution maintains a bimodal structure year-round; while the coarse mode dominates during spring dust events, the fine mode contribution remains substantial across all seasons. The aerosol population over the Eastern Mediterranean is characterized as a heterogeneous mixture where the anthropogenic fine-mode background is periodically modulated by natural mineral dust intrusions and local carbonaceous emissions.

How to cite: Çetiner, A. S. and Aslanoğlu, S. Y.: Long Term Analysis of Aerosol Properties Over the Eastern Mediterranean Using Grasp Retrieved AERONET Data, EGU General Assembly 2026, Vienna, Austria, 3–8 May 2026, EGU26-3325, https://doi.org/10.5194/egusphere-egu26-3325, 2026.

EGU26-4386 | ECS | Posters virtual | VPS3

Surface energy forcing modulates ozone variability independently of air temperature over the Tibetan Plateau 

Cheng Zhao, Yaozhou Wang, Yujin Liu, Wenjie Li, Dingzhen Gongga, Deqing Quzhen, Yaokai Ao, Jinpeng Yue, Xiaoping Zhong, and Xiaohui Du

 Meteorological normalization of surface ozone typically relies on air temperature to proxy both photochemical activity and boundary-layer dynamics. However, this approach implicitly assumes that the thermal state adequately represents radiative energy input—an assumption that remains untested in high-elevation environments where strong solar forcing and a thin atmosphere may decouple temperature from the surface energy balance. Here, we examine how surface energy forcing modulates ozone variability independently of air temperature using continuous station-level measurements in Lhasa (3650 m a.s.l.), Tibetan Plateau. By stratifying days based on net radiative input while explicitly constraining thermal conditions through a counterfactual matched-pair analysis, we isolate energy-driven processes without invoking reanalysis-based boundary-layer estimates. Results demonstrate that high-energy states consistently exhibit enhanced morning ozone growth (median +4.3 ppb h-1) and elevated daytime concentrations relative to temperature-matched low-energy states. These enhancements are accompanied by coherent multi-tracer responses, including moisture drying and the dilution of primary pollutants, which provide observational constraints on energy-driven vertical coupling that are distinct from temperature-dependent photochemistry. Furthermore, a rate-based robustness analysis confirms that these signals persist across varying stratification thresholds. We conclude that surface energy forcing represents a previously under-constrained structural factor in conventional ozone attribution frameworks, particularly in complex terrain where thermal and radiative states frequently decouple. 

How to cite: Zhao, C., Wang, Y., Liu, Y., Li, W., Gongga, D., Quzhen, D., Ao, Y., Yue, J., Zhong, X., and Du, X.: Surface energy forcing modulates ozone variability independently of air temperature over the Tibetan Plateau, EGU General Assembly 2026, Vienna, Austria, 3–8 May 2026, EGU26-4386, https://doi.org/10.5194/egusphere-egu26-4386, 2026.

EGU26-5251 | ECS | Posters virtual | VPS3

AtmoSTEM: A high-resolution spatiotemporal emission model for urban air quality applications 

Anastasia Kakouri, Georgios Filippis, Marios-Bruno Korras-Carassa, Jereon Kuenen, Nikolaos Hatzianastassiou, Christos Matsoukas, and Themistoklis Kontos

As growing environmental pressures challenge urban resilience, sustainability, and human well-being, the lack of high-resolution geospatial information at the urban or intra-urban scale remains a critical limitation for effective and targeted decision-making. In the context of air quality and associated health impacts, this study addresses this gap by developing the Atmospheric SpatioTemporal Emissions Model (AtmoSTEM), a high-resolution spatiotemporal framework for representing atmospheric emissions, pollutant concentrations, and population exposure at 1 km2 resolution. The application focuses on the Ioannina basin in Greece, where residential biomass burning (BB) constitutes a dominant emission source, especially during the cold season, frequently leading to pollution levels exceeding the World Health Organization (WHO) Air Quality Guidelines (AQG) and EU thresholds and underscoring the need for targeted interventions.

For this purpose, a high spatiotemporal emission inventory for Residential Heating is developed. The Copernicus Atmosphere Monitoring Service (CAMS) regional emission inventory, structured according to the GNFR classification and provided at a spatial resolution of 0.05° × 0.1°, serves as the baseline dataset. The downscaling process is based on publicly available, open-access, GNFR-dependent high-resolution spatial proxies, including the Coordination of Information on population density data from Global Human Settlement (GHSL), land-use classifications from the Copernicus Land Monitoring Service (CLC 2018), the OpenStreetMap (OSM) road network, and, where applicable in coastal and maritime domains, marine traffic density from the European Marine Observation and Data Network (EMODNet). Particular emphasis is placed on refining pollutant fields that are more relevant to BB activities, thereby improving the spatial representativeness of BB emissions within urban and peri-urban environments.

To capture the temporal variability of the emissions, CAMS is combined with CAMS temporal Regional Profiles (CAMS-TEMPO), enabling the generation of analytically resolved, hourly emission estimates. Pollutant concentrations are then estimated using a Random Forest machine learning model that integrates AtmoSTEM’s high-resolution emissions, with meteorological, satellite-derived, and spatial data, as well as in-situ air quality measurements provided by the University of Ioannina. The resulting high-resolution concentration fields are evaluated against independent in-situ measurements. Additionally, BB-related PM2.5 fields are derived and analyzed, enabling improved source-specific characterization of residential heating contributions and providing a physically consistent basis for air-quality and exposure assessments.

How to cite: Kakouri, A., Filippis, G., Korras-Carassa, M.-B., Kuenen, J., Hatzianastassiou, N., Matsoukas, C., and Kontos, T.: AtmoSTEM: A high-resolution spatiotemporal emission model for urban air quality applications, EGU General Assembly 2026, Vienna, Austria, 3–8 May 2026, EGU26-5251, https://doi.org/10.5194/egusphere-egu26-5251, 2026.

EGU26-5443 | Posters virtual | VPS3

Automated nighttime contrail detection using spatio-temporal clustering of Raman lidar measurements  

Florian Mandija, Philippe Keckhut, Dunya Alraddawi, Abdanour Irbah, Alain Sarkissian, Sergey Khaykin, Frédéric Peyrin, and Jean-Luc Baray

We present an automated procedure that combines lidar measurements, ADS-B flight tracks and ECMWF ERA5 meteorological data to detect and characterise nighttime aircraft contrails. Measurements have been carried out at the Observatory of Haute-Provence (OHP) in France. Lidar scattering-ratio profiles were processed with a sensitivity-driven spatio-temporal discrimination algorithm to identify contrail “spots” and aggregate them into contrail signatures. A parameter score identifies an optimal discrimination threshold set that balances sensitivity and false positives. In our case, these thresholds took these values: scattering ratio SR ≈ 2.1; temporal aggregation ≈ 7.2 min; vertical separation ≈ 0.3 km. Applied to five nighttime events, the method yields mean contrail altitudes of 8.7–10.3 km, geometrical thicknesses of 0.1–1.1 km, horizontal widths 2–3 km, and optical depths (COD) of ≈0.05–0.40. Persistent contrails are associated with ice-supersaturated layers and temperatures below −41 °C. Contrail optical depth resulted well correlated with both vertical thickness and horizontal extent. We have demonstrated that combining lidar with ADS-B and ERA5 substantially improves detection and discriminates contrails from natural cirrus at night, a regime where passive satellite retrievals are limited. This approach is automatic, transferable and reproducible, offering robust validation data for satellite algorithms and improved contrail parameterizations in climate models.

How to cite: Mandija, F., Keckhut, P., Alraddawi, D., Irbah, A., Sarkissian, A., Khaykin, S., Peyrin, F., and Baray, J.-L.: Automated nighttime contrail detection using spatio-temporal clustering of Raman lidar measurements , EGU General Assembly 2026, Vienna, Austria, 3–8 May 2026, EGU26-5443, https://doi.org/10.5194/egusphere-egu26-5443, 2026.

EGU26-8607 | ECS | Posters virtual | VPS3

Long-term spatiotemporal evolution and source attribution of smoke aerosols in Northeast China 

Xuhui Gao and Natallia Miatselskaya

Smoke aerosols constitute a critical component of atmospheric pollutants and radiative forcing agents. Northeast China is frequently afflicted by smoke episodes. Driven by the combined impacts of anthropogenic emissions, residential heating, agricultural biomass burning, and other factors, this region exhibits complex aerosol characteristics with pronounced seasonal variations. This study systematically evaluates the spatiotemporal evolution of smoke aerosols from 2015 to 2023 using GEOS-Chem global simulations (2°×2.5°), along with ground-based PM2.5 measurements, sun photometer AOD measurements in Harbin, MODIS, and VIIRS fire data. We classified the region into six distinct sub-regions based on smoke concentration characteristics: four urban zones (Dalian, Shenyang, Changchun, Harbin) and two rural zones (Eastern Coastal and Western Inland). Observational and simulation data demonstrates that the model captures regional seasonal variability and annual trends. Employing the HYSPLIT model and Concentration Weighted Trajectory (CWT) analysis, we identified potential external source regions and initially assessed the relative contribution of cross-regional transport (e.g., from Siberia or North China) to smoke episodes across different seasons. This comprehensive analysis provides a scientific basis for understanding the climatic effects of aerosols and formulating refined regional air quality management strategies in Northeast China.

How to cite: Gao, X. and Miatselskaya, N.: Long-term spatiotemporal evolution and source attribution of smoke aerosols in Northeast China, EGU General Assembly 2026, Vienna, Austria, 3–8 May 2026, EGU26-8607, https://doi.org/10.5194/egusphere-egu26-8607, 2026.

EGU26-8822 | ECS | Posters virtual | VPS3

Seasonal variation of organic sources during the post-monsoon and spring seasons across multiple urban sites of the Indo-Gangetic Plain using a mobile lab platform 

Akanksha Lakra, Sachchida Nand Tripathi, Davender Sethi, Ambasht Kumar, Himadri Sekhar Bhowmik, and Ashutosh Kumar Shukla

The Indo-Gangetic Plain (IGP) experiences strong seasonal and spatial heterogeneity in aerosol composition, driven by variations in emissions, meteorology, and regional transport. Capturing these variations requires measurement approaches that extend beyond conventional fixed-site monitoring. In this study, we deployed a mobile lab platform equipped with aerosol instrumentation, including a high-resolution time-of-flight aerosol mass spectrometer (HR-ToF-AMS), to investigate seasonal variability in organic aerosol (OA) sources during the post-monsoon and spring seasons across distinct urban environments in Lucknow, located in the central Indo-Gangetic Plain.

Field campaigns were conducted during the post-monsoon and spring seasons at Babasaheb Bhimrao Ambedkar University (BBAU), a site influenced by traffic near major highways, and at the Council of Scientific & Industrial Research–Central Institute of Medicinal and Aromatic Plants (CSIR-CIMAP), located adjacent to a forested area. Additional measurements were conducted during the spring season at the Uttar Pradesh Pollution Control Board (UPPCB) site, which represents a residential–commercial environment.

At each location, the mobile laboratory was operated for approximately 10–15 days, enabling continuous, near real-time characterization of fine particulate matter and associated co-pollutants. Measurements of non-refractory PM2.5 (NR-PM2.5) chemical composition (measured using HR-ToF-AMS) were supported by simultaneous observations of trace elements, black carbon, gaseous species, total PM2.5 mass, and meteorological parameters. This integrated, multi-instrument framework allowed for a consistent comparison of aerosol chemical signatures across sites and seasons, while capturing short-term variability linked to local emissions, atmospheric processing, and regional transport.

Organic aerosol dominated the mass of NR-PM2.5 across all sites and seasons, contributing more than 50% of the total NR-PM2.5. Source apportionment using Positive Matrix Factorization (PMF) with the multilinear engine (ME-2) resolved hydrocarbon-like OA (HOA), biomass-burning OA (BBOA), oxidized biomass-burning OA (O-BBOA), and secondary oxygenated OA components (SVOOA and LVOOA). During the post-monsoon period, BBOA accounted for approximately 28–40% of total OA across the sites, indicating a strong combustion influence under shallow boundary-layer conditions. Traffic-related HOA contributed about 8–13% of OA, with enhanced fractions at the highway-influenced BBAU site, reflecting local vehicular emissions. In contrast, springtime conditions showed enhanced secondary OA contributions (70-60%), with trajectory-based analyses highlighting the role of long-range transport in shaping aerosol composition.

The use of a mobile laboratory enabled rapid deployment across diverse land-use environments while maintaining consistent instrumentation and methodology, allowing robust inter-site and inter-seasonal comparisons. This approach emphasises the significance of high-resolution mobile observations for elucidating the fine-scale spatial variability and seasonal evolution of organic aerosol sources in the complex urban regions of the IGP.

How to cite: Lakra, A., Tripathi, S. N., Sethi, D., Kumar, A., Bhowmik, H. S., and Shukla, A. K.: Seasonal variation of organic sources during the post-monsoon and spring seasons across multiple urban sites of the Indo-Gangetic Plain using a mobile lab platform, EGU General Assembly 2026, Vienna, Austria, 3–8 May 2026, EGU26-8822, https://doi.org/10.5194/egusphere-egu26-8822, 2026.

EGU26-11855 | ECS | Posters virtual | VPS3

Global Implications of a Low Soil Moisture Threshold for Microbial Hydrogen Uptake  

Linta Reji, Matteo Bertagni, Fabien Paulot, Qianhui Qin, and Xinning Zhang

The impact of increasing anthropogenic hydrogen (H2) emissions on Earth’s radiative balance depends on the soil microbial H2 sink—the largest and most uncertain term in the global H2 budget. Soil moisture is a primary but poorly quantified control regulating the soil sink. Here, we assess the sensitivity of microbial H2 oxidation to soil moisture in laboratory experiments with temperate and arid soils spanning distinct textures. H2 oxidizer activity is observed down to –70 to –100 MPa water potentials across soils, which are among the driest conditions reported for microbial activity and are much drier than assumed in global simulations of H2. Using genome-resolved meta-omics, we link H2 oxidation dynamics in temperate soils to specific desiccation-adapted microbial taxa that contribute differentially to H2 uptake along the moisture gradient. Through global simulations, we show that our observationally constrained drier moisture threshold increases the contribution of arid and semi-arid regions for soil H2 uptake by 4-7 percentage points (pp), while decreasing the contribution of temperate and continental regions (−7 pp). Our results highlight the importance of H2 uptake under extreme hydrological conditions, particularly the roles of desertification, dryland expansion, and H2-oxidizer ecophysiology in modulating long-term changes in H2 uptake.

How to cite: Reji, L., Bertagni, M., Paulot, F., Qin, Q., and Zhang, X.: Global Implications of a Low Soil Moisture Threshold for Microbial Hydrogen Uptake , EGU General Assembly 2026, Vienna, Austria, 3–8 May 2026, EGU26-11855, https://doi.org/10.5194/egusphere-egu26-11855, 2026.

EGU26-12630 | ECS | Posters virtual | VPS3

Closed to Open-Celled Mixed-Phase Cloud Transition Over the Nordic Seas Under High Aerosol Loading 

Samuel Ephraim, Paquita Zuidema, Aaron Bansemer, Lintong Cai, Owen Cruikshank, Nikolaos Evengeliou, Jeff French, Bart Geerts, Coltin Grasmick, Andreas Massling, Greg McFarquhar, Gunnar Noel, Marcus Petters, Elise Rosky, Henrik Skov, Jefferson Snider, Tyler Tatro, Zhien Wang, Sarah Woods, and Lu Zhang

A closed to open-celled transition of mixed-phase clouds within a marine cold air outbreak (MCAO), driven by an occluded cyclone over the Nordic Seas, is interrogated with data acquired during the Cold Air Outbreak Experiment in the Sub-Arctic Region (CAESAR) field campaign on 29 February 2024. The understanding of these transitions is a challenge for numerical prediction models due to their small scale but important for weather and climate prediction, as open celled conditions have stronger updrafts supporting locally high precipitation rates along with a lower cloud fraction (lower albedo) than closed celled conditions. Measurements indicate that a stratiform (closed cell convective) cloud deck with cloud top heights of ~1230 m and liquid water paths (LWP) of ~130 gm-2, within a boundary layer with aerosol number/CCN surpassing 600 cm-3, deepen to heights of ~1520 m with LWPs of ~270 gm-2 over 250 km of fetch, before transitioning into an open-celled convective structure with cloud tops reaching up to 2220 m. Cooling free tropospheric temperatures with fetch, which reduce the inversion strength thereby enhancing growth by entrainment may encourage boundary layer growth. Open-cells are  more glaciated than closed-cells with mean LWPs falling from 270 gm-2 to 80 gm-2 across the transition, however isolated peaks of LWP within updrafts of open cells occasionally surpass 500 gm-2. Minimal secondary ice production (SIP) is observed in closed cells with ice nucleating particle and ice number concentrations ~2 L-1 with cloud temperatures between -20oC and -15oC. In open cellular convection (cloud temperatures between -22oC and -15oC), ice number concentrations reach ~10 L-1 indicating SIP. High aerosol concentrations are hypothesized to support the maintenance of closed-celled convection, with 80% of drops smaller than 10 μm reducing the riming efficiency. Small droplets also limit the production of freezing drizzle, which is hypothesized to limit the potential of SIP due to freezing/fragmentation within closed cell convection. Only after aerosol concentrations are depleted through scavenging and/or entrainment are SIP processes able to become more effective and precipitation particles able to grow large and dense enough to reach the surface and form cold pools breaking up the cloud deck. Plumes of warm moist air lifting off the ocean surface, juxtaposed with cold pools and entrainment events penetrating to the surface are documented using the Multi-function Airborne Raman Lidar (MARLi) in the first observations of its kind.

How to cite: Ephraim, S., Zuidema, P., Bansemer, A., Cai, L., Cruikshank, O., Evengeliou, N., French, J., Geerts, B., Grasmick, C., Massling, A., McFarquhar, G., Noel, G., Petters, M., Rosky, E., Skov, H., Snider, J., Tatro, T., Wang, Z., Woods, S., and Zhang, L.: Closed to Open-Celled Mixed-Phase Cloud Transition Over the Nordic Seas Under High Aerosol Loading, EGU General Assembly 2026, Vienna, Austria, 3–8 May 2026, EGU26-12630, https://doi.org/10.5194/egusphere-egu26-12630, 2026.

EGU26-13522 | ECS | Posters virtual | VPS3

Influence of Vegetation Cover on Atmospheric CO2 Mixing Ratios in the São Paulo Metropolitan Area 

Jorge Piscoya, Marco Aurélio Franco, and Maria de Fatima Andrade

Urban vegetation plays a key role in modulating atmospheric carbon dioxide (CO2) in megacities. However, studies that explicitly quantify the effect of urban vegetation on CO2 remain scarce. This study investigates how vegetation cover affects CO2 mixing ratios in the Metropolitan Area of São Paulo (MASP) during 2020–2022, using four monitoring sites with contrasting vegetation fractions: Pico do Jaraguá (PJ; 59.75%), IAG (36.38%), ICESP (22.42%), and UNICID (10.42%). Vegetation cover was derived from Sentinel-2 Level-2A imagery using NDVI-based pixel classification, while CO2 observations were obtained from the METROCLIMA network and analyzed together with concurrent meteorological variables (temperature, humidity, and wind). The analysis comprised characterizing temporal variability and quantifying vegetation effects using regression models and probability distribution functions (PDFs). Clear seasonal and diurnal patterns were observed, with lower CO2 concentrations during summer and afternoon hours (420-414 ppm), and higher values during winter and nighttime periods (447-425 ppm). The greener and less urban site, PJ, exhibited the lowest and most stable CO2 levels, whereas the highly urban UNICID site showed the highest average mixing ratios. Elevated CO2 values at IAG (428.30 ppm in summer and 435.49 ppm in winter), despite substantial vegetation cover, suggest the influence of local emissions and boundary-layer dynamics, while relatively low CO2 values at ICESP (422.10 ppm in summer and 428.03 ppm in winter) likely reflect the elevated measurement height (~100 m a.g.l.), which favors regional-scale mixing and reduces sensitivity to local emission sources. NDVI revealed a bimodal phenological cycle (April–May and October–November), which was mirrored by CO2 variability at PJ. Among 132 fitted PDFs, the Normal Inverse Gaussian distribution best captured CO₂ variability, with greener sites showing flatter and more symmetric distributions and urban sites showing increased skewness and peakedness. Regression results indicate a significant vegetation signal: a 0.1 increase in NDVI was associated with CO2 reductions of ~3.92 ppm (PJ), 2.81 ppm (IAG), and 7.66 ppm (ICESP; likely conditional on site features), while no significant effect was detected at UNICID. Overall, urban vegetation influences both mean CO2 levels and their distributional characteristics, supporting the role of green infrastructure and phenology in urban carbon management.

Keywords: carbon dioxide, vegetation cover, linear regression, Metropolitan Area of São Paulo.

How to cite: Piscoya, J., Franco, M. A., and Andrade, M. D. F.: Influence of Vegetation Cover on Atmospheric CO2 Mixing Ratios in the São Paulo Metropolitan Area, EGU General Assembly 2026, Vienna, Austria, 3–8 May 2026, EGU26-13522, https://doi.org/10.5194/egusphere-egu26-13522, 2026.

EGU26-13698 | Posters virtual | VPS3

Inferring aerosol optical depth at unmeasured wavelengths from ground-based spectral photometer data: uncertainty-consistent regression, sensitivity tests, and application to real data 

Benjamin Torres, Oleg Dubovik, Carlos Toledano, David Fuertes, Masahiro Momoi, Stelios Kazadzis, Thierry Marbach, Elena Lind, Roberto Roman, Manuel Veloso Varela, and Africa Barreto

Aerosol optical depth (τ) is routinely reported at wavelengths that are not directly measured by ground-based sun photometers, in particular at 550 nm for satellite validation and at longer wavelengths for short-wave infrared applications. These values are typically obtained by spectral interpolation or extrapolation, most often using linear or quadratic regressions in logarithmic space. However, the uncertainty structure of such regressions is frequently treated incorrectly, because measurement uncertainties in τ are absolute and approximately wavelength-independent in linear space, and therefore become wavelength-dependent in logarithmic space. As a result, the measurement covariance matrix must be explicitly accounted for in log–log regression, although this is rarely done in practice. This study provides both a formal and a practical framework for estimating τ at non-measured wavelengths together with its associated uncertainty. A rigorous formulation is presented for linear and quadratic regression in logarithmic space, including the propagation of random and systematic (bias-related) errors from the original spectral measurements to the interpolated or extrapolated wavelength.

Sensitivity analyses based on synthetic aerosol optical depth spectra generated with the GRASP forward model are used to compare six different approaches for deriving τ(550) and τ(2000), including linear and quadratic regressions over different spectral ranges as well as the GRASP-AOD method. When the covariance matrix is treated correctly, quadratic log–log regression is found to be the most robust method for estimating τ(550), and its results become essentially independent of the chosen spectral range. In contrast, when the covariance matrix is neglected, the same regression becomes highly sensitive to the selected wavelengths, and artificially improved performance is obtained when restricting the fit to the central AERONET channels. These findings are confirmed using real AERONET observations. When the full covariance treatment is applied, differences between estimates obtained using different spectral ranges remain below 0.002 at all sites analysed. When it is ignored, root-mean-square differences exceeding 0.01 are observed at sites dominated by fine-mode aerosols.

Finally, the uncertainty propagation framework is applied to real data and shows that the uncertainty of interpolated τ follows the expected Beer–Lambert law governing sun-photometer measurements, scaling with optical air mass. This provides an independent validation of the formal error model. Overall, this work establishes a consistent methodology for spectral interpolation and extrapolation of τ, ensuring both accurate values and physically meaningful uncertainties for satellite validation and related applications.

How to cite: Torres, B., Dubovik, O., Toledano, C., Fuertes, D., Momoi, M., Kazadzis, S., Marbach, T., Lind, E., Roman, R., Veloso Varela, M., and Barreto, A.: Inferring aerosol optical depth at unmeasured wavelengths from ground-based spectral photometer data: uncertainty-consistent regression, sensitivity tests, and application to real data, EGU General Assembly 2026, Vienna, Austria, 3–8 May 2026, EGU26-13698, https://doi.org/10.5194/egusphere-egu26-13698, 2026.

EGU26-14127 | Posters virtual | VPS3

From Detection to Mitigation: The California Satellite Methane Project 

Daniel Phillips, Emily Yang, Jason Schroeder, Stephen Zelinka, Isis Frausto-Vicencio, Dorothy Fibiger, and Jorn Herner

Past aerial hyperspectral mapping campaigns and pilot studies have demonstrated that highly concentrated plumes are a significant portion of California’s total methane emissions, including many unintentional leaks that can be fixed quickly when operators are notified. Satellite plume imagers such as Planet’s Tanager offer the capacity for repeated observations of known methane infrastructure, with enough spatial resolution and sensitivity to address a significant fraction of these leaks by identifying source facilities and contacting operators. Here we present system design and first results from the California Satellite Methane Project (CalSMP), a comprehensive multi-sector effort to notify individual operators of plumes within days of detection and ensure prompt mitigation when possible through a mix of direct regulation and voluntary dialogue with operators.

In May 2025, CARB began retrieving low-latency Tanager plume detections purchased from Carbon Mapper. Using a cloud-based system developed in-house, CARB employees oversee a semi-automated process to assign plumes to a source and facilitate information exchange with operators. The system generates a notification email with instructions and response forms tailored to the specific facility type (e.g. landfill, oil and gas, dairy biogas). These responses allow us to categorize emissions across sectors by emission type (e.g. unintentional, temporary, process) as well as identify sector-specific components or infrastructure (landfill gas collection system, gas well stuffing box) and details of any repairs.

CARB plans to expand its spatiotemporal coverage through additional satellites, with increased automation as we scale up. While the project’s initial focus is direct repair of unintentional leaks, operator responses also effectively survey underlying causes of point-source emissions and can inform future efforts to improve industry operational practices. CARB has dedicated community outreach funds to ensure methane observations are accessible, understandable, and useful to communities, and is committed to sharing technical details, project design, and lessons learned with other jurisdictions to maximize global mitigation efforts.

How to cite: Phillips, D., Yang, E., Schroeder, J., Zelinka, S., Frausto-Vicencio, I., Fibiger, D., and Herner, J.: From Detection to Mitigation: The California Satellite Methane Project, EGU General Assembly 2026, Vienna, Austria, 3–8 May 2026, EGU26-14127, https://doi.org/10.5194/egusphere-egu26-14127, 2026.

EGU26-14645 | ECS | Posters virtual | VPS3

Climate Response to Tambora-Scale Volcanic Eruptions Under Present and Future Climate Conditions 

Margarita Tkachenko and Rozanov Eugene

We quantify climate effects of Tambora-scale eruptions under current and future warming using the SOCOL-MPIOM coupled atmosphere-chemistry-ocean model for 2020, SSP2-4.5, and SSP3-7.0 (2080) scenarios.

Global cooling amplifies counterintuitively with background warming: SSP3-7.0 shows 44% stronger cooling than present-day due to polar vortex intensification increasing from 5.5% to 44.5%. Regional responses reveal complex patterns: winter exhibits Arctic warming (+0.4-0.6°C) simultaneous with tropical cooling (up to -8°C) and continental extremes (up to +15°C). Summer brings widespread continental cooling (-2 to -4°C). Monsoon systems weaken by 20-35% while mid-latitude winter precipitation intensifies by 20-40%.

Results demonstrate that volcanic impacts under anthropogenic warming generate spatially heterogeneous extremes rather than uniform cooling, critical for agricultural and water resource risk assessment.

How to cite: Tkachenko, M. and Eugene, R.: Climate Response to Tambora-Scale Volcanic Eruptions Under Present and Future Climate Conditions, EGU General Assembly 2026, Vienna, Austria, 3–8 May 2026, EGU26-14645, https://doi.org/10.5194/egusphere-egu26-14645, 2026.

EGU26-15531 | ECS | Posters virtual | VPS3

Cloud Detection over Snow- or Ice-covered Surfaces Using Oxygen A-Band Observations 

Huangchuan Liu and Siwei Li

Cloud detection over snow- or ice-covered (S/IC) surfaces remains a critical challenge in satellite remote sensing. The cloud-like high surface albedo and ice-cloud-like brightness temperatures of these surfaces often lead to systematic misclassification in visible- and infrared-based algorithms, including the threshold-based cloud detection applied to Sentinel-5P atmospheric composition retrievals. Misclassified clear-sky scenes can introduce biases in the retrieved total columns of ozone, sulfur dioxide, and nitrogen dioxide, while misclassified cloudy scenes reduce the spatial coverage of satellite products.

To address this challenge, we develop a global cloud detection algorithm based on absorption images derived from Sentinel-5P oxygen A-band observations. The algorithm exploits the reduction of oxygen absorption in cloudy pixels, as cloud layers reflect solar radiation before it reaches the underlying surface, thereby shortening the radiative transfer path in the atmosphere and reducing absorption along the path. In addition, spatial texture information extracted from oxygen absorption images is incorporated to enhance sensitivity to optically thin and broken clouds, enabling more robust discrimination between clouds and bright underlying surfaces. This physical mechanism makes the algorithm insensitive to surface type, rendering it particularly suitable for global cloud detection, including over S/IC surfaces.

Validation against CALIPSO demonstrates a marked improvement in cloud detection performance across diverse surface and cloud conditions. The proposed algorithm achieves an overall accuracy of 91%, compared with 85% for the Suomi-NPP product and 48% for the operational Sentinel-5P product. Improvements are particularly pronounced over S/IC surfaces, where detection accuracy increases by 15% relative to Suomi-NPP. Additionally, detection accuracy for optically thin clouds improves by 20% globally, with the largest gains (up to 52%) observed over S/IC surfaces. These results demonstrate the value of oxygen absorption and spatial texture features for cloud detection, especially over S/IC surfaces, and support improved quality and consistency of satellite-based atmospheric observations over polar and other bright-surface regions.

How to cite: Liu, H. and Li, S.: Cloud Detection over Snow- or Ice-covered Surfaces Using Oxygen A-Band Observations, EGU General Assembly 2026, Vienna, Austria, 3–8 May 2026, EGU26-15531, https://doi.org/10.5194/egusphere-egu26-15531, 2026.

EGU26-15593 | ECS | Posters virtual | VPS3

Horizontal grid and meteorology resolution impacts on aviation’s air quality impacts 

Luccas Kavabata, Flávio Quadros, Vincent Meijer, Mirjam Snellen, and Irene Dedoussi

Simulations of aviation's air quality impacts near airports are critical for enhancing our understanding of how aviation impacts air quality regionally, and the potential effects of sustainable alternatives. In order to better understand such impacts, a research to investigate the effects of the resolution of the simulation grid and of the meteorology inputs on the air quality impact estimates due to aircraft emissions, specifically in the context of stretched gnomonic cubed-sphere grids for the simulation of a specific area was conducted. Such grids allow for the possibility of having a region with finer grid elements while coarsening the grid outside a specified area.

The research questions that the present research effort aims to address are: which parameter (grid resolution or meteorology resolution) impacts most the simulations, how grid and meteorology resolution impact air quality estimates, and whether stretched grids can be used for regional simulations.

To address the matter, we use the distributed-memory, high-performance version of the GEOS-Chem atmospheric chemistry-transport model to simulate the evolution of aviation attributable to Landing and Take-Off operations (LTO) emissions throughout the year of 2019. The LTO emissions were obtained from the OpenAVEM emissions inventory, whereas the remaining non-aviation emissions were taken from the default GCHP databases.

Three different grid resolutions were chosen to evaluate the impact of the horizontal grid resolution: C24, C36, and C48, with grid cell lengths ranging between 40 km, 30 km, and 20 km, respectively. All grids use the same stretch parameters, i.e., target latitude, target longitude, and stretch factor. These parameters were set so as to have a finer resolution around Europe. For the meteorology sensitivity, two resolutions were used, 2 ° ×2.25 ° and 0.5 ° ×0.625 ° from MERRA2 for the three grid resolutions aforementioned.

A comparison between the area weighted concentrations for NO2, PM2.5, and O3 showed that the resolution of the meteorology plays a more important role than the horizontal grid resolutions, for the resolutions tested. For the human health impacts, the deaths attributable to each component have also been estimated and compared for each grid resolution.

How to cite: Kavabata, L., Quadros, F., Meijer, V., Snellen, M., and Dedoussi, I.: Horizontal grid and meteorology resolution impacts on aviation’s air quality impacts, EGU General Assembly 2026, Vienna, Austria, 3–8 May 2026, EGU26-15593, https://doi.org/10.5194/egusphere-egu26-15593, 2026.

EGU26-17672 | ECS | Posters virtual | VPS3

Numerical modeling of tropospheric chemistry in an Earth System Model 

Arina Okulicheva, Margarita Tkachenko, and Sergey Smyshlyaev

Abstract. This work presents the incorporation of a tropospheric isoprene oxidation scheme into an Earth System Model to enhance the simulation of tropospheric ozone levels. Numerical experiments were performed using two distinct model setups: one accounting for isoprene oxidation and another in which this chemical pathway was not considered.

Keywords: Isoprene, tropospheric ozone, atmospheric chemistry, MIM1 mechanism

Understanding the processes of tropospheric ozone formation is of key importance both for the development of air quality control measures and for climate prediction, especially under conditions of changing anthropogenic and biogenic emissions. While on the global scale the production of tropospheric ozone is primarily governed by the oxidation of carbon monoxide and methane, in densely populated and industrial regions non-methane volatile organic compounds (NMVOCs) become the dominant contributors. Among these NMVOCs, isoprene plays a particularly important role, with the majority of its atmospheric emissions originating from vegetation.

The aim of this study is to further develop the INM RAS–RSHU chemical–climate model [1], which is a component of the Earth System Model (ESM), with an emphasis on a more accurate representation of tropospheric chemical processes. The primary focus is on the implementation of an improved chemical mechanism designed to enhance the accuracy of simulated concentrations of key atmospheric gaseous components. One of the main criteria in selecting the mechanism is achieving an optimal balance between the level of chemical detail and the computational efficiency of the model.

As part of the model development, a comparative analysis of several widely used chemical mechanisms was performed, including the Mainz Isoprene Mechanism (MIM1) [2], comprising 16 species and 44 reactions; MIM2, with 69 species and 178 reactions [3]; the Model for Ozone and Related Chemical Tracers (MOZART), including 151 species and 287 reactions [4]; and the Regional Atmospheric Chemistry Mechanism (RACM), which includes more than 100 species and 363 reactions [5]. Based on the results of this analysis, the MIM1 mechanism was considered the most appropriate for initial implementation in the ESM, as it was decided to begin with the most compact option while still providing sufficient accuracy in representing key tropospheric chemical processes.

To assess the impact of the MIM1 mechanism, two numerical experiments were conducted using identical model settings and boundary conditions. In the control simulation, a basic tropospheric chemistry scheme without isoprene was applied, whereas the MIM1 experiment implemented the full isoprene oxidation mechanism, including 44 chemical reactions.

 The study and the set of numerical experiments are aimed at optimizing the chemical component of the INM RAS–RSHU chemical–climate model in order to improve the accuracy of representing tropospheric processes while maintaining high computational efficiency. The obtained results provide a solid basis for further investigation of the interactions between chemical and dynamical processes in the atmosphere and will contribute to the development of approaches for forecasting atmospheric composition and its impact on regional and global climate change.

How to cite: Okulicheva, A., Tkachenko, M., and Smyshlyaev, S.: Numerical modeling of tropospheric chemistry in an Earth System Model, EGU General Assembly 2026, Vienna, Austria, 3–8 May 2026, EGU26-17672, https://doi.org/10.5194/egusphere-egu26-17672, 2026.

EGU26-19003 | ECS | Posters virtual | VPS3

Modelling the transport of ablated space debris particles in the atmosphere 

Saskia Hawkins, Jo Egan, John Plane, Daniel Marsh, and Wuhu Feng

The influx of anthropogenic metals into the atmosphere is expected to increase substantially due to the rapid growth of the space industry. More than 20 elements from re-entering spacecraft have been identified in sulphuric acid droplets in the Junge layer, with several estimated to surpass the background level from cosmic dust. While the atmospheric impact of these particles is uncertain, they have been widely hypothesised, including ozone destruction, increased polar stratospheric cloud formation, harmful surface deposition, a perturbed radiative balance and in turn, changes to global circulation.

The spacecraft ablation process and subsequent formation of space debris particles (SDPs) are not well defined. The dominant constituent of spacecraft is aluminium. If vaporised, aluminium is expected to undergo a series of reactions to form aluminium hydroxide (Al(OH)3). The initial form and size of the particles will strongly influence the coagulation, global transport, and atmospheric lifetime of the particles. Constraining these factors is vital to accurately assessing the impact SDPs have on the atmosphere.

This work provides an update on the work presented at EGU2025 (Egan et al., Modelling impacts of ablated space debris on atmospheric aerosols, EGU25-4460), using the Whole Atmosphere Community Climate Model with the Community Aerosol and Radiation Model for Atmospheres (WACCM-CARMA) to simulate the production and transport of SDPs. This work investigates the sensitivity of the initial particle radius to the transport, lifetime and surface deposition of particles.

How to cite: Hawkins, S., Egan, J., Plane, J., Marsh, D., and Feng, W.: Modelling the transport of ablated space debris particles in the atmosphere, EGU General Assembly 2026, Vienna, Austria, 3–8 May 2026, EGU26-19003, https://doi.org/10.5194/egusphere-egu26-19003, 2026.

Solid fuels such as fuelwood (FW), coal balls (CB), dung cake (DC), and agricultural residue (AR) are widely used for domestic heating and cooking in developing countries, particularly in rural and peri-urban regions. Combustion of these fuels is a major source of carbon-based gaseous emissions, notably carbon monoxide (CO) and carbon dioxide (CO2), contributing to indoor air pollution, adverse health effects, and climate change. The emission characteristics of these gases are strongly influenced by fuel moisture content, elemental composition, and inorganic constituents. This study presents the development of emission factors (EFs) for CO and CO2 from commonly used solid fuels and evaluates materials-based mitigation strategies using a laboratory-designed fixed-bed reactor system with a combustion chamber simulating real-world burning conditions.

Fuel samples were collected from representative domestic sources, air-dried, pulverized, and homogenized prior to analysis. Moisture content was determined gravimetrically by oven drying at 105 °C. Ultimate analysis of carbon (C), hydrogen (H), nitrogen (N), sulfur (S), and oxygen (O) was performed using a CHNS/O elemental analyzer, while anionic and cationic species were quantified using ion chromatography. Combustion experiments for emission factor development were conducted in a custom-designed fixed-bed reactor equipped with a controlled burning chamber to simulate domestic heating conditions. The reactor enabled stable combustion, controlled airflow, and downstream integration of mitigation materials for post-combustion treatment of exhaust gases. It also includes real-gas cylinders to generate the gas mixture representing smoke.

The results revealed notable variability in fuel composition and emission behavior. FW exhibited relatively efficient combustion with lower CO emissions, while DC, with higher moisture and lower carbon content, produced higher CO levels. CB showed high CO emissions despite its carbon content, whereas AR displayed intermediate emission characteristics. Elevated levels of alkali metals and anions, particularly in DC, were associated with reduced combustion efficiency and increased CO formation.

The hazards of these gases demands for removal. In this study, removal experiments were carried out by integrating advanced functional materials into the exhaust section of the fixed-bed reactor. Porous and nanostructured materials such as graphene-based materials, biochar, graphitic carbon nitride (g-C3N4), zeolites, metal–organic frameworks (MOFs), covalent organic frameworks (COFs), and silica-based materials were evaluated for CO oxidation and CO2 capture. Material characterization using Brunauer–Emmett–Teller (BET) surface area analysis, scanning electron microscopy (SEM), Fourier transform infrared spectroscopy (FTIR), and X-ray diffraction (XRD) confirmed high specific surface area, well-developed porous structures, and the presence of reactive surface functional groups, which directly enhance adsorption and catalytic conversion of carbonaceous gases.

Overall, the study demonstrates that fuel chemical composition and combustion conditions strongly influence CO and CO2 emission factors from domestic heating activities. The integration of a designed fixed-bed reactor with a burning chamber and advanced materials-based mitigation strategies provides a robust experimental framework for reducing carbon-based emissions and improving air quality in regions dependent on traditional solid fuels.


How to cite: Sahu, D. and Pervez, S.: Emission of Carbon Monoxide (CO) and Carbon Dioxide (CO2) from Household Solid Fuels Burning Practices: Development of Real World Emission Factor and Removal Methods, EGU General Assembly 2026, Vienna, Austria, 3–8 May 2026, EGU26-20738, https://doi.org/10.5194/egusphere-egu26-20738, 2026.

Field-based observations of Carbon dioxide (CO₂) exchange between soils and atmosphere are critical to accurately account for terrestrial carbon cycling in data-scarce West African savanna ecosystems. This study quantified soil CO₂ fluxes over two consecutive years (2023–2024) using a static chamber approach across four contrasting land-use systems namely forest, grassland, cropland, and rice fields. Measurements were conducted on weekly basis using replicated chambers to assess both spatial heterogeneity and interannual variability. Soil CO₂ fluxes were analysed in relation to key environmental drivers, including water-filled pore space (WFPS) and soil temperature, using mixed-effects statistical models to account for repeated chamber measurements. Across all land uses, CO₂ emissions increased markedly in 2024 compared to 2023. Median seasonal CO₂ fluxes ranged from 0.59 to 1.46 t C ha⁻¹ season⁻¹ in forest systems, 1.91 to 5.07 t C ha⁻¹ season⁻¹ in grasslands, 1.75 to 5.09 t C ha⁻¹ season⁻¹ in croplands, and 1.84 to 2.61 t C ha⁻¹ season⁻¹ in rice fields. Grasslands and croplands consistently exhibited the highest CO₂ emissions, with maximum values reaching 7.18 and 5.38 t C ha⁻¹ season⁻¹, respectively, highlighting the strong influence of land management and disturbance intensity. Forest soils showed comparatively lower CO₂ fluxes, reflecting reduced soil disturbance and more stable microclimatic conditions. Statistical analyses revealed that soil temperature was a dominant driver of CO₂ emissions across all ecosystems, while soil moisture exerted a secondary but significant control, particularly in managed systems. Higher WFPS and elevated soil temperatures during the wet season were associated with enhanced CO₂ release, indicating intensified microbial respiration and root activity. Interannual contrasts suggest that wetter and warmer conditions in 2024 amplified soil respiration across all land uses. Overall, our results demonstrate pronounced spatial and temporal variability in soil CO₂ fluxes in the Sudanian savanna and underscore the sensitivity of carbon emissions to land-use change and hydro-climatic variability. These findings provide critical baseline data for improving regional carbon budgets and for informing mitigation strategies in data-scarce tropical savanna regions.

How to cite: Oussou, F. E. and the WASCAL CONCERT Team: Assessing Spatial and temporal heterogeneity of Soil Carbon emissions across anthropized land use Gradient in the Sudanian savanna, EGU General Assembly 2026, Vienna, Austria, 3–8 May 2026, EGU26-21511, https://doi.org/10.5194/egusphere-egu26-21511, 2026.

EGU26-21709 | ECS | Posters virtual | VPS3

Greenhouse gas emissions and socio-environmental costs of anthropogenic fires in Tucumán (Argentina): A remote sensing and environmental economics approach 

Facundo Reynoso Posse, Juan Pablo Zbrun Luoni, and Mariela Aguilera Sammaritano

Anthropogenic fires linked to the burning of agricultural biomass residues represent a recurring environmental disturbance in the province of Tucumán, northwest Argentina. These events are predominantly associated with land clearing and post-harvest burning in sugarcane fields concentrated in the region’s lowland plains, where agro-industrial activity is most intense. Such practices contribute significantly to greenhouse gas (GHG) emissions, vegetation degradation, and a range of socio-economic impacts. This study integrates satellite-derived fire indices with environmental economic tools to quantify the spatial and temporal effects of fire over the past five years (2021–2025) and assess their implications for climate change mitigation and policy.

Multispectral data from Sentinel‑2 and atmospheric composition products from Sentinel‑5P were processed via Google Earth Engine to calculate vegetation and fire severity indices including NDVI, dNBR, and BAI. Additionally, tropospheric CO and CO₂ concentrations were used to evaluate atmospheric impacts. The spatial distribution of fire activity—primarily in the eastern and southern lowlands—was cross-referenced with the Global Fire Emissions Database (GFED) and IPCC Tier 1 emission factors to estimate fire-related GHG emissions. Preliminary analyses indicate an average of 45,000 ha affected annually, mainly in sugarcane-dominated landscapes, resulting in estimated emissions of approximately 382,500 t CO₂-equivalent per year.

To evaluate broader socio-environmental impacts, economic losses were estimated across multiple dimensions: reduced land productivity, costs of ecosystem restoration, loss of ecosystem services (e.g. carbon sequestration, water retention), and public health expenses related to degraded air quality. Additional indirect impacts include traffic accidents due to smoke-induced low visibility and recurring property damage reported in local media. These preliminary estimates suggest combined annual damages of approximately USD 46.5 million, underscoring the considerable burden imposed by current fire management practices.

It is important to note that this work presents ongoing research, and all results are preliminary. The estimates provided will be further refined through continued integration of field data, emission modeling, and economic valuation methods.

This integrative approach demonstrates the value of combining Earth observation technologies with environmental economics to support climate-oriented decision-making. By quantifying the environmental and economic impacts of anthropogenic fires, this study provides critical evidence for the development of cross-sectoral policies aimed at regulating biomass burning, improving land management practices, and strengthening resilience to climate risks. The case of Tucumán underscores the urgent need for sustainable alternatives to current residue management practices and for aligning agricultural production with mitigation goals.

How to cite: Reynoso Posse, F., Zbrun Luoni, J. P., and Aguilera Sammaritano, M.: Greenhouse gas emissions and socio-environmental costs of anthropogenic fires in Tucumán (Argentina): A remote sensing and environmental economics approach, EGU General Assembly 2026, Vienna, Austria, 3–8 May 2026, EGU26-21709, https://doi.org/10.5194/egusphere-egu26-21709, 2026.

EGU26-21713 | ECS | Posters virtual | VPS3

Evaluation of new polarimetric products 

Kalliopi Artemis Voudouri, Alexandra Tsekeri, Andreas Karipis, Pavel Litvinov, Anton Lopatin, Oleg Dubovik, Otto Hasekamp, and Vassilis Amiridis

The new satellite missions including active sensors (e.g. EarthCare), passive multi-angular polarimeters (e.g. PACE/SPEXone, PACE/HARP-2) and single-viewing instruments (e.g. OLCI), together with synergies among existing sensors, are foreseen to characterize aerosols and clouds with high accuracy. However, robust validation activities are essential to ensure the quality of the new satellite products.

In this study, we focus on the evaluation of the aerosol optical properties synergistically retrieved from three sensors, i.e., TROPOMI, OLCI-A, and OLCI-B, within the framework of the AIRSENSE ESA project (https://www.grasp-earth.com/portfolio/airsense/). The derived optical properties include the aerosol optical depth (AOD), Ångström exponent (AE), coarse- and fine-mode AOD, and single-scattering albedo (SSA). Validation is performed against ground-based sun-photometer observations from five ACTRIS/AERONET stations across Europe (https://aeronet.gsfc.nasa.gov/). The results show good agreement for AOD with root-mean-square errors (RMSE) ranging from 0.006 to 0.09. In contrast, AE and SSA show lower agreement, with RMSE values of 0.27 and 0.02, respectively, at the Limassol station, even when quality flags are applied.

Moreover, we evaluate the aerosol properties retrieved using PACE/SPEXone observations. PACE (Plankton, Aerosol, Cloud, and ocean Ecosystem) mission was launched in February 2024 and employs advanced passive polarimetric observations to enhance the aerosol characterization. In addition to aerosol optical properties (e.g., AOD, AE) the PACE/SPEXone products generated within the framework of AIRSENSE, include the aerosol layer height (ALH), a parameter that is critical for quantifying aerosol-cloud interactions. Since EarthCARE/ATLID provides vertically resolved aerosol profiles, it offers an independent reference for the assessment of ALH. Here, we present first comparison results of the PACE/SPEXone ALH product over the ocean, produced with two algorithms, RemoTAP and FastMAPOL, compared to EarthCARE/ATLID weighted backscatter heights. Overall, RemoTAP ALH products are systematically lower than those derived from EarthCARE/ATLID, whereas FastMAPOL retrieves a larger number of ALH estimates but exhibits lower overall agreement with the EarthCARE/ATLID reference. As a next step, we intend to expand the area of interest and increase the number of collocations.


Acknowledgements:

This research is financially supported by the PANGEA4CalVal project (Grant Agreement 101079201) funded by the European Union  and the AIRSENSE (Aerosol and aerosol cloud Interaction from Remote SENSing Enhancement) project, funded by the European Space Agency under Contract No. 4000142902/23/I-NS.

How to cite: Voudouri, K. A., Tsekeri, A., Karipis, A., Litvinov, P., Lopatin, A., Dubovik, O., Hasekamp, O., and Amiridis, V.: Evaluation of new polarimetric products, EGU General Assembly 2026, Vienna, Austria, 3–8 May 2026, EGU26-21713, https://doi.org/10.5194/egusphere-egu26-21713, 2026.

EGU26-21851 | ECS | Posters virtual | VPS3

Cloud typing and microphysics: An EarthCARE-Cloudnet Comparison 

Ioanna Tsikoudi, Eleni Marinou, Lukas Pfeitzenmaier, Shannon Mashon, Ewan O'Connor, Dimitra Karkani, Andreas Karipis, Kalliopi Artemis Voudouri, Pavlos Kollias, Bernat Puigdomenech Treserras, and Alessandro Battaglia

This work evaluates EarthCARE cloud products against ground-based Cloudnet retrievals at multiple sites in Europe. We focus on the comparison between the EarthCARE synergetic target classification product (AC-TC), with the Cloudnet target classification product, both derived from the synergy of lidar/radar measurements. As the two classifications have different aerosol/cloud types, a new common classification with the following classes is defined and used for direct comparison: Unknown, Clear, Liquid (Droplets T>0°C), Supercooled Liquid (Droplets T<0°C), Drizzle or rain, Drizzle & droplets, Ice, Ice & droplets, Melting ice possibly coexisting with droplets, Insects, Aerosol. Each AC-TC or Cloudnet target is assigned with a new class. Spatiotemporal collocation criteria are considered, along with visual inspection of the collocated scenes, to limit the dataset in homogenous scenes where the satellite and suborbital platform has detected similar clouds. Additionally, retrieved ice and liquid water cloud contents from Cloudnet and EarthCARE are compared to evaluate cloud microphysical properties. Τhe geographical diversity of the Cloudnet network, provides the advantage of investigating different atmospheric conditions in terms of clouds and aerosols, with abundant ice cloud occurrences in the northern sites and frequent liquid water clouds at the southern sites. This analysis aims to assess the consistency of cloud categorization and microphysical retrievals between the satellite and suborbital measurements, and to investigate the strengths and limitations of both approaches.

How to cite: Tsikoudi, I., Marinou, E., Pfeitzenmaier, L., Mashon, S., O'Connor, E., Karkani, D., Karipis, A., Voudouri, K. A., Kollias, P., Treserras, B. P., and Battaglia, A.: Cloud typing and microphysics: An EarthCARE-Cloudnet Comparison, EGU General Assembly 2026, Vienna, Austria, 3–8 May 2026, EGU26-21851, https://doi.org/10.5194/egusphere-egu26-21851, 2026.

EGU26-23052 | ECS | Posters virtual | VPS3

CALIPSO validation of an apparent MODIS AOD spike over the Central Himalayas (2011) 

Abidina Bello, Anshuman Bhardwaj, and Lydia Sam

Remote sensing of aerosol variability over the Central Himalayas remains challenging because of complex terrain, strong elevation gradients in surface reflectance, and frequent cloud and snow contamination, which can bias passive aerosol optical depth (AOD) retrievals. In this study, we examine an apparent MODIS-derived AOD enhancement in 2011 over the Central Himalayas that deviates from the expected seasonal pattern of reduced aerosol loading during the monsoon and post-monsoon periods. The central objective is to determine whether this apparent anomaly represents a physically meaningful aerosol enhancement or is influenced by retrieval limitations in high-relief environments. We evaluate the MODIS anomaly using collocated CALIPSO observations, including vertically resolved aerosol extinction profiles and aerosol-layer optical depths. CALIPSO measurements show no evidence of persistently elevated aerosol layers corresponding to the MODIS enhancement, and aerosol extinction remains vertically shallow, indicating that the observed AOD anomaly is not associated with strong free-tropospheric aerosol intrusion. These results suggest that the apparent MODIS “spike” likely reflects a column-integrated enhancement dominated by near-surface aerosol and/or terrain–cloud–snow-related retrieval effects rather than a sustained elevated aerosol event. This study highlights the importance of integrating active lidar profiling with passive satellite retrievals to improve the interpretation of aerosol anomalies over mountainous regions and strengthens the basis for aerosol–cloud interaction assessments in the Himalayas.

How to cite: Bello, A., Bhardwaj, A., and Sam, L.: CALIPSO validation of an apparent MODIS AOD spike over the Central Himalayas (2011), EGU General Assembly 2026, Vienna, Austria, 3–8 May 2026, EGU26-23052, https://doi.org/10.5194/egusphere-egu26-23052, 2026.

EGU26-23274 | Posters virtual | VPS3

First two years of TEMPO nitrogen dioxide and formaldehyde observations:algorithm status and highlights 

Gonzalo Gonzalez Abad, Caroline R. Nowlan, Kelly Chance, Xiong Liu, Heesung Chong, Zachary Fasnacht, David E. Flittner, Masoud Ghahremanloo, Barron Henderson, Weizhen Hou, John Houck, Laura Judd, K. Emma Knowland, Viral Shah, Pamela Wales, Wenhan Qin, Lukas Valin, and Huiqun Wang

Tropospheric Emissions: Monitoring of Pollution (TEMPO) is observing air quality and
atmospheric composition over North America from a geostationary orbit since its operations
started in August 2023. TEMPO observes the continent every 40 to 60 minutes at a spatial
resolution on the order of ~ 2 x 4.5 km 2 . Together with the Geostationary Environment
Monitoring Spectrometer (GEMS, launch 2020) monitoring Asia and the Sentinel-4/UVN
(launch 2025) monitoring Europe, TEMPO is part of the current global constellation of
geostationary sensors devoted to the observation of air quality. Like GEMS and Sentinel-4/UVN,
TEMPO uses backscattered ultraviolet and visible solar radiation to retrieve atmospheric
amounts of key trace gases and aerosols associated with air quality and atmospheric chemistry.
Among the species retrieved from TEMPO observations of nitrogen dioxide and formaldehyde
are important to understand emissions and atmospheric chemistry, including the formation and
destruction of tropospheric ozone.

After multiple version updates over the first two years of the mission, the TEMPO Level 2 NO 2
and HCHO products have undergone significant enhancements to improve the performance and
accuracy of the slant column retrievals, air mass factor calculations and post-processing
corrections including destriping for NO 2 and background for HCHO. We illustrate the
performance of both retrievals (version 3 & 4), evaluating their fitting uncertainty and showing

comparisons with independent correlative measurements and other satellite products showcasing
small noise levels and remarkable accuracy with well quantified biases. We continue by
illustrating the capacity of TEMPO products focusing on different case studies showing
TEMPO’s high temporal and spatial resolution. We finalize discussing aspects of the retrieval
subject to improvement and our plans to address them.

How to cite: Gonzalez Abad, G., Nowlan, C. R., Chance, K., Liu, X., Chong, H., Fasnacht, Z., Flittner, D. E., Ghahremanloo, M., Henderson, B., Hou, W., Houck, J., Judd, L., Knowland, K. E., Shah, V., Wales, P., Qin, W., Valin, L., and Wang, H.: First two years of TEMPO nitrogen dioxide and formaldehyde observations:algorithm status and highlights, EGU General Assembly 2026, Vienna, Austria, 3–8 May 2026, EGU26-23274, https://doi.org/10.5194/egusphere-egu26-23274, 2026.

EGU26-23276 | ECS | Posters virtual | VPS3

The Status of the TEMPO Total-Ozone and Ozone-Profile Algorithm: V04 Updates and Comprehensive Evaluations 

Junsung Park, Xiong Liu, Juseon Bak, Heesung Chong, Kelly Chance, Weizhen Hou, John Houck, Gonzalo González Abad, Caroline R. Nowlan, Huiqun Wang, Kai Yang, Lawrence E. Flynn, David P. Haffner, David E. Flittner, K. Emma Knowland, Matthew Johnson, Mary Angelique G. Demetillo, Robert Spurr, Can Li, and Xiaoyi Zhao and the TEMPO Validation Team and NASA's GMAO Team

The Tropospheric Emissions: Monitoring of Pollution (TEMPO) mission is part of a global constellation of geostationary satellites, along with GEMS and Sentinel-4, dedicated to monitoring air quality across the Northern Hemisphere. TEMPO is the first geostationary satellite instrument to monitor air pollutants over North America on an hourly basis at nearly neighborhood-scale resolution, covering an area from Mexico City to the Canadian oil sands and from the Atlantic to the Pacific Ocean.TEMPO measures backscattered ultraviolet and visible radiation to observe several trace gases important to air quality, including ozone, nitrogen dioxide, and formaldehyde, with observations every 40–60 minutes and at a high spatial resolution of approximately 2 × 4.75 km². TEMPO was successfully launched in April 2023 and began nominal operations in October 2023. Since then, it has been continuously monitoring atmospheric pollutants across its observation domain.
This presentation summarizes the Version 4 (V04) updates and improvements to the TEMPO total-ozone (O3TOT) and ozone-profile (O3PROF) retrieval algorithms. This presentation also presents the evaluation of the upcoming V04 TEMPO O3TOT product through comparisons of total ozone columns (TOCs) with measurements from other satellite instruments (e.g., OMPS and TROPOMI) and ground-based instruments, including Pandora, Brewer, and Dobson spectrometers. The V04 TEMPO O3PROF algorithm, which is UV-only, is validated through comparisons of ozone profiles, tropospheric ozone, and 0–2 km ozone columns with those from the Tropospheric Ozone Lidar Network (TOLNet) and aircraft observations, as well as through validation with MLS, EPIC, TROPOMI, and OMI observations.

How to cite: Park, J., Liu, X., Bak, J., Chong, H., Chance, K., Hou, W., Houck, J., Abad, G. G., Nowlan, C. R., Wang, H., Yang, K., Flynn, L. E., Haffner, D. P., Flittner, D. E., Knowland, K. E., Johnson, M., Demetillo, M. A. G., Spurr, R., Li, C., and Zhao, X. and the TEMPO Validation Team and NASA's GMAO Team: The Status of the TEMPO Total-Ozone and Ozone-Profile Algorithm: V04 Updates and Comprehensive Evaluations, EGU General Assembly 2026, Vienna, Austria, 3–8 May 2026, EGU26-23276, https://doi.org/10.5194/egusphere-egu26-23276, 2026.

EGU26-130 | ECS | Posters virtual | VPS4

Field-Calibrated Low-Cost Sensor Networks for PM2.5 Monitoring in West African Urban Environments: Insights from Abidjan and Accra 

Julien Bahino, Michael Giordano, Matthias Beekmann, Subramanian Ramanchandran, and Véronique Yoboué

Low-cost air quality sensors (LCS) offer opportunities for expanding air monitoring networks in regions where reference-grade instrumentation is limited. Within the framework of the Improving Air Quality in West Africa (IAQWA) project, we deployed Real-time Affordable Multi-Pollutant sensors (RAMPs) in Abidjan (Côte d'Ivoire) and Accra (Ghana), to characterize fine particulate matter (PM2.5) in contrasting urban environments. Prior to field deployment, each RAMP underwent a co-location period with reference monitors, and city-specific multilinear calibration models were developed incorporating both RAMP-reported PM2.5 and relative humidity (RH). These calibration models were applied to correct the sensor data and improve measurement reliability under varying atmospheric conditions.

From February 2020 to June 2021, five (5) measurement sites in Abidjan and four (4) sites in Accra were monitored using a 15-second temporal resolution. These sites were selected to represent the dominant pollution sources in West Africa, particularly domestic fires and road traffic. The calibrated dataset enabled comparative analysis of diurnal, daily, and seasonal PM2.5 variability. Both cities exhibited pronounced morning PM2.5 peaks associated with traffic, while evening increases were more visible in residential areas, indicating contributions from domestic combustion. Seasonal contrasts were marked, with highest concentrations occurring during the long dry season (Harmattan), when long-range Saharan dust transport significantly enhanced particulate loading. During an intense dust episode in January 2021, calibrated RAMP data underestimated PM2.5 relative to reference measurements, highlighting a known limitation of optical LCS under high mineral dust conditions.

Annual mean PM₂.₅ concentrations ranged from 17 to 26 µg m-3 across sites, exceeding both the 2005 and 2021 WHO air quality guidelines. Variability within each city, especially between traffic-influenced and urban background locations, was greater than variability between the two cities. These findings demonstrate both the value of rigorously calibrated low-cost sensors for improving air quality knowledge in data-scarce urban regions, and the need for sensor performance considerations in environments influenced by episodic dust intrusions.

How to cite: Bahino, J., Giordano, M., Beekmann, M., Ramanchandran, S., and Yoboué, V.: Field-Calibrated Low-Cost Sensor Networks for PM2.5 Monitoring in West African Urban Environments: Insights from Abidjan and Accra, EGU General Assembly 2026, Vienna, Austria, 3–8 May 2026, EGU26-130, https://doi.org/10.5194/egusphere-egu26-130, 2026.

Harmful Algal Blooms (HABs) represent a growing threat to marine ecosystems, aquaculture, and public health in the Central Eastern Arabian Sea (CEAS). This study utilized 18S rRNA metabarcoding to characterize the absolute abundance and community composition of potentially toxigenic diatoms and dinoflagellates in the coastal waters of Goa. The analysis reveals a distinct and alarming prevalence of multiple genera associated with diverse toxin syndromes.

The dataset was dominated by a massive proliferation of the dinoflagellate Karenia (linked to Neurotoxic Shellfish Poisoning and ichthyotoxicity), which reached extreme abundances exceeding 51,000 reads per sample at the most impacted sites. Co-occurring with this bloom, spatially distinct hotspots of Paralytic Shellfish Toxin (PST) producers were identified, specifically Alexandrium and Gymnodinium spp., with Alexandrium counts peaking at over 5,200 reads. Notably, the potent PST producer Alexandrium tamiyavanichii was positively identified, alongside detections of Gymnodinium catenatum.

The diatom community also exhibited significant toxicity potential; the Amnesic Shellfish Poisoning (ASP) genus Pseudo-nitzschia displayed high relative abundance (up to ~3,700 reads), including the presence of P. pungens. Furthermore, vectors for Diarrhetic Shellfish Poisoning (DSP), including Dinophysis spp. and Phalacroma rotundatum, and Yessotoxin producers (Lingulodinium polyedra, Gonyaulax spinifera) were ubiquitously present at lower background levels.

These findings highlight a complex, multi-risk scenario where ASP, PSP, NSP, and DSP vectors coexist within the same coastal system. The distinct spatial separation observed between peak Karenia, Alexandrium, and Pseudo-nitzschia events suggests that heterogeneous environmental drivers are influencing specific HAB assemblages. This data underscores the critical need for broad-spectrum toxin monitoring beyond single-species surveillance in the region.

How to cite: Zedi, S. and Khandeparker, R.: Hidden Hazards in the Central Eastern Arabian Sea: Metabarcoding Reveals Co-occurrence of ASP, PSP, and NSP Vectors in the Coastal Waters of Goa, EGU General Assembly 2026, Vienna, Austria, 3–8 May 2026, EGU26-414, https://doi.org/10.5194/egusphere-egu26-414, 2026.

EGU26-2796 | ECS | Posters virtual | VPS4

Investigating the formation mechanisms of hydroxyl dicarboxylic acids based on machine learning 

Hongyong Li and Xiaopu Lyu

Secondary organic aerosol (SOA) has been shown to significantly impact climate, air quality, and human health. Hydroxyl dicarboxylic acids (OHDCA) are generally of secondary origin and ubiquitous in the atmosphere, with high concentrations in South China. This study explored the formation of representative OHDCA species based on time-resolved measurements and explainable machine learning. Malic acid, the most commonly studied OHDCA, had higher concentrations in the noncontinental air (63.7 ± 33.3 ng m–3) than in the continental air (7.5 ± 1.4 ng m–3). Machine learning quantitatively revealed the high relative importance of aromatics and monoterpenes SOA, as well as aqueous processes, in the noncontinental air, due to either shared precursors or similar formation pathways. Isoprene SOA, particle surface area, and ozone corrected for titration loss (Ox) also elevated the concentrations of malic acid in the continental air. Aqueous photochemical formation of malic acid was confirmed given the synergy between LWC, temperature, and Ox. Moreover, the OHDCA-like SOA might have facilitated a relatively rare particle growth from early afternoon to midnight in the case with the highest malic acid concentrations. This study enhances our understanding of the formation of OHDCA and its climate impacts.

How to cite: Li, H. and Lyu, X.: Investigating the formation mechanisms of hydroxyl dicarboxylic acids based on machine learning, EGU General Assembly 2026, Vienna, Austria, 3–8 May 2026, EGU26-2796, https://doi.org/10.5194/egusphere-egu26-2796, 2026.

EGU26-5792 | ECS | Posters virtual | VPS4

Sector-segregated anthropogenic impacts on PM2.5 over western India based on regional air quality modeling 

Shashank Shekhar, Shubham Dhaka, Aditya Vaishya, Narendra Ojha, Andrea Pozzer, and Amit Sharma

Air quality over western India is impacted by both regional emissions and transport from the Indo-Gangetic Plain (IGP). Effective mitigation requires identifying the dominant emission sectors that govern regional air quality during different seasons. In this regard, the present study examines the impact of emissions from major anthropogenic sectors (power, residential, transport and industries) on ambient fine particulate matter (PM2.5)concentrations over the western Indian region. For this, high-resolution (12km x 12km) regional model (WRF-Chem v3.9.1) simulations have been conducted using the EDGAR v5.0 inventory for anthropogenic emissions. Simulations are conducted for the year 2019, for winter and post-monsoon seasons when PM2.5 concentrations are typically elevated in this region, and anthropogenic emissions effects are the highest. During winter, the residential sector is seen to dominate, contributing 20% to PM2.5 concentration over western India, followed by power (9%) and industry (∼8%). The trans-regional pollution from the IGP and central India is also dominated by residential emissions (25%), followed by the power sector (∼8%). In contrast to winter, the dominant source during post-monsoon is the power sector (∼14%), followed by the industry (∼12%) and the residential (∼9%) sectors. Trans-regional impact also shows a similar pattern and dominance of power (∼15%) and industrial (∼10%) sectors. This seasonal shift in the dominant sector is driven by the seasonal variation in emissions. The results also reveal large spatial heterogeneity in sectoral influence, highlighting that dominant emission sources vary at the local scale within western India in both seasons. The study offers model-based insights for more effective planning of regional air pollution mitigation in western India.

How to cite: Shekhar, S., Dhaka, S., Vaishya, A., Ojha, N., Pozzer, A., and Sharma, A.: Sector-segregated anthropogenic impacts on PM2.5 over western India based on regional air quality modeling, EGU General Assembly 2026, Vienna, Austria, 3–8 May 2026, EGU26-5792, https://doi.org/10.5194/egusphere-egu26-5792, 2026.

EGU26-6264 | Posters virtual | VPS4

Estimating Size-Resolved Lung Deposition Doses of Particulate Matter (PM) Using Low-Cost Sensor Data in Rural India 

Karthiga Devi Sai Ganesan, Naveen Puttaswamy, Saritha Sendhil, Durairaj Natesan, Rengaraj Ramasami, Manish Desai, Ajay Pillarisetti, Sreekanth Vakacherla, Rashmi Krishnan, Sankar Sambandam, Padmavathi Ramaswamy, and Kalpana Balakrishnan

 Background and Objective

Exposures to fine and ultrafine particles (i.e., PM2.5 and PM1) are widely accepted as a major environmental risk factor and is known to cause adverse human health outcomes. Most epidemiological research as well as regulatory frameworks rely on using PM2.5 as the ‘reference’ exposure metric to assess health risks. However, this approach does not adequately quantify size-specific PM effects that are critical for dose-based health assessments. Size-segregated particulate matter assessment of exposures and effects are limited in resource-limited settings. The objective of this study is to estimate lung deposition doses for size-fractionated PM measured using low-cost sensors.

Methods

We utilized the data obtained from an ongoing study conducted in South Indian villages. Here, the household energy use is dominated by biomass combustion and the adoption of cleaner cooking fuels like liquefied petroleum gas (LPG) is relatively low. Ambient PM measurements were carried out continuously over a period of 1 year in 80 rural households in southern India, using real-time, optical, low-cost PM sensors. In order to capture the household-level exposure characteristics, indoor PM measurements were also carried out in a subset of households. Minute averaged, PM mass concentrations in three discrete size fractions: PM₁, PM₂.₅ and PM₁₀ were provided by the low-cost sensors.  The temporal variability in PM concentrations was derived using the time-series data obtained from the sensors. Daily and monthly mean concentrations captured the short-term exposure peaks as well as day to day variability.

Results  

A mathematical model using a non-linear least squares method was developed to transform the measured PM concentrations into a continuous size distribution. Respiratory deposition doses were estimated by feeding the size distribution to a computational model of the lung designed to simulate the spatial and temporal distribution of particles within the human respiratory system, incorporating various deposition models. The estimates of deposition doses ranged from ~0.2µg/min to ~1µg/min in the total lung. The coarse particles contributed to about 20% of the total lung dose, whereas the remaining 80% of the respiratory dose was predominantly of fine and ultrafine particles.

Conclusions

This study demonstrates that physiologically relevant, size-fractioned lung deposition doses can be estimated using limited size-bin data obtained from low-cost sensors. Since low-cost air quality monitoring networks are critical in regions that lack regulatory-grade instrumentation, the proposed analytical framework provides a benchmark for translating low-cost sensor-based air pollution measurements into relevant health-based dose metrics. The proposed analytical framework can be readily modified to incorporate satellite-derived PM inputs alongside low-cost sensor data, enabling improved spatial scaling of size-resolved, dose-relevant exposure estimates.

How to cite: Sai Ganesan, K. D., Puttaswamy, N., Sendhil, S., Natesan, D., Ramasami, R., Desai, M., Pillarisetti, A., Vakacherla, S., Krishnan, R., Sambandam, S., Ramaswamy, P., and Balakrishnan, K.: Estimating Size-Resolved Lung Deposition Doses of Particulate Matter (PM) Using Low-Cost Sensor Data in Rural India, EGU General Assembly 2026, Vienna, Austria, 3–8 May 2026, EGU26-6264, https://doi.org/10.5194/egusphere-egu26-6264, 2026.

EGU26-6386 | ECS | Posters virtual | VPS4 | Highlight

Automated Analysis of City Level Climate Action Plans using Natural Language Processing Technique 

Sonam Sahu and Sudhanshu Shanker and the MU NLP team

The growing urgency of climate action at the city level has led to an exponential rise in documents that describe a city’s policy, action plan, or progress towards climate action. The increased number of documents has made it increasingly difficult for governments to track commitments and compare approaches across jurisdictions. These documents are essential for informed decision-making, but extracting useful information from unstructured PDF reports remains a largely manual, resource-intensive, and inconsistent process. Recent advances in AI and large language model (LLM) based document understanding offer strong potential, but their application in urban climate governance workflows is still limited. Integrating AI-driven document analysis into this workflow offers opportunity for building scalable, standardized, and transparent climate policy assessment.

This study presents an AI-assisted natural language processing (NLP) pipeline that automatically extracts, segments, and classifies climate actions from diverse policy documents. The workflow integrates layout-aware text extraction with an action-segmentation mechanism to identify action statements across heterogeneous formats. A fine-tuned, two-stage ClimateBERT classifier then categorizes actions: Stage 1 differentiates mitigation and adaptation measures (F1 = 93%), while Stage 2 assigns domain-specific sub-categories, achieving 92% F1 for mitigation and 91% for adaptation. An equity-detection module further identifies references to vulnerable groups, inclusivity, and justice-oriented themes.

The pipeline significantly reduces manual review effort and enhances consistency in understanding climate action. By enabling standardized comparisons, the approach directly supports mayors, policymakers, and urban practitioners in evaluating progress and designing more effective and equitable interventions.

As AI capabilities advance, such automated tools will strengthen climate governance by improving the accessibility, reliability, and strategic value of climate policy data.

How to cite: Sahu, S. and Shanker, S. and the MU NLP team: Automated Analysis of City Level Climate Action Plans using Natural Language Processing Technique, EGU General Assembly 2026, Vienna, Austria, 3–8 May 2026, EGU26-6386, https://doi.org/10.5194/egusphere-egu26-6386, 2026.

Nitrogen oxides (N₂O, NO, and NO₂) serve as critical linkages connecting climate systems, ecosystems, and atmospheric chemistry, with soils acting as a primary natural source. Adopting a multi-scale framework spanning global, regional, and field scales, we systematically examine the spatiotemporal heterogeneity of nitrogen oxide emissions from cropland soils. Spatially, emissions exhibit a latitudinal gradient, decreasing from low to high latitudes, with hotspots concentrated in agriculturally intensive regions. Temporally, emissions display multi-scale rhythmic patterns aligned with crop growth stages, seasonal cycles, and diurnal variations, tightly coupled to soil carbon-nitrogen transformation processes. From the perspective of carbon-nitrogen coupling mechanisms, we reveal how land management practices—including nitrogen fertilization, conservation tillage, and precision irrigation—regulate emissions by modulating soil organic carbon content, carbon-nitrogen ratios, and pore structure. Concurrently, climate change drivers such as rising temperatures, elevated CO₂ concentrations, and extreme precipitation alter microbial-mediated carbon-nitrogen transformation efficiency, collectively shaping the core mechanisms governing nitrogen oxide emissions. A meta-analysis further investigates light effects on soil nitrogen oxide emissions, demonstrating significant impacts: light exposure increased N₂O and NO fluxes by 57.28% and 116.19%, respectively. Notably, heightened UV-B radiation reduced N₂O emissions by 6.85%, whereas shading increased them by 77.23%, with crop-specific responses observed. Mechanistically, light regulates emissions by modifying soil physicochemical properties and restructuring nitrogen-cycling microbial communities. Current emission mitigation faces challenges, including underdeveloped monitoring systems, limited prediction accuracy due to multifactor coupling complexities, and poor regional adaptability of existing technologies. Integrating multi-source data (field observations, remote sensing inversion, laboratory experiments) with advanced modeling approaches—such as climate-soil-crop coupling models and machine learning algorithms—offers viable pathways to enhance emission prediction precision and optimize mitigation strategies. Looking ahead, priorities include establishing multi-scale automated monitoring networks, developing carbon-nitrogen coupling-driven predictive models, promoting regionally tailored carbon sequestration and nitrogen emission reduction technologies, and combining policy incentives with public engagement to reduce uncertainties in global carbon-nitrogen cycle projections. These efforts aim to strengthen scientific support for sustainable agricultural development.

How to cite: Li, D. and Shen, W.: Nitrogen oxide emissions from cropland soil: spatiotemporal heterogeneity, carbon-nitrogen coupling mechanisms, and mitigation strategies, EGU General Assembly 2026, Vienna, Austria, 3–8 May 2026, EGU26-9022, https://doi.org/10.5194/egusphere-egu26-9022, 2026.

ABSTRACT


The Taihu Lake region has experienced rapid land use intensification, characterized by conversions from natural wetlands (NW) to conventional rice-wheat rotation fields (RW) and further to greenhouse vegetable fields (GH), driven by economic interests. While such transformations are widespread, their combined effects on greenhouse gas (GHG) emissions and underlying soil microbial mechanisms remain poorly understood. This integrated study addresses these gaps through multi-faceted analyses of GHG fluxes, soil microbial communities, and nitrogen (N)-cycling functional genes across NW, RW, and GH sites. Two-year in-situ field experiments revealed significant GHG emission shifts: land use intensification reduced methane (CH₄) emissions (NW: 970.66 ± 100.09 kg C ha⁻¹; RW: 896.71 ± 300.44 kg C ha⁻¹; GH: 71.23 ± 63.62 kg C ha⁻¹) but markedly increased nitrous oxide (N₂O) emissions (NW: 3.35 ± 0.44 kg N ha⁻¹; RW: 14.38 ± 4.09 kg N ha⁻¹; GH: 81.62 ± 4.89 kg N ha⁻¹). Global warming potential followed the order RW > NW > GH, indicating intensified comprehensive greenhouse effects during NW→RW conversion and mitigation during RW→GH conversion. Microbial community analyses showed land use intensification directly altered bacterial and fungal compositions, with stronger impacts on bacteria. Bacterial communities correlated closely with soil NO₃⁻-N, pH, and electrical conductivity, exhibiting decreased deterministic processes (opposite to fungi). Arable lands (RW/GH) displayed more complex microbial networks, and seasonal variations (notably summer) influenced microbial diversity and function, though less strongly than land use effects. Integrating quantitative PCR and metagenomics uncovered microbial mechanisms driving N₂O emissions: intensification reshaped N-cycling microbial communities, depleting nitrogen fixation, dissimilatory nitrate reduction to ammonium, and anammox marker genes in GH soils. Denitrifying communities segregated similarly to total N-cycling assemblages, with increased network complexity but divergent stability. Critically, intensification amplified N₂O emission potential by elevating Pseudomonadota harboring nirK/norB genes (and associated communities) while reducing nosZ (encoding N₂O reductase) abundance—directly linking microbial functional imbalance to emission increases. Collectively, this study demonstrates that land use intensification in the Taihu Lake region drives GHG emission trade-offs (reduced CH₄ but amplified N₂O) and restructures soil microbial communities and N-cycling functions. These findings highlight the need to prioritize microbial functional balance (e.g., restoring nosZ-carrying taxa) in mitigation strategies, providing critical insights for sustainable land management in wetland-agricultural transition zones.


Acknowledgment

This study was funded by the National Key Research and Development Program of China (2023YFF0805403, 2025YFD1700403) and National Natural Science Foundation of China (42377311).

How to cite: Shen, W., Xiong, R., Qin, D., and Gao, N.: Integrated impacts of land use intensification on greenhouse gas emissions and soil microbial communities in the Taihu Lake Region: patterns, mechanisms, and implications, EGU General Assembly 2026, Vienna, Austria, 3–8 May 2026, EGU26-9373, https://doi.org/10.5194/egusphere-egu26-9373, 2026.

EGU26-9696 | Posters virtual | VPS4

Fog Risk Monitoring and Assessment for India Using Bayesian Networks and ECMWF IFS Ensemble Prediction System 

Sarath K Guttikunda, Nishadh Kalladath, Robert R Tucci, Jully Ouma, Ahmed Amdihun, and Sai Krishna Dammalapati

Dense fog events across India severely disrupt aviation, surface transportation, and daily activities during winter months, with northern districts experiencing extended periods of visibility issues. Building upon the WRF-based ensemble fog forecasting over the Indo-Gangetic Plain and BOFFIN-Melbourne's Bayesian Decision Network framework, this study proposes a continuous risk monitoring and decision support system at district-level (admin-2).

The operational system will conduct daily continuous risk assessment, leveraging satellite observations from MODIS/VIIRS/INSAT-3D and the ECMWF IFS ensemble forecasts (51 members, 0.25° resolution) including probabilistic meteorological predictions of temperature, dewpoint, wind speed, boundary layer height, relative humidity profiles, and cloud cover, to characterize antecedent fog conditions and to establish baseline occurrence patterns.

 A Bayesian Network will integrate these layers to provide real-time short-term forecasts using pre-defined conditional probability tables which encode relationships between stable boundary layer conditions, radiative cooling, and regional fog formation mechanisms. The operational output of the algorithms will be in the form of traffic light decision matrix for each district: Green (Minimal/Low risk - Monitor), Yellow (Moderate risk - Be Aware), Orange (High risk - Be Prepared), Red (Extreme risk - Take Action).

This paper will present the validation results from pilot districts and the development framework for scaling to nationwide continuous risk assessment, demonstrating the system's potential for proactive decision-making in transportation management, aviation operations, and public safety advisories.

References

  • Parde, Avinash N., et al. "Operational probabilistic fog prediction based on ensemble forecast system: A decision support system for fog." Atmosphere 13.10 (2022): 1608.
  • Boneh, Tal, et al. "Fog forecasting for Melbourne Airport using a Bayesian decision network." Weather and Forecasting 30.5 (2015): 1218-1233.

How to cite: Guttikunda, S. K., Kalladath, N., Tucci, R. R., Ouma, J., Amdihun, A., and Dammalapati, S. K.: Fog Risk Monitoring and Assessment for India Using Bayesian Networks and ECMWF IFS Ensemble Prediction System, EGU General Assembly 2026, Vienna, Austria, 3–8 May 2026, EGU26-9696, https://doi.org/10.5194/egusphere-egu26-9696, 2026.

EGU26-10657 | ECS | Posters virtual | VPS4

Machine learning analysis of global LAI trends and their relationship with climate variability (1982–2022) 

Daniel García-Diaz, Fernando Aguilar, Santiago Schauman, and Aleixandre Verger

Understanding vegetation responses to climate variability is essential for assessing long-term ecosystem dynamics. Leaf Area Index (LAI) is a widely used variable to characterise vegetation state and productivity. However, attributing observed global LAI trends to specific climatic drivers remains challenging due to non-linear interactions, strong spatial heterogeneity, and scale-dependent processes.

This study is conducted within the framework of the PROFECIA project, which aims to improve the monitoring and interpretation of vegetation responses to climate change by combining remote sensing observations and artificial intelligence techniques. We analyse global LAI trends over the period 1982–2022 using the GEOV2-AVHRR long-term satellite record and examine their relationship with trends in key climatic variables obtained from the ERA5 reanalysis, including temperature, precipitation, radiation, and several indicators of water availability and drought conditions. All trends are computed consistently over the 1982-2022 temporal record to ensure a homogeneous assessment of long-term vegetation–climate relationships at the global scale.

The vegetation–climate relationships are modelled using a suite of machine learning approaches, including tree-based methods and neural networks, designed to capture non-linear responses across diverse climatic and ecological conditions. Particular emphasis is placed on the role of the training strategy: different spatio-temporal sampling schemes are evaluated to assess their impact on model performance, robustness, and generalisation capability when analysing long-term trends at the global scale.

To move beyond purely predictive modelling, the study systematically applies explainable artificial intelligence (XAI) techniques to interpret the trained models. Methods such as SHAP-based attribution and partial dependence analyses are used to quantify the relative contribution of individual climatic drivers to observed LAI trends and to examine how these contributions vary across regions and time periods.

Overall, this work highlights the importance of combining robust machine learning training strategies with interpretability tools to improve the attribution of long-term vegetation trends to climatic drivers, providing new insights into global vegetation–climate interactions over the last four decades.

How to cite: García-Diaz, D., Aguilar, F., Schauman, S., and Verger, A.: Machine learning analysis of global LAI trends and their relationship with climate variability (1982–2022), EGU General Assembly 2026, Vienna, Austria, 3–8 May 2026, EGU26-10657, https://doi.org/10.5194/egusphere-egu26-10657, 2026.

EGU26-10823 | ECS | Posters virtual | VPS4

A Hybrid Neural Network and Cellular Automata Model for spatiotemporal Forecasting of PM10 and PM2.5 in Lima, Peru 

Brigida Maita, Priscila Condezo, Jhoreck Llanto, Shirley Huaman, and Janeet Sanabria

Particulate matter (PM) pollution represents a significant public health concern, in Lima, Peru. This issue is further compound by the lack of accurate forecasting tools due to limited monitoring networks. This study addresses this gap by developing and validating a hybrid model combining a Multilayer Perceptron (MLP) neural network and a type of rule-based Cellular Automata (CA) simulation. This model simulates and forecasts the spatiotemporal dispersion of PM10 and PM2.5. Using a decade of historical PM data (2015-2024) from seven monitoring stations and NASA's meteorological data, an optimized MLP was trained to learn the complex, non-linear transition rules from 47 engineered features. The model demonstrated remarkable performance in historical validation (R2 > 0.90), outperforming standard baseline models. When fed with weather forecast data, the model can operate as an Early Warning System (EWS), providing a reliable prediction horizon to anticipate the exceedance of Air Quality Standards. The resulting hotspot maps accurately identify high-risk areas, confirming the potential of this hybrid model as a robust, proactive, and quantitative tool for air quality management and public health protection in complex urban environments.

How to cite: Maita, B., Condezo, P., Llanto, J., Huaman, S., and Sanabria, J.: A Hybrid Neural Network and Cellular Automata Model for spatiotemporal Forecasting of PM10 and PM2.5 in Lima, Peru, EGU General Assembly 2026, Vienna, Austria, 3–8 May 2026, EGU26-10823, https://doi.org/10.5194/egusphere-egu26-10823, 2026.

EGU26-11502 | ECS | Posters virtual | VPS4

Regional Air Quality Management: A Scalable, Data-Driven Airshed Framework using Low-Cost Sensors across the Indo-Gangetic Plain, India 

Anandh P Chandrasekaran, Sachchida Nand Tripathi, Nimit Godhani, Malay Pandey, Piyush Rai, Navdeep Agrawal, Anil Kumar, and Snehadeep Ballav

In India, ensuring clean air for all is vital and should not be limited to urbanites. However, the current air quality monitoring networks and clean air strategies are limited to cities. Notably, the air quality status across regions is yet to be measured, and comprehensive regional management plans are non-existent. To address these significant research gaps, the Ambient air quality Monitoring over Rural areas using Indigenous Technology (AMRIT) project was envisioned and implemented by the Centre of Excellence Advanced Technologies for Monitoring Air-quality iNdicators (CoE – ATMAN), Indian Institute of Technology Kanpur. For the first time, over 1,400 low-cost PM2.5 sensors were installed across the states of Uttar Pradesh and Bihar at the block level. The sensor locations encompass a diverse range of land-use and land-cover categories, demographics, and communities. By leveraging a dense network of low-cost sensors, we developed a data-driven machine learning framework to delineate airsheds for regional air quality management for the first time. We utilized a recurrent neural network–based long short-term memory (LSTM) and hierarchical clustering algorithms with PM2.5 and meteorological data to delineate airsheds. The LSTM embeddings learn latent representations from PM2.5–ventilation coefficient (VC) time series, capturing spatiotemporal patterns and inter-variable relationships. These embeddings were then hierarchically clustered to delineate airsheds. Applying this framework, our results for Bihar show five distinct airsheds; three prevail in the north of the Ganges River, and two prevail in the south of the Ganges. Notably, Airshed 1, located in the northwest region, is highly polluted. However, during the post-monsoon and winter across the airsheds, PM2.5 levels were two to three times higher than the national standard (60 µg/m³), and on ~90% of days, people breathe unhealthy air. Similarly, we identified multiple distinct airsheds in Uttar Pradesh, as well as common airsheds that prevail across Bihar and Uttar Pradesh states. This emphasizes not only shared regional influences but also the need for an integrated approach to reduce PM2.5 pollution. Therefore, the identified airsheds would be instrumental in targeting the reduction of fine particulate pollution across the Bihar and Uttar Pradesh states. Furthermore, the scalable, data-driven airshed delineation framework using low cost sensors could be implemented across India and potentially globally. Thus, this will facilitate airshed-based air quality management plans and integrated policy interventions to ensure “clean air for all.”

Keuwords: Air Quality; Low-Cost Sensors; Airshed;  Indo-Gangetic Plain; Machine Learning

How to cite: P Chandrasekaran, A., Tripathi, S. N., Godhani, N., Pandey, M., Rai, P., Agrawal, N., Kumar, A., and Ballav, S.: Regional Air Quality Management: A Scalable, Data-Driven Airshed Framework using Low-Cost Sensors across the Indo-Gangetic Plain, India, EGU General Assembly 2026, Vienna, Austria, 3–8 May 2026, EGU26-11502, https://doi.org/10.5194/egusphere-egu26-11502, 2026.

EGU26-14158 | Posters virtual | VPS4

Open-Tool Frameworks for Cross-Platform Indoor Monitoring and Optimized Air Cleaning Strategie 

Federico Dallo, Lorenzo Tenti, Alessandro Palo, Thomas Parkinson, and Carlos Duarte

Indoor environments account for most human exposure to air pollution, yet indoor air quality (IAQ) monitoring and control remain fragmented across devices, platforms, and proprietary building automation systems. Commercial IAQ monitors and smart thermostats are widely available, but they typically operate in closed ecosystems with limited interoperability. In parallel, open-source communities have demonstrated the potential of low-cost sensing networks, yet these solutions rarely connect to building-level control systems capable of simultaneously reducing pollutant exposure and energy use. To address this gap, we present an open, interoperable framework that integrates open-source and commercial technologies for IAQ monitoring, data management, and automated building control[1]. The framework, developed within the EU-funded healthRiskADAPT project, is built on an open, production-ready IoT infrastructure for indoor environments. At the edge, low-cost sensor nodes collect and transmit environmental data. A web-based interface allows users to register locations, nodes, and sensors, and provides near-real-time visualization, historical analytics, and an interactive map of the sensor network. Beyond monitoring, the framework enables direct integration with commercial control devices such as smart thermostats, smart plugs, and filtration systems. This interoperability supports data-driven control strategies, including increasing ventilation during indoor pollution events, activating filtration during periods of poor outdoor air quality, and dynamically adjusting HVAC operation to balance comfort, energy use, and exposure reduction. By combining continuous mass-balance modeling[2] with real-time sensor data, the system will deliver actionable indoor-outdoor (I/O) ratios and exposure indicators. These outputs could drive automated responses but also support informed user behavior, such as choosing higher-efficiency filters during high-pollution episodes, using kitchen exhaust during cooking, or understanding the trade-offs between energy costs and health risks. In this way, the platform functions not only as a control system but also as an educational and decision-support tool for occupants and building managers. This presentation demonstrates how open-source hardware, open APIs, and modular integration pathways can create a flexible, transparent, and scalable ecosystem for IAQ management. The framework supports diverse use cases, homes, schools, workplaces, and research settings, while offering a roadmap toward energy-efficient, healthier indoor environments driven by interoperable technologies rather than isolated products.

[1] https://particularmatter.org

[2] Dallo, Federico, Thomas Parkinson, Carlos Duarte, Stefano Schiavon, Chai Yoon Um, Mark P. Modera, Paul Raftery, Carlo Barbante, and Brett C. Singer. "Using smart thermostats to reduce indoor exposure to wildfire fine particulate matter (PM2. 5)." Indoor Environments 2, no. 2 (2025): 100088.

How to cite: Dallo, F., Tenti, L., Palo, A., Parkinson, T., and Duarte, C.: Open-Tool Frameworks for Cross-Platform Indoor Monitoring and Optimized Air Cleaning Strategie, EGU General Assembly 2026, Vienna, Austria, 3–8 May 2026, EGU26-14158, https://doi.org/10.5194/egusphere-egu26-14158, 2026.

EGU26-18107 | Posters virtual | VPS4

Satellite-Based PM2.5 Estimation in Data-Sparse Urban Environments: Comparing Machine Learning and Geostatistical Approaches in Kolkata, India 

Anjali Raj, Tirthankar Dasgupta, Manjira Sinha, and Adway Mitra

Fine particulate matter (PM2.5) is among the foremost environmental determinants of human health, contributing to cardiovascular disease, respiratory illness, and premature mortality. In rapidly urbanizing regions of the Global South, accurate spatial characterization of PM2.5 exposure requires spatially continuous concentration surfaces that also provide reliable uncertainty estimates, yet ground-based monitoring networks remain severely sparse. Kolkata, India’s third-largest metropolitan area (population 14.9 million), exemplifies this challenge: only seven regulatory monitoring stations cover the entire city, leaving large areas unobserved.

This study evaluates how different PM2.5 surface generation strategies—satellite-based machine learning (ML) and spatial interpolation—differ not only in predictive accuracy but also in their ability to provide decision-relevant uncertainty under sparse monitoring conditions. Using six years of daily observations (2019–2024), we compare two complementary approaches. The first employs satellite-based ML, integrating Sentinel-5P trace gases, MODIS aerosol optical depth, ERA5 meteorological reanalysis, and static urban features (VIIRS nightlights, population density) to predict PM2.5. The second evaluates spatial interpolation methods—ordinary kriging, inverse distance weighting (IDW), and simple averaging—using station observations alone.

For satellite-based ML (Random Forest), the station-level model achieved R2 = 0.79 under leave-one-station-out (LOSO) validation, while grid-based model trained on kriging-interpolated targets reached R2 = 0.70 under temporal out-of-sample validation (train: 2019–2022, test: 2023–2024). Feature importance analysis consistently identified dewpoint temperature, air temperature, and surface albedo as dominant predictors, indicating that atmospheric conditions exert stronger control on PM2.5 variability than emission proxies or land-use variables.

For spatial interpolation evaluated under daily LOSO, all methods achieved comparable point prediction accuracy (R2 ≈ 0.85). However, uncertainty calibration diverged sharply. Ordinary kriging achieved 88% empirical coverage for nominal 95% prediction intervals (90% when including observation noise)—approaching theoretical calibration—whereas IDW and simple averaging exhibited severe under-coverage (45–52%), substantially underestimating true prediction error.

These findings yield three key insights: (1) satellite-derived predictors enable spatially complete PM2.5 estimation beyond monitoring locations, though with moderate accuracy; (2) when temporally aligned station data are available, interpolation achieves higher point accuracy than satellite-based ML; and (3) regardless of estimation strategy, only geostatistical approaches provide uncertainty estimates suitable for health-protective decision-making. We conclude that hybrid frameworks combining satellite-based spatial prediction with kriging-derived uncertainty characterization offer a principled pathway for generating spatially complete and risk-aware PM2.5 maps in data-sparse urban environments.

How to cite: Raj, A., Dasgupta, T., Sinha, M., and Mitra, A.: Satellite-Based PM2.5 Estimation in Data-Sparse Urban Environments: Comparing Machine Learning and Geostatistical Approaches in Kolkata, India, EGU General Assembly 2026, Vienna, Austria, 3–8 May 2026, EGU26-18107, https://doi.org/10.5194/egusphere-egu26-18107, 2026.

EGU26-20844 | Posters virtual | VPS4

Machine Learning-Based Prediction of Tropical Cyclone Intensification Over the North Indian Ocean Using ERA5 Reanalysis  

Dhanya Madhu, Neha Meriya Binu, and Maneesha Vinodini Ramesh

Machine Learning models are rapidly becoming popular for complementing, enhancing, and in some cases, replacing traditional numerical models. This study presents a data-driven framework for predicting 24-hour tropical cyclone intensification over the North Indian Ocean using supervised machine learning and ERA5 reanalysis data. Cyclones that formed over Bay of Bengal and the Arabian Sea during the period 1990–2024 are considered here.  We have integrated environmental parameters from ERA5 with intensity records from the IBTrACS archive, excluding early developmental stages and retaining only dynamically mature systems. Intensification is formulated as a binary classification problem based on the sign of the 24-hour change in maximum sustained wind speed. While this captures general strengthening behaviour, it does not distinguish between moderate and rapid intensification, nor does it estimate the magnitude of intensity change. Five machine learning models—Logistic Regression, Random Forest, Extra Trees, Support Vector Machine, and Multilayer Perceptron—are trained and evaluated. Results indicate that the Random Forest classifier has achieved the highest accuracy. Feature-importance analysis reveals strong physical consistency, highlighting the dominant roles of upper-level circulation, sea surface temperature, vertical wind shear, and atmospheric moisture in regulating short-term intensification. Cyclone Montha (2025) is used as a test case to illustrate the model's real-world applicability and is validated outside of historical data. The model-predicted intensification probability is estimated as 0.943, which indicates good performance. Although a single case study does not constitute statistical validation, this illustrates the applicability of data-driven models in tropical cyclone intensity estimation. The results encourage further investigations into the use of such data-driven models in tropical cyclone intensity prediction, which aids disaster management efforts.

How to cite: Madhu, D., Binu, N. M., and Ramesh, M. V.: Machine Learning-Based Prediction of Tropical Cyclone Intensification Over the North Indian Ocean Using ERA5 Reanalysis , EGU General Assembly 2026, Vienna, Austria, 3–8 May 2026, EGU26-20844, https://doi.org/10.5194/egusphere-egu26-20844, 2026.

EGU26-21338 | Posters virtual | VPS4

Hazardous gaseous pollutants (NOx, SO2, TVOCs) emission from solid fuels combustion and their mitigation using novel adsorbent materials 

Shamsh Pervez, Dharini Sahu, Yasmeen F. Pervez, Indrapal Karbhal, and Manas K. Deb

Traditional solid fuels are extensively used for domestic heating and cooking in developing countries, especially in rural and semi-urban regions. Combustion of these fuels is a major source of nitrogen oxides (NOx), sulfur dioxide (SO2), and volatile organic compounds (TVOCs), which significantly contribute to air pollution, respiratory disorders, secondary aerosol formation, and atmospheric photochemical reactions. The generation and release of these pollutants are strongly influenced by fuel moisture content, elemental composition, and inorganic constituents. This study presents a comprehensive investigation of the chemical characteristics of commonly used solid fuels and evaluates the potential of advanced functional materials for mitigating NOx, SO2, and TVOC emissions from domestic combustion sources.

Representative fuel samples, including fuel wood (FW), coal balls (CB), dung cake (DC), and crop residues (CR), were obtained from the Raipur–Durg–Bhilai region of Chhattisgarh, India, selected based on their prevalence and area-specific usage patterns. The samples were air-dried, pulverized, and homogenized prior to analysis. Moisture content was determined gravimetrically by oven drying at 105 °C. Ultimate analysis of carbon (C), hydrogen (H), nitrogen (N), sulfur (S), and oxygen (O) was performed using a CHNS/O elemental analyzer. Ionic species, including nitrate, sulfate, chloride, and major alkali and alkaline earth metals, were quantified using ion chromatography to assess their role in pollutant formation and combustion behavior. These chemical parameters were used to infer emission potential for NOx, SO2, and TVOCs.

NO emissions were generally higher for AR and DC, while FW showed the lowest NO EF. SO2 emissions followed a similar trend, with DC producing the highest levels and FW the lowest. TVOC emissions were elevated for fuels with higher moisture and inorganic content, such as AR and DC, whereas FW exhibited the lowest TVOC emission potential. CB displayed intermediate to high emissions, with particularly high TVOC formation due to its variable composition. Emission factors developed in simulated experimental chambers were validated against real-world measurements, indicating that domestic household emissions closely correspond to chamber-based estimates.

To address post-combustion emission control, advanced materials including graphene-based materials, biochar, graphitic carbon nitride (g-C3N4), metal oxides (MnO2/TiO2), zeolites, metal–organic frameworks (MOFs), covalent organic frameworks (COFs), and silica-based adsorbents were considered for NOx, SO2, and TVOC mitigation. Materials were characterized using BET surface area analysis, X-ray diffraction (XRD), Fourier transform infrared spectroscopy (FTIR), and scanning electron microscopy (SEM), confirming high surface activity and strong gas affinity. Their physicochemical properties, high specific surface area, tunable pore size distribution, and surface functional groups, enable efficient adsorption and catalytic transformation of pollutants. Graphene-based materials and biochar adsorb acidic gases through π–π interactions and surface oxygen functional groups, while g-C3N4 facilitates photocatalytic oxidation of NOx under visible light. Metal oxides such as MnO2/TiO2 catalyze the oxidation of SO2 to sulfate and TVOCs to less harmful products via surface redox cycles. Zeolites and MOFs provide selective adsorption of NOx and TVOCs through microporous confinement and acid–base interactions.

How to cite: Pervez, S., Sahu, D., Pervez, Y. F., Karbhal, I., and Deb, M. K.: Hazardous gaseous pollutants (NOx, SO2, TVOCs) emission from solid fuels combustion and their mitigation using novel adsorbent materials, EGU General Assembly 2026, Vienna, Austria, 3–8 May 2026, EGU26-21338, https://doi.org/10.5194/egusphere-egu26-21338, 2026.

EGU26-21667 | Posters virtual | VPS4

A multi-site comparison of spectral and co-spectral approaches for correction of turbulent gas fluxes with ICOS set-up 

Ariane Faurès, Dario Papale, Giacomo Nicolini, Simone Sabbatini, and Bernard Heinesch

Correction of high-frequency spectral losses is a major technical challenge of the eddy covariance (EC) technique. If not properly accounted for during post-processing, these losses can result in a systematic underestimation of the measured gas fluxes exchanged between the ecosystem and the atmosphere. To address this issue, several methods have been developed, with experimental approaches relying on the definition of a transfer function and its associated cut-off frequency to describe the EC system as a first order low-pass filter.

One still debated yet fundamental choice is whether to use power spectra or co-spectra to derive the system cut-off frequency. In this study, we present a systematic, multi-site, data-driven comparison of the these two methods. To do so, we used one year of CO2 and H2O data from all of 38 ICOS Class 1 and Class 2 stations (Integrated Carbon Observation System, www.icos-cp.eu), all equipped with a standard setup comprising the LI-7200 enclosed path analyser and the HS-50 sonic anemometer.

We showed that the corrections were limited for both approaches, especially for CO2, ranging from 1 to 1.2, generally higher for H2O, ranging from 1 to 2, and overall consistent across sites. This highlighted the good spectral performance of the enclosed path analyser as well as the effectiveness of the setup standardisation. Nonetheless, the results showed that differences in correction factors between the methods existed. They were analysed for all sites, separately for stable and unstable conditions. They increased with atmospheric stability and attenuation level, and decreased with measurement height above the canopy. In particularly, they were systematically the highest in stable conditions. However, when assessing the impact of the two corrections on cumulative u*-filtered fluxes, we found that rejections of most stable conditions through this standard post-processing filtering led to differences under 3% for CO2 in 89% of sites and under 6% for H2O in 79% of sites.

With this specific experimental setup, we suggest prioritising the co-spectral for two main reasons. First, sensor separation is a dominant part of the high-frequency attenuation and is treated experimentally in the co-spectral method, whereas the spectral approach relies on a fully theoretical formulation. Second, the spectral method requires a robust denoising procedure, which is not needed in the co-spectral approach. Finally, while recognising its crucial importance at a network level, we highlight the complexity of having a fully automatic pipeline for spectral corrections.

How to cite: Faurès, A., Papale, D., Nicolini, G., Sabbatini, S., and Heinesch, B.: A multi-site comparison of spectral and co-spectral approaches for correction of turbulent gas fluxes with ICOS set-up, EGU General Assembly 2026, Vienna, Austria, 3–8 May 2026, EGU26-21667, https://doi.org/10.5194/egusphere-egu26-21667, 2026.

EGU26-257 | Posters virtual | VPS5

Long-term peatland ecological assessment in England’s largest national park (Lake District) for restoration under changing climates 

Matthew Adeleye, Helen Essell, Josephine Handley, and Alexis Arizpe

The Cumbrian Wildlife Trust (CWT) is undertaking the most ambitious attempt to revive Britain’s lost temperate rainforest in Skiddaw, northern Lake District, over the next 100 years. This involves the restoration of native Atlantic tree and treeless communities, including peatland in the area. There are ongoing ecological surveys to map the current vegetation and assess peatland status to establish baseline for detailed framework to restore degraded bogs. In collaboration with the CWT, this study employs different lines of palaeoecological evidence to investigate Skiddaw bog’s ecological history, the degree of its degradation over time, and the role of climatic and anthropogenic factors in shaping the landscape. This long-term perspective complements ongoing ecological appraisals by establishing a comprehensive baseline to predict changes in the bog and develop robust restoration and conservation frameworks against future warming climates.

How to cite: Adeleye, M., Essell, H., Handley, J., and Arizpe, A.: Long-term peatland ecological assessment in England’s largest national park (Lake District) for restoration under changing climates, EGU General Assembly 2026, Vienna, Austria, 3–8 May 2026, EGU26-257, https://doi.org/10.5194/egusphere-egu26-257, 2026.

EGU26-644 | ECS | Posters virtual | VPS5

Insights into global carbon cycling using bi-monthly measurements of triple oxygen isotopes in CO₂ from Cape Point 

Sangbaran Ghoshmaulik, Casper Labuschagne, and Vincent Hare

In recent years, the triple-oxygen isotopic composition (Δ′¹⁷O) of CO₂ has emerged as a powerful tracer of atmospheric carbon cycling. The Δ′¹⁷O signature of tropospheric CO₂ is controlled by key processes, including global biosphere-atmosphere CO₂ exchange, tropospheric residence times, and stratosphere-troposphere mixing, each of which modifies CO₂ composition through dynamic isotopic fractionation. High-precision measurement of Δ′¹⁷O is essential for constraining models that predict future changes in atmospheric CO₂, yet current datasets remain limited owing to extreme low abundance of ¹⁷O and the considerable analytical challenges involved for accurate and precise isotopic measurement. A further obstacle is the absence of a well-constrained global background Δ′¹⁷O value for atmospheric CO₂ that restricts proper evaluation of deviations arising from diverse source contributions. As a result, model predictions of tropospheric Δ′¹⁷O(CO₂) often diverge substantially from observational constraints.

To address this gap, we have initiated high-precision measurements of δ¹³C, δ¹⁸O, and Δ′¹⁷O in atmospheric CO₂ using TILDAS (Tunable Infrared Direct Laser Absorption Spectroscopy) at the Stable Light Isotope Laboratory in University of Cape Town, South Africa. Bi-monthly air samples have been collected at the Global Atmospheric Watch (GAW) Cape Point station, South Africa, since December 2024. Given the station’s location, sampling is preferentially conducted under south-easterly wind conditions to minimize local anthropogenic influence. CO₂ is extracted, purified, and analysed with a precision of ±10 ppm (1σ). We will present the Δ′¹⁷O record and evaluate its correspondence with existing predictive models. We will also discuss perturbation of local Δ′¹⁷O values by regional fluxes, such as anthropogenic inputs or seasonal biospheric exchange. This initiative aims to provide the first annual Δ′¹⁷O (CO₂) baseline from the Southern Hemisphere and improve the accuracy of predictive models of the carbon cycle.

How to cite: Ghoshmaulik, S., Labuschagne, C., and Hare, V.: Insights into global carbon cycling using bi-monthly measurements of triple oxygen isotopes in CO₂ from Cape Point, EGU General Assembly 2026, Vienna, Austria, 3–8 May 2026, EGU26-644, https://doi.org/10.5194/egusphere-egu26-644, 2026.

EGU26-1693 | Posters virtual | VPS5

Evaluating different methodological approaches for very high spatial resolution mapping of agricultural areas exploiting UAV data: a case study from Greek agricultural site 

Pileas Charisoulis, George P. Petropoulos, Spyridon E. Detsikas, Eleftheria Volianaki, and Antonis Litke

The rapid technological developments of recent years have enabled new methods for acquiring aerial photographs and high-spectral-resolution imagery. In this context, unmanned aerial vehicles (UAVs) offer significant potential for high-resolution Land Use/Land Cover (LULC) mapping, allowing clear distinction between natural and human-made features. UAV-based approaches provide high accuracy, faster data acquisition, and cost-effective solutions for detailed LULC analyses. However, there is a fertile ground in evaluating different methodological approaches and testing different algorithms for obtaining robust and transferable results. To this end, the present study aims at comparing two advanced classification techniques for mapping agricultural areas using multispectral UAV data over a typical agricultural site. The area selected for the study consists of crops and agricultural land located near the town of Amygdales, in the regional unit of Grevena. The two techniques are SVM (Support Vector Machines) and MLC (Maximum Likelihood Classification). In overall, results showed that the SVM proved to be more accurate with an overall accuracy of 79.45% compared to 78.91% for MLC, while both methods achieved a Kappa coefficient of 0.72. The statistical significance of the findings was further confirmed from the Mc-Nemar statistical significance results which were also computed. The results evidenced the capability of both methods obtaining LULC maps at very high spatial resolution. All in all, the methodological approach presented herein provides potentially a low-cost solution in mapping agricultural areas at very high spatial resolution which may be also fully transferable and reproducible to other locations too, which offer potentially important pathways to be used in precision agriculture applications. Such information can be of practical value to both farmers and decision-makers in reaching the most appropriate decisions for field management.

Keywords: Precision Agriculture, Mapping, UAVs, Classification, Machine Learning, Support Vector Machine, Maximum Likelihood


Acknowledgement

The participation of George P. Petropoulos study is financial supported by supported by the ACCELERATE MSCA SE program of the European Union’s Horizon research and innovation program under grant agreement No. 101182930.

How to cite: Charisoulis, P., Petropoulos, G. P., Detsikas, S. E., Volianaki, E., and Litke, A.: Evaluating different methodological approaches for very high spatial resolution mapping of agricultural areas exploiting UAV data: a case study from Greek agricultural site, EGU General Assembly 2026, Vienna, Austria, 3–8 May 2026, EGU26-1693, https://doi.org/10.5194/egusphere-egu26-1693, 2026.

 Resource Use Efficiency (RUE) serves as a critical indicator of forest ecosystem functionality, reflecting the efficiency of forests in utilizing light, water, and carbon for biomass production. This study investigates the spatiotemporal dynamics of RUE across 14 major Indian forest types from 2014 to 2023 by integrating Light Use Efficiency (LUE), Water Use Efficiency (WUE), and Carbon Use Efficiency (CUE) derived from MODIS satellite products. Using an eco-hydrogeological framework coupled with Random Forest modeling, the study evaluates the influence of climatic, topographic, and hydrological variables on forest productivity. Results reveal considerable spatial heterogeneity and temporal variation in RUE, with the highest efficiencies observed in wet evergreen and semi-evergreen forests and the lowest in dry deciduous and thorn forests. WUE demonstrated substantial variability across forest types and years, particularly impacted by the 2016 drought. CUE was strongly influenced by elevation (R2 = 0.82), and slope emerged as a limiting factor in drier ecosystems. The study highlights that subtropical pine and montane forests exhibit resilience and adaptive efficiency, while arid-zone forests remain vulnerable to climatic stressors. These findings provide actionable insights for sitespecific sustainable forest management and climate resilience planning in India’s diverse forest landscapes. 

How to cite: Raj, A. and Kumar, R.:  Resource Use Efficiency (RUE) Dynamics of Indian Forests Through an Eco-Hydrogeological Approach Using Machine Learning , EGU General Assembly 2026, Vienna, Austria, 3–8 May 2026, EGU26-2734, https://doi.org/10.5194/egusphere-egu26-2734, 2026.

EGU26-3062 | ECS | Posters virtual | VPS5

Synthesis of greenhouse gas emission factors for forest organic soils in the Dfb zone of the Köppen–Geiger climate classification 

Aldis Butlers, Arta Bārdule, Andis Lazdiņš, and Muhammad Kamil-Sardar

Organic soils, especially peat soils, store large amounts of carbon and are therefore considered a significant source of greenhouse gas (GHG) emissions, disproportionately contributing to land-use emission estimates in countries with extensive organic soil areas. When synthesising emission factors (EFs), data are typically stratified by broad climate zones such as temperate and boreal. However, given the spatial distribution of available forest-soil GHG data, such stratification is suboptimal. Temperate forest soils remain less studied than boreal soils, although recent research has expanded the number of temperate estimates from 8 used in the IPCC default EF compilation to at least 91, with the most recent flux data originating from the Baltic states (56 sites). When deriving EFs for specific applications, it is preferable to pool data from regions with similar climatic conditions rather than restricting analyses to unnecessarily small datasets defined by national borders or aggregating data across overly broad and climatically diverse zones.

We reassessed forest-soil GHG emissions in the Baltic states by supplementing regional data with additional sites sharing the same Dfb climate zone under the Köppen–Geiger climate classification. This approach expanded the dataset from 56 to 98 sites, improving EF accuracy and enhancing comparability between neighbouring GHG emission estimates, regardless of whether countries rely solely on domestic data. While such analyses typically focus on drained organic soils, we also included undrained soils to support the establishment of emission baselines for assessing forest management impacts.

Average annual organic-soil emissions in the Dfb climate zone  (mean ± SE, per hectare of forest) were estimated at 0.22 ± 0.18 t CO2-C, 1.17 ± 1.58 kg CH4, and 2.82 ± 0.59 kg N2O for drained soils, and −0.60 ± 0.37 t CO2-C, 92.88 ± 78.05 kg CH4, and 2.81 ± 1.07 kg N2O for undrained soils. Expressed as CO2 equivalents using AR5 GWPs, total emissions were 1.59 ± 0.46 t CO2 eq. for drained and 1.15 ± 6.70 t CO2 eq. for undrained soils. Owing to high natural variability between site-level fluxes, the effect of drainage on GHG emissions remains uncertain. Although the mean difference between drained and undrained soils (0.44 t CO2 eq.) may indicate a long-term drainage effect, this estimate is highly doubtful. The dataset indicated that simple averaging across all sites is not well suited to deriving EFs, as CO₂ emissions from drained organic soils showed dependence on nutrient status and linkage to dominant tree species and stand age. Drained soils in young stands tended to act as emission sources, whereas older stands increasingly functioned as carbon sinks, with a transition at approximately 25 years of stand age. However, additional observations are required to accurately quantify this dynamic across the forest growth cycle. To illustrate the implications for national upscaling, we derived a Latvia-specific drained organic-soil CO₂ EF that accounts for the distribution of dominant tree species and stand types characterising soil nutrient availability, yielding a weighted EF of 0.14 t CO2-C ha⁻1 yr⁻1.

This work was supported by PeatTransform with co-funding from the European Union and the State Budget of Latvia (6.1.1.2/1/25/A/001).

How to cite: Butlers, A., Bārdule, A., Lazdiņš, A., and Kamil-Sardar, M.: Synthesis of greenhouse gas emission factors for forest organic soils in the Dfb zone of the Köppen–Geiger climate classification, EGU General Assembly 2026, Vienna, Austria, 3–8 May 2026, EGU26-3062, https://doi.org/10.5194/egusphere-egu26-3062, 2026.

EGU26-3144 | Posters virtual | VPS5

Assessing the effect of different ground sampling distances for drone-based mapping of fractional cover: a case study from a vineyard field in Northern Greece  

Georgios-Nektarios Tselos, Spyridon E. Detsikas, George P. Petropoulos, Konstantinos Grigoriadis, Vassilios Polychronos, Elisavet-Maria Mamagiannou, Panagiota Balomenou, Dimitrios Ramnalis, and Petros Masouridis

Monitoring the fractional cover of vegetation and bare soil is essential for sustainable land management, soil erosion control, and precision agriculture. However, accurately estimating these fractions from conventional satellite imagery is challenging due to mixed ground cover and limitations such as cloud contamination and coarse spatiotemporal resolution. High-resolution UAV imagery provides an effective solution by capturing fine-scale heterogeneity, enabling the application of spectral mixture modeling techniques to decompose each pixel into proportions of vegetation, bare soil, and other components. Understanding how GSD influences the performance of such mixture models is critical for optimizing UAV-based monitoring strategies and ensuring reliable, quantitative estimates of soil and vegetation fractions for informed land management decisions.

The objective of this study is to evaluate the sensitivity of fractional vegetation estimates to different ground sampling distances (GSDs) derived from unmanned aerial vehicle (UAV) imagery. Multispectral data were acquired using a UAV equipped with RGB, near-infrared, red, and red-edge sensors, flown at altitudes of 40 m, 80 m, and 120 m above ground level. The study area is a heterogeneous vineyard located in Drama, Macedonia, northern Greece. Image acquisition took place on 30 July 2025, under stable atmospheric and illumination conditions.

An object-based image analysis (OBIA) approach was applied to the UAV imagery, and the data were classified into three main land cover classes: photosynthetic vegetation, non-photosynthetic vegetation, and bare soil. Fractional vegetation cover estimates derived at each flight altitude were compared in order to assess the influence of spatial resolution on classification performance and vegetation fraction retrieval. Validation of the classification results was performed using an independent dataset generated through direct photo interpretation, allowing for an objective assessment of accuracy across the different GSDs.

This contribution aims to evaluate the effects of different ground sampling distances (GSDs) on the estimation of fractional vegetation cover (FVC) using multispectral UAV imagery over commercial vineyards in Northern Greece. The study highlights the influence of spatial resolution on canopy representation, particularly in young or sparsely developed vineyards, and supports the development of robust UAV-based tools for precision viticulture

Keywords: UAV, Vineyard, Fractional Vegetation Cover , ACCELERATE

Acknowledgement: This study is supported by ACCELERATE research project which has received funding from the European Union’s Horizon  research and innovation program under grant agreement No.101182930.

How to cite: Tselos, G.-N., Detsikas, S. E., Petropoulos, G. P., Grigoriadis, K., Polychronos, V., Mamagiannou, E.-M., Balomenou, P., Ramnalis, D., and Masouridis, P.: Assessing the effect of different ground sampling distances for drone-based mapping of fractional cover: a case study from a vineyard field in Northern Greece , EGU General Assembly 2026, Vienna, Austria, 3–8 May 2026, EGU26-3144, https://doi.org/10.5194/egusphere-egu26-3144, 2026.

Bamboo expansion constitutes a significant process altering forest ecosystem structure and function. However, quantitative research remains scarce on how its long-term evolution influences the critical relationship between ecosystem productivity and biodiversity. This study aims to evaluate the long-term ecological effects of bamboo expansion in Wuyishan National Park (a biodiversity hotspot in China).

By analysing Landsat time-series imagery (1986–2020) and existing land cover dynamic classification maps, seven land cover types—including bamboo forests and broad-leaved forests—were identified. Analysis of surface classification results revealed an overall upward trend in bamboo forest area, with expansion primarily occurring at the expense of broad-leaved forests. Notably, 48% of the newly added bamboo forest area resulted from the conversion of broad-leaved forests.

To assess ecosystem responses to bamboo expansion, spectral diversity was quantified using Rao's Q index (functional diversity) and Shannon index (species diversity), calculated from NDVI and NDMVI. Ecosystem productivity was characterised via habitat indices (DHIs) derived from NDVI time series. Results indicate that regional ecosystem productivity has steadily increased, whereas spectral diversity has markedly declined, with both Rao's Q and Shannon indices showing significant downward trends. Specifically, bamboo forest patches exhibited higher Cumulative DHI (8.8 ± 0.65) than broadleaf forests, yet lower Rao's Q indices (0.010 ± 0.004), whereas broadleaf forests recorded (8.7 ± 0.69) and (0.011 ± 0.003), respectively. Moreover, farmland and tea plantations exhibited abnormally high Rao's Q values, likely attributable to fragmentation and edge effects (small patches embedded within forest backgrounds) rather than genuine species richness.

The study employed Theil–Sen trend estimation and Mann–Kendall significance testing to investigate correlations between bamboo forest area changes and biodiversity. Results revealed a significant negative correlation between bamboo forest expansion and spectral diversity indices (R²≈−0.36), suggesting bamboo encroachment may diminish biodiversity.

The observed trend of increasing productivity coupled with declining spectral diversity warrants further analysis to elucidate underlying drivers. Future research should integrate additional vegetation indices and morphological parameters for diversity calculations. Furthermore, long-term assessments of animal habitat suitability and ecosystem stability require combined ground-truthing and modelling approaches.

How to cite: Shi, W., Zhang, Q., and Qiu, F.: Bamboo Expansion Drives Divergence in Productivity and Spectral Diversity in Wuyishan National Park over Nearly Four Decades, EGU General Assembly 2026, Vienna, Austria, 3–8 May 2026, EGU26-3212, https://doi.org/10.5194/egusphere-egu26-3212, 2026.

Java Island is experiencing severe degradation of natural mangrove forests due to anthropogenic pressure, particularly in Probolinggo Regency. Although restoration programs have been widely implemented, the success rate remains very limited due to unsuitable planting technique and suboptimal species selection. This study provides the first baseline ecological assessment of vegetation status and estimation of carbon stock to support more effective restoration planning. Using a quantitative random sampling method, data on species identification, vegetation height, and diameter at breast height (DBH) were collected from 33 plots across eight sub-districts. Avicennia marina, Rhizophora mucronata, and Avicennia alba, are the dominant species with relative abundance varied by location. Saplings represented the most abundant growth stage, while trees exhibited the lowest abundance, indicating high past historical degradation. The westernmost sub-district exhibited the lowest Shannon–Wiener diversity index (H' = 0.9), suggesting higher anthropogenic pressures than others. Species richness, evenness, and dominance remain substantially varies across sub-districts. The total estimated carbon stock was 292 Mg C ha⁻¹, comparatively low for Indonesian mangroves ecosystems. The natural mangrove forests in Probolinggo Regency are in early-mid successional stage, reflecting strong past degradation. These findings highlight the urgency of restoration program to improve the total carbon stock across all sub-districts, particularly western areas, with careful consideration of site-species suitability. 

This research was conducted at the Warm-Temperate and Subtropical Forest Research Center, National Institute of Forest Science (Project No. FE-2022-04-2025).

How to cite: Qurani, C. G., Rizal, M., and Sugiana, I. P.: Baseline ecological insights of vegetation assessment and carbon stock estimation in natural mangrove forests of Probolinggo Regency, Indonesia, EGU General Assembly 2026, Vienna, Austria, 3–8 May 2026, EGU26-6317, https://doi.org/10.5194/egusphere-egu26-6317, 2026.

Stable carbon and nitrogen isotopes are widely applied to infer plant water-use efficiency and nutrient dynamics; however, their physiological interpretation remains uncertain when isotopic signals are not supported by functional measurements. Here, we combine elemental and isotopic analysis (EA-IRMS; δ¹³C, δ¹⁵N, %C, %N and C/N ratio) with fast chlorophyll a fluorescence assessed in vivo through the JIP-test (Handy-PEA) to resolve the physiological meaning of isotopic variability across two genotypes and three geographical contexts of typical Italian red chicory.
In December 2024, leaves and roots of two Cichorium intybus cultivars (“Rosso precoce di Chioggia” and “Rosso precoce di Treviso”) were sampled across three sites, resulting in four genotype–site combinations. Plants were collected at their areas of origin, as defined by Protected Geographical Indication (PGI, Chioggia and Treviso), and outside the PGI area in Massenzatica (Ferrara, Italy), where both cultivars are cultivated in a sandy coastal soil. Isotopic and elemental analyses revealed a pronounced site-dependent differentiation. Leaf and root δ¹³C values varied among sites, indicating substantial long-term differences in C discrimination, related to the balance between transpiration and CO₂ assimilation, which seemed more favourable in Chioggia. δ¹⁵N further discriminated sites and cultivars, highlighting marked differences in N dynamics and internal allocation, although without clear attribution to specific sources.
To assess whether isotopic shifts reflected adaptive regulation or functional impairment, chlorophyll fluorescence transients (OJIP) were analysed using JIP-test parameters. All samples exhibited the typical polyphasic OJIP pattern, yet clear differences emerged between cultivars and sites. Across the entire induction curve, the Treviso PGI transient were consistently higher at the J and I steps than the other samples. This pattern was associated with increased light absorption and energy dissipation per photosystem II reaction centre (ABS/RC, DI₀/RC), reduced electron transport efficiency (ET₀/RC), and lower probabilities of electron transfer to photosystem I end acceptors (ψ(RE₀), δ(RE₀)), indicating a tendency to over-reduce the electron transport chain, probably driven by downstream limitations in electron utilisation.
Overall, our results demonstrate that a more negative δ¹³C, while implicating a better water use efficiency, does not necessarily reflect an overall better plant adaptation, which could be affected by  some biochemical photosynthetic constraints. Integrating EA-IRMS with JIP-test fluorescence analysis provides a robust framework to discriminate between stomatal regulation and biochemical limitation, improving the mechanistic interpretation of isotopic markers for geographical fingerprinting and genotypic differentiation in climate-sensitive agroecosystems.


This research was allowed by phD fellowship granted by EUROPEAN SOCIAL FUND P L U S - The ESF+ 2021-2027
Programme of the Regione Emilia Romagna

How to cite: Martina, A., Ferroni, L., and Marrocchino, E.: From isotopic fingerprints to functional diagnosis in Italian red chicory: linking δ¹³C and δ¹⁵N to photosynthetic performance across geography and genotype, EGU General Assembly 2026, Vienna, Austria, 3–8 May 2026, EGU26-8969, https://doi.org/10.5194/egusphere-egu26-8969, 2026.

EGU26-11249 | ECS | Posters virtual | VPS5

How Soil Quality Affects Long-Term Rice Productivity 

Saheed Garnaik, Prasanna Kumar Samant, Mitali Mandal, Ravi H Wanjari, Nishant Kumar Sinha, Monoranjan Mohanty, and Narendra Kumar Lenka

Sustaining rice productivity in intensive rice-rice systems requires comprehensive soil management, with diagnosis of key soil physical, chemical, and biological indicators that need attention. In a 16-year long-term experiment (established in 2005-06 and ongoing) of the irrigated double rice system of Eastern India, we investigated the effect of key soil drivers on rice productivity.

The experiment assessed the effect of control (no N fertilizer application), imbalanced fertilization (N/NP/PK), balanced and recommended NPK and 150% NPK, NPK with lime, micronutrient additions (Zn with/without S or B), and integrated nutrient management with FYM (with/without lime), Composite surface soil samples (0-15cm) were collected after harvest of the 32nd rice season for evaluation of soil physical, chemical, and biological properties. Rice grain yield after the 32nd season was recorded at 14% grain moisture.  

To identify key soil drivers, an interpretable machine learning framework was used, specifically a conditional random forest-based yield model, permutation-based variable importance, and accumulated local effect (ALE) plots. The model described the yield variability very well (mean RMSE 305 kg ha-1, R2 0.88, MAE 254 kg ha-1). Variable importance screening highlighted total K, protease, and urease activities, as well as permanganate-oxidizable carbon (POC), as dominant predictors. ALE-based effect sizes suggested these properties accounted for ~400 (total K), ~250 (protease), ~200 (urease), and ~140 (POC) kg yield variability.

Overall, the results indicate that potassium dynamics are a primary constraint in intensive rice-rice systems, with risks associated with continuous K mining, and emphasize the importance of routine monitoring of biological activity indicators for long-term sustainability.

Keywords: Conditional random forest; Soil quality index (SQI); Long-term fertilizer application; K-dynamics; Soil enzymes; Cattle manure

How to cite: Garnaik, S., Samant, P. K., Mandal, M., Wanjari, R. H., Sinha, N. K., Mohanty, M., and Lenka, N. K.: How Soil Quality Affects Long-Term Rice Productivity, EGU General Assembly 2026, Vienna, Austria, 3–8 May 2026, EGU26-11249, https://doi.org/10.5194/egusphere-egu26-11249, 2026.

EGU26-12087 | ECS | Posters virtual | VPS5

Hyperparameter Sensitivity Analysis of Support Vector Machine for Crop Type Classification Using Sentinel-2 NDVI Time Series 

Fatima Ben zhair, Haytam Elyoussfi, Mouad Alami Machichi, Rahma Azamz, Jada El Kasri, Bouchra Boufous, and Salwa Belaqziz

Support Vector Machine (SVM) classifiers are widely used for satellite-based crop mapping, yet hyperparameter tuning is often treated as a black-box process, with limited insight into how individual parameters influence classification performance. This limitation becomes critical when deploying SVM models across heterogeneous agricultural landscapes, where robustness and transferability are required. This study systematically investigates the sensitivity of SVM hyperparameters for crop type discrimination using Sentinel-2 NDVI time series over the Al Haouz plain in central Morocco, a heterogeneous irrigated agricultural region comprising winter cereals and perennial orchards. An exhaustive grid search was conducted across multiple orders of magnitude for the regularization parameter C (0.01–1000) and the RBF kernel coefficient γ (0.001–10). Model performance was evaluated using F1-score, Recall, and Overall Accuracy for six crop classes with contrasting phenological patterns.

Results reveal a pronounced asymmetry in hyperparameter influence. The regularization parameter C exhibits a high degree of robustness: once a moderate threshold is reached (C ≥ 1), classification performance stabilizes and remains insensitive to further increases. In contrast, γ shows a narrow optimal range (0.1–1.0), beyond which performance rapidly deteriorates. High γ values induce overfitting, particularly among crops with similar seasonal dynamics, as evidenced by persistent confusion between citrus and olive classes. The optimal configuration (C = 1, γ = 1) achieved an F1-score of 0.80 and an Overall Accuracy of 81%. More importantly, sensitivity analysis demonstrates that γ plays a dominant role in model calibration. These findings provide practical guidance for deploying robust SVM classifiers in data-limited agricultural contexts, where extensive hyperparameter tuning is often impractical.

How to cite: Ben zhair, F., Elyoussfi, H., Alami Machichi, M., Azamz, R., El Kasri, J., Boufous, B., and Belaqziz, S.: Hyperparameter Sensitivity Analysis of Support Vector Machine for Crop Type Classification Using Sentinel-2 NDVI Time Series, EGU General Assembly 2026, Vienna, Austria, 3–8 May 2026, EGU26-12087, https://doi.org/10.5194/egusphere-egu26-12087, 2026.

EGU26-12306 | ECS | Posters virtual | VPS5

A computationally efficient framework for modelling estuarine biogeochemistry 

Sarangu Santhoshkumar, Giorgia Verri, Olga Vigiak, Milad Niroumand, Francesco Riminucci, Sonia Silvestri, and Lorenzo Mentaschi

Estuarine systems are crucial in deciphering coastal ocean dynamics and biogeochemistry, including the vital role they play as ecological sequesters of greenhouse gases. We present a modelling framework that combines the Estuary Box Model (EBM) with the Biogeochemical Flux Model (BFM) to simulate the interplay between physical dynamics and biogeochemical processes. The EBM is a robust, yet simplified model that represents estuarine hydrodynamics, addressing salinity, temperature, and freshwater discharge variations. The BFM simulates nutrient cycling, microbial interactions, phytoplankton dynamics, organic matter mineralization and particulate sedimentation across chemical functional families and living functional groups. To realistically simulate estuarine scenarios, the passive tracer transport equation was adapted to include explicit biogeochemical reaction terms within a time-varying estuarine simplified control volume, furthermore, accounting for riverine nutrient inputs, vertical mixing, tidal exchange and various biological feedback. Additional alterations were made to accommodate burial and sequestration parameters better representing estuarine zones.
The coupled framework was applied to the Po di Goro estuary in northern Italy, and the simulations were conducted for the period 2010 to 2023. The results were validated by comparing the Chlorophyll concentration outputs against satellite and in-situ buoy observations. The outcomes show a strong correlation between phytoplankton biomass and residence time during periods of algal blooms, whereas a rapid shift to zooplankton propelled top-down grazing control during prolonged periods of stable conditions. The model effectively replicates the organic matter sedimentation dynamics typical of deltaic environments, offering insights into the scale and factors controlling the burial and sequestration of organic matter in these ecosystems. The coupled EBM-BFM system is a highly computationally efficient and scalable framework for understanding the estuarine ecosystem drivers, with important potential applications in biogeochemical variability, nutrient retention, and climate-driven changes in coastal zones.

How to cite: Santhoshkumar, S., Verri, G., Vigiak, O., Niroumand, M., Riminucci, F., Silvestri, S., and Mentaschi, L.: A computationally efficient framework for modelling estuarine biogeochemistry, EGU General Assembly 2026, Vienna, Austria, 3–8 May 2026, EGU26-12306, https://doi.org/10.5194/egusphere-egu26-12306, 2026.

The European Environment Agency data on nitrates levels gives us a ratio of 8:1 for nitrates in groundwater versus river water, when we analyse the data across 27 countries. The “missing” nitrate, at an average of about 89%, matches the levels of “missing” nitrate due to capture of nitrate on the river bottom, by microbes known as diatoms, which take up 65-95% of the water nitrate load.

Diatoms convert nitrate to ammonium in daily cycles, that are linked to sunlight and Oxygen abundance, encountered in typical river and lake conditions.

We can identify that the major pathway of nitrate into rivers and lakes is through groundwater feeds, which average 25% of surface waterway volumes worldwide -because their nitrate levels dwarf those from any other source. We can also identify that the main mechanism of nitrates removal in river bottoms is diatom capture, where diatoms take up the bulk loads of nitrate arriving in the groundwaters beneath.

Diatoms' virtual monopoly on nitrates conversion may allow us to control N2O and global warming levels, by intercepting the conveyor belt system of nitrates to diatoms in waterways. We can capture and repurpose the nutrient for use as farm fertilizer and harvest diatom ammonium as a carrier for Hydrogen fuel. Diatoms are already farmed commercially for fish food, showing they are amenable to farming, and they are already a source of soil conditioner for farms. Ammonium is harvested in wastewater plants for Hydrogen fuel purposes already, and diatoms offer a low carbon method of ammonium production.

The junction between the UN, EEA and microbial data also allows us to calculate the world processing levels of nitrate in terms of both natural and human produced components. We obtain a range around 300,000 kilotons per annum as being processed by surface waters worldwide from all sources. About 120,000 kilotons of the load comes from human produced sources.

Ammonium nutrient from diatom nitrate conversion is quickly absorbed by aquatic plants and riverside trees, but there is a risk of high levels on hot days in lowered Oxygen conditions. Trees draw up around 1000 litres a day of groundwaters in river basins, so that ammonium and nitrates consumption by trees is additionally a main mechanism of Nitrogen reduction around the riverbed.

How to cite: Hall, C., Smith, D., Munro, A., and Sgroi, A.: Microbial breakthroughs in 2022 now allow us to link United Nations water volumes with EEA nitrates data, to reveal world nitrates processing loads in kilotons, including how much nitrate is from natural sources, and how much is from human activity., EGU General Assembly 2026, Vienna, Austria, 3–8 May 2026, EGU26-13318, https://doi.org/10.5194/egusphere-egu26-13318, 2026.

EGU26-13501 | ECS | Posters virtual | VPS5

Vegetation Dynamics and Atmospheric Glyoxal in Houston, Texas (2018-2022) 

Salma Bibi and Bernhard Rappenglück

Twenty years of MODIS satellite data (2002-2022), TROPOMI glyoxal observations (2018-2022), and ground-based isoprene measurements were used to examine vegetation greenness (NDVI) and atmospheric glyoxal over Houston, Texas. Biogenically produced glyoxal grew by 51% between 2018 and 2022, despite a 2% per decade decrease in summer vegetation greenness and continued urbanization. Ambient mixing ratios of isoprene, the main biogenic glyoxal precursor, paradoxically dropped by 14% within the same time frame. Temperature (+0.68°C/year), ozone (+28%), and photochemical oxidants all significantly increased over this time, according to analysis of concurrent environmental data. The results indicate that higher temperature-driven isoprene emissions (+35%) and accelerated photochemical oxidation (+10%) overcame the declining vegetation signal, resulting in net increases in atmospheric glyoxal. This suggests that Houston's remaining flora is experiencing temperature-driven changes in biogenic volatile organic compound (VOC) emissions per unit area, even while its greenness has reduced.

Keywords: MODIS NDVI; TROPOMI glyoxal; Isoprene emissions; Photochemical oxidation

How to cite: Bibi, S. and Rappenglück, B.: Vegetation Dynamics and Atmospheric Glyoxal in Houston, Texas (2018-2022), EGU General Assembly 2026, Vienna, Austria, 3–8 May 2026, EGU26-13501, https://doi.org/10.5194/egusphere-egu26-13501, 2026.

EGU26-13704 | ECS | Posters virtual | VPS5

Data-driven modelling to quantify soil organic carbon in burnt croplands: An integration of remote sensing and machine learning  

Jayantifull Hoojon, Mukund Narayanan, and Idhayachandhiran Ilampooranan

Stubble burning after harvest is known to degrade soil organic carbon (SOC). However, research on its long-term impacts on SOC is scarce and inconclusive. To address this gap, we introduce a data-driven modeling approach for SOC quantification by integrating remote sensing data with machine learning models to quantify changes in SOC during 2004-2021 across burnt rice areas in Punjab, India. This involved synthesizing literature to obtain SOC values pre- and post-burning, as well as intersecting MODIS burnt areas with rice crop maps to identify stubble burning areas in Punjab from 2004 to 2021. Post synthesis and identification, MODIS satellite band values were extracted for the synthesized experimental plots on pre- and post-burning dates. Further, remote sensing indices, which are sensitive to SOC changes such as NDVI, NBR, RECI, and BSI, were calculated for the pre- and post-burning dates. Using these indices and band values as predictors and literature-derived observed SOC values as response variables, multiple machine learning models were trained, whereby an R2 value of 0.3 was obtained. While further efforts are required to improve model accuracy, our study revealed a significant decline in SOC from 2004 to 2018, ranging from 0.1  to 12.5 %,  whereas from 2019 to 2021, SOC increased by 0.7 to 7 % in various districts in Punjab. More specifically, these districts-Sangrur, Ludhiana, and Kapurthala have had the most significant decline from 2014 to 2018, whereas Rupnagar, Patiala, and Fatehgarh Sahib exhibit the highest increase in SOC from 2019 to 2021. The decline in SOC could be attributed to accelerated mineralization driven by combustion and the loss of SOC in the form of CO2 emissions. Whereas the increase in SOC could be attributed to a reduction in stubble burning and incomplete combustion of residue, leading to the return of unburnt organic matter to the soil. These findings highlight the efficacy of integrating remote sensing frameworks with data-driven machine learning models in monitoring SOC and other aspects of soil health.

How to cite: Hoojon, J., Narayanan, M., and Ilampooranan, I.: Data-driven modelling to quantify soil organic carbon in burnt croplands: An integration of remote sensing and machine learning , EGU General Assembly 2026, Vienna, Austria, 3–8 May 2026, EGU26-13704, https://doi.org/10.5194/egusphere-egu26-13704, 2026.

EGU26-15468 | ECS | Posters virtual | VPS5

Biocrusts mediate seasonal warming effects of soil N transformation in drylands 

Rui Hu and Zhishan Zhang

Drylands are mostly covered by biocrusts and are sensitive to climate change, which will likely affect nitrogen (N) transformation. However, it remains unclear the response of N transformation-related variables (N transformation rates, microbial biomass, and enzyme activity) to warming in biocrust-dominated dryland ecosystems. Here, we examined three soil cover types (bare soil, cyanobacteria- and moss-dominated soil) over a full year as we conducted a warming treatment (open top chambers) in the Tengger Desert. In order to quantify the response of N transformation-related variables to warming, we defined the warming effects (WEs) as the increment of N transformation-related variable per-unit variation of temperature. Our results showed that the presence of biocrusts can significantly increase the WEs of soil N mineralization rates (Rmin), nitrification rates (Rnit), the content of microbial biomass carbon (MBC) and nitrogen (MBN), and the activities of soil nitrate reductase (S-NR) and urease (S-UE). Microbial biomass under biocrusts was more sensitive to warming followed by enzyme activity. Meanwhile, the WEs in spring and fall were higher than those in winter and summer. The cumulative rainfall was the driving factor affecting the seasonal change of WEs. Therefore, the defining and studying warming effects expand our understanding of seasonal dynamics of N transformation, microbial biomass and enzyme activity, and emphasize the important roles of biocrusts as modulators of N cycling under climate change in dryland ecosystems.

How to cite: Hu, R. and Zhang, Z.: Biocrusts mediate seasonal warming effects of soil N transformation in drylands, EGU General Assembly 2026, Vienna, Austria, 3–8 May 2026, EGU26-15468, https://doi.org/10.5194/egusphere-egu26-15468, 2026.

EGU26-15799 | ECS | Posters virtual | VPS5

Peri-urban heat amplification of monsoon drought impacts on grasslands in the Kathmandu Valley 

Prasanna Dahal and Suraj Lamichhane

Kathmandu has undergone significant urbanization over the past decade, resulting in consistently warmer peri-urban regions compared to nearby rural landscapes due to the urban heat island effect. This study examines how baseline warming interacts with monsoon droughts to affect grassland ecosystems.

Using the Kathmandu Valley as a case study, we analyzed monsoon-season (June–October) data from 2000 to 2022, comparing land surface temperature (LST) and Normalized Difference Vegetation Index (NDVI) from MODIS, volumetric soil moisture from ERA5-Land, and reference evapotranspiration (ET₀) from Terra-Climate between peri-urban and rural grasslands. Grasslands were considered instead of agricultural regions to avoid the effects from irrigation. The premises of Tribhuvan University were chosen as the peri-urban location for their closeness to the core-city region and Changunarayan (Bhaktapur) was chosen as a rural location. The Standardized Precipitation Index (SPI-3) was derived from historical precipitation records (1980–2020) and drought years were identified by negative monsoon-mean SPI values.

The results reveal a persistent peri-urban heat penalty throughout the study period. On average, peri-urban grasslands were 0.94°C warmer than their rural counterparts. This contrast increased to 1.15°C during non-drought years but narrowed to 0.5°C during drought years, as rural grasslands experienced sharper warming related to soil moisture depletion and reduced evaporative cooling. Despite the partial thermal convergence, the peri-urban zone experienced greater ecological stress during droughts, with NDVI declining by approximately 4% relative to rural areas as soil in peri-urban region are 1.12% drier during droughts compared to rural grasslands. An average potential evapotranspiration difference of 23.6 mm exists between the region, and during droughts, the evapotranspiration is 2.66% higher in peri-urban region.

These findings demonstrate that monsoon drought reduces spatial thermal contrasts but does not eliminate peri-urban vulnerability. Persistent background heating in peri-urban landscapes results in elevated vegetation stress even when meteorological drought conditions are similar. These results highlight the importance of peri-urban land management and thermal mitigation strategies in reducing ecological stress under increasing climate variability in rapidly growing cities.

How to cite: Dahal, P. and Lamichhane, S.: Peri-urban heat amplification of monsoon drought impacts on grasslands in the Kathmandu Valley, EGU General Assembly 2026, Vienna, Austria, 3–8 May 2026, EGU26-15799, https://doi.org/10.5194/egusphere-egu26-15799, 2026.

The intensive irrigation-linked groundwater abstraction in North China Plain (NCP) is dramatically affecting the hydrological processes and regional climate. Impacts from these anthropogenic groundwater withdrawals are evident in the fluctuation of each component in the terrestrial water cycle, the lack of groundwater sustainability, and regional climate extremes. Ensuring future groundwater security within this context will largely depend on how accurately the human activities in the Human-Earth system model were represented. However, to date, most hydrological models and land surface models either ignore the representation of human intervention or realistically model sophisticated human activity processes. In this study, we incorporated two groundwater-fed irrigation schemes in the Noah-MP model and further used realistic irrigation water use results constraining irrigation water withdrawals. We evaluate the influence of the groundwater pumping representation on the simulation of evapotranspiration and groundwater water table depth using Fluxnet-MTE ET data and observational groundwater well data, respectively. The Noah-MP simulation with groundwater-fed irrigation produced ET that matched the magnitude of observations-based Fluxnet-MTE ET values. Observational well-depth anomaly fluctuations can be reproduced in irrigated areas within the groundwater-fed simulation. In addition, the improvement of groundwater pumping also helps to improve terrestrial water storage estimates in higher resolution. We estimated that, over a seasonal cycle, groundwater-fed irrigation in the model can account for 80% of the declining terrestrial water storage trend from 2003 to 2016. Our approach and results reinforce the importance of parameterizing human activities in the Human-Earth system model and better address the water security challenges under climate change and human interventions.


How to cite: dai, D.: Modelling the groundwater pumping for agriculture in the Noah-MP model to support sustainable water management over the North China Plain, EGU General Assembly 2026, Vienna, Austria, 3–8 May 2026, EGU26-16034, https://doi.org/10.5194/egusphere-egu26-16034, 2026.

EGU26-16677 | ECS | Posters virtual | VPS5

Quantifying N₂O Pulses from Millet Croplands: The Role of Drought-Rewetting Cycles Observed via Remote Sensing and CMIP6 

Pranjal Aarav, Pramit Burman, Gopal Phartiyal, and Sangeeta Sharma

Soil-derived N₂O represents a critical climate feedback in semi-arid agriculture. With a global warming potential (GWP) 298 times greater than CO₂, 6.2 TgN₂O-N is emitted annually from agricultural soils. The atmospheric acceleration with a growth rate >1.0 nmol mol-1 y-1 remains unexplained by fertilizer use alone, suggesting climate change as a critical driver of enhanced emissions, particularly through extreme precipitation and droughts. Rajasthan’s 4.6 million hectares of climate-resilient millet cultivation experience intense droughts and severe monsoon variability. Both these factors lead to drought-rewetting cycles and impact N₂O emissions, which remain unquantified at regional scales.

This study integrates satellite-derived measurements coupled with multi-model ensemble projections to model N₂O emission hotspots in the millet croplands at the district level in this state, which is a major producer of millet in India. Published millet area datasets for spatial distribution and water-filled pore space (WFPS) thresholds (80 - 95%, for optimal denitrification) with soil moisture proxies (NDVI, LST) are integrated to quantify N₂O flux. Standard precipitation index from CMIP6 models (SSP2-4.5, SSP5-8.5) is applied to quantify temporal shifts in wet and dry frequencies. 

The results indicated that the denitrification-dominated pathways have dominated during rewetting phases, with N₂O peaks lagging behind soil moisture recovery by 48–72 hours, consistent with the Birch effect. Meta-analytical synthesis suggests rewetting pulses release 5 - 10 times higher N₂O flux than constant moisture conditions. CMIP6 scenarios project 20 - 35% intensification in drought frequency by 2050, driving 15 - 25% increases in cumulative annual N₂O emissions under high-emission scenarios. The regional assessment enables evidence-based fertilizer timing and supports India’s Nationally Determined Contributions (NDCs) by quantifying emissions, thereby paving the way for more effective mitigation strategies.

How to cite: Aarav, P., Burman, P., Phartiyal, G., and Sharma, S.: Quantifying N₂O Pulses from Millet Croplands: The Role of Drought-Rewetting Cycles Observed via Remote Sensing and CMIP6, EGU General Assembly 2026, Vienna, Austria, 3–8 May 2026, EGU26-16677, https://doi.org/10.5194/egusphere-egu26-16677, 2026.

EGU26-17076 | Posters virtual | VPS5

Apple Flowering Response to Climate Variability along the Himalayan Elevation Gradient 

Yash Shukla, Vivek Gupta, and Sushil Kumar Himanshu

Apple flowering in the Himalayan region depends on winter chill and spring heat, which are changing under a warming climate. These changes have increased uncertainty in flowering intensity and timing across different elevations. In this study, high-resolution UAV imagery and a YOLOv8-based segmentation model were utilized to map tree-level flowering intensity across three apple orchards situated along an elevation gradient in the northwestern Himalayas. The YOLO model was found to reliably detect flower clusters and showed strong agreement with manual counts, with an R² value of 0.85. This allowed consistent comparison of flowering intensity across sites. The winter chill was estimated using the Dynamic Model, expressed as chill portions derived from ERA5 Land hourly temperature data. Spring heat accumulation was quantified using growing degree days. Flowering varied clearly with elevation. Mid-hill orchards bloomed earlier and showed lower visible flowering during UAV surveys. Higher-elevation orchards bloomed later and exhibited higher flowering intensity. The winter chill was sufficient at all sites. Flowering responses were mainly controlled by the combined effects of chill and spring heat. The results demonstrate that integrating UAV-based deep learning with climate indices provides a practical framework to assess climate-driven changes in apple phenology in mountain environments. This approach can support climate risk assessment and adaptive orchard management in the face of continued warming.

How to cite: Shukla, Y., Gupta, V., and Himanshu, S. K.: Apple Flowering Response to Climate Variability along the Himalayan Elevation Gradient, EGU General Assembly 2026, Vienna, Austria, 3–8 May 2026, EGU26-17076, https://doi.org/10.5194/egusphere-egu26-17076, 2026.

EGU26-18092 | Posters virtual | VPS5

Linking soil texture and organic carbon to leaf chlorophyll fluorescence in Pyrus communis orchards: a multi-site study in Emilia-Romagna, Italy  

Marcello Bigoni, Elena Marrocchino, Irene Viola, Marzio Zaccarini, Andrea Farinelli, and Lorenzo Ferroni

Since 2011 in Italy the surface area cultivated with pear tree (Pyrus communis L.) decreased from 35,400 ha to approximately 23,700 ha in 2023, driven by escalating production costs, stagnant market prices, and recurrent phytopathological challenges. Additionally, this decline has been hypothesized to be causally linked to progressively unfavorable climatic conditions, characterized by rising temperatures, frequent summer heatwaves exceeding 35°C, and reduced precipitation. The objective of this study is to identify the most effective soil–plant relationships across Emilia-Romagna, which is the leading Italian region for pear production. We aim at providing a scientific basis for adaptive management strategies linked to regional pedoclimatic variability, so as to support the future of the Italian periculture.
Three experimental orchards were located in the provinces of Ferrara, Modena and Ravenna, which are key districts in Italy for periculture were set up in 2023. Agro-meteorological conditions were continuously monitored through an online automated system. Soil samples were thoroughly characterized with respect to their texture, calcium carbonate content, pH, loss on ignition LOI, multi-element profiling by X-ray fluorescence (XRF). To link soil properties with the plant performance, fast chlorophyll a fluorescence was measured in leaves in June 2025 on BA-29 grafted trees and the PItot (total performance index) was calculated, which represents a synthetic indicator of photosystem II efficiency.

Soils at the Modena site were predominantly sandy, deriving from Apennine sediments, whereas soils from Ferrara and Ravenna sites exhibited a higher clay content resulting in greater, water-holding capacity. XRF analyses indicate that elemental concentrations at all sites were within expected background levels. LOI and calcimetric analyses were higher in Ravenna soils compared to those from Ferrara and Modena, indicating a greater organic matter and carbonate content. At the Modena site, trees exhibited significantly lower PItot values than those observed in  Ferrara and Ravenna sites, This pattern is attributable to the higher sand fraction, which promotes rapid water drainage and reduced nutrient retention in contrast to clay-rich soils where enhanced water and nutrient availability can support improved photosynthetic performance performance. A relationship could also be envisaged found between soil organic carbon content and PItot. Because meteorological conditions were comparable and the germoplasm was uniform across the three sites, the observed differences in photosynthetic performance can be primarily ascribed to soil properties. These location-specific soil–plant correlations can inform precision agriculture practices, rootstock-scion selection, and adaptation strategies to enhance the resilience of pear orchards under changing climate conditions.


Research funded by the European Union – NextGenerationEU, Ministero dell’Università e della Ricerca - Piano Nazionale di Ripresa e Resilienza, D.M. 630/2024.


How to cite: Bigoni, M., Marrocchino, E., Viola, I., Zaccarini, M., Farinelli, A., and Ferroni, L.: Linking soil texture and organic carbon to leaf chlorophyll fluorescence in Pyrus communis orchards: a multi-site study in Emilia-Romagna, Italy , EGU General Assembly 2026, Vienna, Austria, 3–8 May 2026, EGU26-18092, https://doi.org/10.5194/egusphere-egu26-18092, 2026.

Understanding the interactions (synergies and trade-offs) among ecosystem services (ESs) and their driving factors is crucial for sustainable ecosystem management under intensifying climate change and anthropogenic disturbances. In recent years, machine learning approaches have demonstrated strong potential in capturing nonlinear relationships and exploring the driving mechanisms of ES interactions. However, most existing studies provide unified explanations at the global scale and often overlook the spatial heterogeneity and spatial dependence inherent in geographic locations, thereby limiting the ability to reveal the differentiated effects of the same driving factors on ES synergies and trade-offs across regions. This gap becomes particularly critical in large river basins, where pronounced environmental gradients, spatial connectivity, and heterogeneous human activities jointly drive strong spatial differentiation in ecosystem processes and services.

In this study, we develop a geospatially explainable machine learning framework to more explicitly characterize the spatial variability of ES interactions and their formation mechanisms in the Yangtze River Basin, China. Specifically, six key ESs, including food supply (FS), water yield (WY), water purification (WP), soil conservation (SC), carbon sequestration (CS), and habitat quality (HQ), were quantitatively assessed for the period from 2000 to 2023. Spearman correlation analysis and geographically weighted regression (GWR) were then employed to identify the ES relationships and their spatial distribution patterns. Furthermore, the GeoShapley method was introduced to incorporate geographic location into the model interpretation process, thereby enhancing the transparency and interpretability of machine learning decisions. From a spatial interaction perspective, this approach enables the analysis and visualization of the differentiated driving effects of climate conditions, topography, land use, and human activities on ES synergies and trade-offs across different spatial locations.

This study shows that the geospatially explainable framework enhances insights into the formation mechanisms of ES interactions and provides scientific support for implementing zoned ecosystem management and targeted regulation strategies under ongoing global environmental change.

How to cite: Jiang, C., Yao, Y., and Ma, L.: Ecosystem service interactions and their driving factors based on a geospatially explainable framework: A case study in the Yangtze River Basin, China, EGU General Assembly 2026, Vienna, Austria, 3–8 May 2026, EGU26-18238, https://doi.org/10.5194/egusphere-egu26-18238, 2026.

EGU26-18930 | ECS | Posters virtual | VPS5

Improved Estimation of Gross Primary Productivity in Global Croplands Using a Transpiration-Based uWUE Model 

Sakshi Harde and Eswar Rajasekaran

Accurate estimation of gross primary productivity (GPP) in croplands is essential for quantifying terrestrial carbon uptake and understanding carbon–water coupling under increasing agricultural water stress. Conventional Light Use Efficiency (LUE) models typically rely on evaporative fraction (EF), derived from total evapotranspiration (ET), which does not distinguish between productive transpiration and non-productive evaporation. In contrast, transpiration-based framework explicitly represent the physiological coupling between carbon assimilation and water loss regulated by stomatal conductance. In this study, transpiration is estimated using a Leaf Area Index (LAI)-based approach driven by remotely sensed MODIS data and environmental variables within the underlying Water Use Efficiency (uWUE) framework.

We evaluate the transpiration-based uWUE model against an EF-based LUE model for GPP estimation using eddy covariance observations from 51 globally distributed cropland sites. The dataset includes 6 sites from India (Flux Tower and INCOMPASS networks), 3 sites from Japan (AsiaFlux), 9 sites from Europe, and 33 sites from the United States (FLUXNET), spanning a wide range of hydro-climatic and management conditions. Model performance was assessed using the coefficient of determination (R²), root mean square error (RMSE), and bias.

The transpiration-based uWUE model showed overall better agreement with observed GPP than the EF-based LUE model across the global set of crop sites. Improvements were evident in both the strength of the relationship with observations and the reduction of estimation errors. At the site level, uWUE more frequently achieved higher R² together with lower RMSE, demonstrating consistent performance across multiple evaluation metrics at a larger number of sites. Superior performance was observed at 28 sites, driven by the model’s ability to capture coupled carbon–water dynamics under varying crop types, canopy structures, and climatic conditions. In contrast, the EF-based LUE model showed advantages at a limited number of sites characterized by distinct water stress regimes or vegetation properties.

Overall, the results highlight the critical role of transpiration dynamics in GPP estimation, with higher GPP values associated with dense canopies and favorable environmental conditions. By explicitly isolating transpiration from total evapotranspiration, the uWUE framework provides a more physically meaningful representation of carbon–water interactions than ET-based approaches. These findings demonstrate that incorporating transpiration-based constraints improves GPP estimation in croplands and has important implications for large-scale agricultural carbon cycle assessments under future climate scenarios characterized by increased water stress and drought frequency.

How to cite: Harde, S. and Rajasekaran, E.: Improved Estimation of Gross Primary Productivity in Global Croplands Using a Transpiration-Based uWUE Model, EGU General Assembly 2026, Vienna, Austria, 3–8 May 2026, EGU26-18930, https://doi.org/10.5194/egusphere-egu26-18930, 2026.

EGU26-19408 | Posters virtual | VPS5

Enhancing carbon sequestration in water stressed plant–soil systems through soil amendment with a Superabsorbent Nanocomposite derived from natural materials 

Maria Guarda Reyes, Marcela Calabi Floody, Philippe Biron, Manuel Salvidar, Maria de la Luz Mora, and Cornelia Rumpel

Climate change and intensifying droughts represent a critical challenge to agricultural productivity and soil sustainability. This study evaluated the effect of two superabsorbent amendments with contrasting chemical compositions (polyacrylate-based polymer and a biodegradable polysaccharide nanocomposite) on carbon dynamics in common beans grown under drought conditions. The experimental design included analyses of morphological parameters, elemental composition, 13C allocation, and soil density fractionation. The results showed that drought drastically reduced biomass and nitrogen in leaves and roots, increased C:N ratios, and decreased root-derived carbon (RDC) incorporation, especially in stable soil fractions. The application of superabsorbents reversed these effects, increasing 13C translocation to roots and RDC in soil. NSN stood out for its ability to increase total RDC compared to the drought control parallelling the irrigated control in the heavy fraction associated with minerals, a key indicator of stable carbon sequestration. In contrast, Com mainly promoted flow to labile fractions, with less impact on stabilisation. These findings demonstrate that superabsorbents might be an effective tool for sustaining crop productivity and strengthening carbon sequestration in agroecosystems under conditions of increasing aridity.

How to cite: Guarda Reyes, M., Calabi Floody, M., Biron, P., Salvidar, M., Mora, M. D. L. L., and Rumpel, C.: Enhancing carbon sequestration in water stressed plant–soil systems through soil amendment with a Superabsorbent Nanocomposite derived from natural materials, EGU General Assembly 2026, Vienna, Austria, 3–8 May 2026, EGU26-19408, https://doi.org/10.5194/egusphere-egu26-19408, 2026.

EGU26-20818 | ECS | Posters virtual | VPS5

Agreement measures for continuous, ratio-scale data: cJaccard, cPrecision, cRecall and cF-score 

Katarzyna Krasnodębska, Wojciech Goch, Johannes H. Uhl, Judith A. Verstegen, and Martino Pesaresi

Continuous, spatially explicit estimates of environmental attributes are increasingly provided as gridded data. The accuracy of gridded data, including classifications derived from remotely-sensed data, is typically evaluated using measures based on confusion matrices with site-specific class allocations; however, these measures are defined for categorical variables and are therefore not applicable to ratio-scale attribute estimates representing quantities, such as canopy height or population abundance.

We present an approach that extends commonly used agreement measures, i.e. the Jaccard index, Precision, Recall, and F-score, to non-negative, continuous ratio-scale attributes. The extended measures (cJaccard, cPrecision, cRecall, and cF-score) are viable equivalents to their binary counterparts, invariant to data imbalance and suitable for evaluating the agreement of various types of data representing ratio-scale attribute estimates. The cJaccard measure has proven useful for a range of applications in the geospatial domain, illustrating the broader potential of these measures for evaluating large-scale environmental gridded data products and beyond.

The aim of this contribution is to showcase and discuss the practical application of these continuous agreement measures to real-world gridded datasets representing spatial-environmental variables. Through applied examples, we demonstrate how cPrecision and cRecall enable a directional interpretation of disagreement, disentangling commission and omission errors in the total proportion of misallocated magnitudes. We further illustrate how cJaccard provides a bounded, scale-independent measure of agreement that complements typically used error-based measures (such as Mean Absolute Error or Root Mean Square Error) in the data comparison process.

How to cite: Krasnodębska, K., Goch, W., Uhl, J. H., Verstegen, J. A., and Pesaresi, M.: Agreement measures for continuous, ratio-scale data: cJaccard, cPrecision, cRecall and cF-score, EGU General Assembly 2026, Vienna, Austria, 3–8 May 2026, EGU26-20818, https://doi.org/10.5194/egusphere-egu26-20818, 2026.

The increasing demand for reliable food authentication highlights the need for scalable and innovative tools to link geochemical fingerprints in food products with their geographic provenance. Food authentication is not only essential for preventing fraud but also offers a unique opportunity to relate agricultural products to their underlying geochemical signatures. Here we present a unified framework that combines stable isotopes (e.g. ⁸⁷Sr/⁸⁶Sr) and trace-element fingerprints measured in food products with explainable and cost-aware machine learning to support provenance verification.


We first develop a cost-aware binary classification model for French sparkling wines, demonstrating how high-precision ⁸⁷Sr/⁸⁶Sr ratios can be partially substituted by low-cost elemental proxies (e.g. Rb) while maintaining strong discriminative power. To address scalability constraints, we extend this approach to a multiclass setting using cost-sensitive logistic regression to classify wines from multiple Portuguese and Chilean regions, explicitly handling class imbalance and feature redundancy. Finally, we introduce TeaPrint, an unsupervised multimodal clustering framework that jointly integrates isotopic, elemental and volatile organic compound data to uncover coherent regional geochemical patterns in international tea samples without requiring prior labels.


Across these case studies, we show that food products carry integrated geochemical signatures that can be exploited for robust provenance authentication across heterogeneous datasets. By bridging forensic geochemistry and explainable machine learning, our approach offers a cost-efficient and scalable pathway towards robust provenance authentication and transparent food supply chains.

How to cite: Lu, Y., Doerr, C., and Sebilo, M.: From Geochemical Fingerprints to Food Authentication: Integrating Explainable and Cost-Aware Machine Learning for Provenance Analysis , EGU General Assembly 2026, Vienna, Austria, 3–8 May 2026, EGU26-21380, https://doi.org/10.5194/egusphere-egu26-21380, 2026.

Cropland abandonment is a key land-use change process within the human-environment system, shaped by diverse environmental and socio-economic determinants. However, many studies overlook the complex interrelationships among these determinants, which may result in the reconfiguration of agricultural landscapes. Here, we developed an analytic framework based on social-ecological system theory to map cropland abandonment archetypes in Sichuan Province, Southwest China, using a combination of biophysical conditions, proximity characteristics, socio-economic determinants, and the extent, cumulative proportion, and spatial configuration of abandoned croplands. We implemented self-organizing feature maps using a nested clustering approach, which resulted in 25 sub-archetypes and 6 meta-archetypes. We used random forest regressions to quantify the relative importance of explanatory determinants influencing archetype geographies. Our results revealed diverse cropland abandonment archetypes, with meta-archetype area shares ranging from 4.4 % to 48.4 %. The most widespread archetype was characterized by favorable terrain, low cropland per capita, and low cumulative proportions of abandonment. Determinants of meta-archetypes varied in their importance but consistently highlighted the role of environmental determinants (i.e., topography, temperature), as well as productivity-related and socio-economic determinants (i.e., employee wages, pension insurance, high-value crops) as the most important determinants. Our findings argue against one-size-fits-all solutions and are highly relevant to nuance existing regional land-use policies addressing cropland abandonment. They further allow targeting key determinants of cropland abandonment and considering regional and local socio-ecological contexts in decision-making processes.

How to cite: Hong, C.: Revealing nested archetypes of cropland abandonment based on social-ecological system theory, EGU General Assembly 2026, Vienna, Austria, 3–8 May 2026, EGU26-21572, https://doi.org/10.5194/egusphere-egu26-21572, 2026.

EGU26-21818 | ECS | Posters virtual | VPS5

Deciphering Olive Yield Determinants under Contrasting Water Regimes: A Multi-Site Machine Learning Approach in Morocco Agro-Ecosystems 

Rahma Azamz, Haytam Elyoussfi, Fatima Benzhair, Raouaa El Mousadik, and Salwa Belaqziz

Improving olive yield in Moroccan agro-ecosystems requires a better understanding of the interactions between water availability, soil properties, and management practices. The complexity and non-linear nature of these interactions limit the effectiveness of conventional analytical approaches. This study applies machine learning methods to predict olive yield and to assess how the importance of yield determinants varies under contrasting water regimes. A multi-site dataset from Moroccan olive groves, including more than 2,000 observations, was analyzed. Machine learning models showed high predictive accuracy across water regimes. Under rainfed conditions, CatBoost achieved the best performance (R² = 0.845), indicating that yield variability is mainly driven by soil properties and spatial context. Under irrigated conditions, XGBoost provided the highest accuracy (R² = 0.855), highlighting the increasing role of management practices such as planting density and nitrogen fertilization. Under intensive irrigation, fruit-related variables, particularly 100-fruit weight, became the dominant predictors, while the influence of edaphic constraints decreased.

Overall, the results demonstrate that irrigation does not simply increase olive yield but fundamentally alters the hierarchy of factors controlling production. These findings emphasize the need for data-driven, site-specific management strategies to enhance the sustainability and efficiency of olive production in Morocco.

How to cite: Azamz, R., Elyoussfi, H., Benzhair, F., El Mousadik, R., and Belaqziz, S.: Deciphering Olive Yield Determinants under Contrasting Water Regimes: A Multi-Site Machine Learning Approach in Morocco Agro-Ecosystems, EGU General Assembly 2026, Vienna, Austria, 3–8 May 2026, EGU26-21818, https://doi.org/10.5194/egusphere-egu26-21818, 2026.

Future food security will increasingly depend on the development of crop ideotypes that produce higher yields per unit of water used. Stomata are central to developing water-efficient crop ideotypes, as they serve as the primary gateway for carbon and water exchange. Process-based crop models are essential tools for testing crop phenotypes with favorable stomatal traits, as they can explain how changes in stomatal traits propagate to whole canopy carbon gain and water use. Yet, current models still struggle to connect leaf-level physiology to season-long canopy performance (e.g., yield) under realistic climate variability.

Current process-based models have one of these limitations: (i) lack of explicit biochemical photosynthesis module for C3 or C4 crops, preventing mechanistic analysis of crop phenotypes; and (ii) models that explicitly represent biochemistry ignore leaf energy balance dynamics and assume leaf temperature (Tleaf) equal to air temperature (Tair), ignoring the feedback between stomatal conductance, transpiratory cooling. As a result, they require extensive empirical calibration and are not recommended for exploring novel stomatal phenotypes, such as lower stomatal density and pore size. In particular, current efforts to manipulate stomatal traits in crops cannot be reliably evaluated using these simplifications, as they do not account for how changes in stomata affect CO2 diffusion and canopy energy balance.

This study presents a novel cross-scale framework, vLeaf@DSSAT, where we couple a process-based leaf model with the CERES-Maize growth model and introduce a two-leaf (sunlit–shaded) canopy representation. The explicit consideration of energy balance makes this framework distinct from similar attempts in the past. CERES-Maize provides daily crop state variables such as leaf area index (LAI), phenology, soil water status, and nitrogen status. Using these, vLeaf then computes hourly net assimilation and transpiration rates for both sunlit and shaded leaf areas. It computes photosynthesis, stomatal conductance, boundary-layer conductance, and leaf energy balance simultaneously in an iterative loop. Root water uptake from CERES-Maize constrains canopy transpiration; vLeaf then reruns under these constraints and updates Tleaf and gas exchange rates. The resulting canopy-scale assimilation from vLeaf drives the biomass accumulation in CERES-Maize on the next day, closing the loop between leaf biophysics and crop growth.

Simulations for climates based on a US Midwest reference site show that neglecting leaf energy balance results in sizeable errors in both carbon gain and water use. For cooler climates, forcing Tleaf = Tair underestimates seasonal carbon gain by ≈ 9% and transpiration by ≈ 30%. For warmer climates, the bias in carbon gain is small, but transpiration is overestimated by 5–10%. These errors can create uncertainty in ranking crop phenotypes with favorable stomatal traits. vLeaf@DSSAT provides a practical approach to testing stomatal manipulation, irrigation strategies, and climate-resilient ideotypes under realistic climate conditions, while also connecting leaf biophysics to field-scale yield and water use.

How to cite: Srivastava, A.: vLeaf@DSSAT: integrating leaf energy balance and biochemistry into CERES-Maize to reassess water-efficient ideotypes, EGU General Assembly 2026, Vienna, Austria, 3–8 May 2026, EGU26-231, https://doi.org/10.5194/egusphere-egu26-231, 2026.

Urbanization, together with increasing global population pressure and climate variability, has introduced heat-related challenges across urban areas, severely impacting humans and the Earth. The rapid population growth has placed India at the top of the global population ranking. Demographic surges concentrate stress on existing urban systems, making Indian metropolises-both inland hubs and rapidly transforming coastal centers-critical laboratories for studying UHI dynamics.

The understanding of patterns and possible causes of the UHI effect due to urbanization-induced anthropogenic activities is a vital area in urban climate research. This study presents an overall multi-decadal day/night spatiotemporal seasonal analysis and trends in LST and UHI for six Indian cities: Ahmedabad, Mumbai, Panjim, Mangalore, Kochi, and Thiruvananthapuram, spanning the last three decades.

MODIS LST and AOD data are used to explain the possible reasons for the change in LST and UHI, focusing on the seasonal thermal behavior of cities under prevailing atmospheric, meteorological, and anthropogenic conditions. The Landsat series datasets are used to develop LULC maps and delineate high-resolution UHI zones, to explain shared trajectories and city-specific patterns that expose complex vulnerabilities within urban ecosystems in India. The findings, which integrate multi-decadal 30-year satellite-derived LST, LULC, and AOD data, demonstrate that greater increases in nighttime LST are associated with a decrease in the diurnal temperature range across all cities. Mumbai consistently showed lower mean LST values compared to Ahmedabad, which exhibited substantially higher values and extreme seasonal amplitudes ranging from 17.23 °C to 50.05 °C. Goa and Mangalore depicted a 1-4 °C increase in seasonal mean LST between 1993 and 2023. Corresponding to a rise in built-up area and a decline in vegetation, Kochi too exhibited a rise in LST. Thiruvananthapuram showed a strong warming, with a mean LST increase of about 3°C. AOD patterns also demonstrated similar spatial and temporal gradients across cities, helping to reinforce land-use change, urban expansion, and inland-coastal climatic contrasts as the significant causes of LST trends.

Collectively, these findings reveal how land-use transition, and climatic variability, significantly alters the thermal environment of Indian cities; making such studies important for climate-responsive planning and better urban management to enhance resilience and thermal comfort.

How to cite: Rai, R. and Murali R, M.: Utilising geospatial data to understand urban heat island and its effect on urban thermal comfort in selected Indian cities using Remote Sensing and GIS, EGU General Assembly 2026, Vienna, Austria, 3–8 May 2026, EGU26-488, https://doi.org/10.5194/egusphere-egu26-488, 2026.

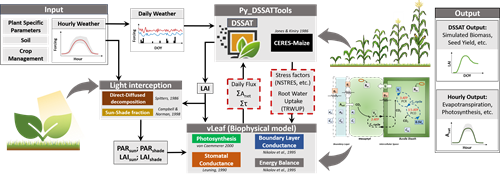
EGU26-984 | ECS | Posters virtual | VPS6

A systematic review of the diverse values of Seagrass Contributions to People (SCP) in Indonesia: A pilot study 

Dzaki Satrio Widanto, Sigit Deni Sasmito, and Nathan Waltham

Seagrass ecosystems in Indonesia provide a diverse array of services and societal benefits that helps to mitigate the impacts of climate change, yet they face complex threats and ongoing declines. Assessing their diverse values through pluralistic lenses can provide important baseline information to guide future conservation and restoration policies. Utilising the Seagrass Ecosystem Contributions to People (SCP) framework, a systematic review was conducted in representative seagrass ecosystem regions—west (Bintan), central (Selayar), and east (Ternate)—to examine the current state of research on their diverse values. Specifically, we identified the presence, perceived worldviews, characteristics, specific values, and their overlaps of SCP categories.

Publications were retrieved from Scopus, Web of Science, and the first ten pages of Google Scholar between February and April 2025. Then, following the Preferred Reporting Items for Systematic Reviews and Meta-Analyses (PRISMA) 2020 Guideline, a thorough literature analysis was conducted using six established inclusion criteria. Present SCPs, perceived worldviews, specific values, and their overlaps were assessed in accordance with core meanings derived from McKenzie and Colleagues, the Intergovernmental Science-Policy Platform on Biodiversity and Ecosystem Services (IPBES) report on the diverse values of nature, and Himes and Colleagues’ publication, respectively.

Overall, 54 publications were included in this review, spanning the years 1989 to 2025 and identifying 25 SCPs across three regions, with a decreasing number of studies for each SCP from west to east. There were imbalances in the SCP perception, with bioindicator and scientific research being perceived in all regions and having twice the number of publications compared to other SCPs. These two prevalent SCPs generally studied the ecological status of seagrasses, their associated biota, and experimental results on their monitoring methods (e.g. remote sensing).  

Biocentric and anthropocentric worldviews were researched more and dominated interchangeably between SCPs, focusing on seagrass conservation values and societal perceptions of its services. Meanwhile, the pluricentric worldview had singular studies limited to several Material and Nonmaterial SCPs. Excluding the east region, all three specific values (intrinsic, instrumental, and relational) were present, with instrumental as the most frequent overlapping value. These value overlaps demonstrated fuzzy boundaries between material and nonmaterial groups, but not with the regulating SCPs, which were all studied with a singular specific value.

Regional differences in seagrass ecosystem management, benefit utilizations, and research focus might reflect the variability of the perceived SCPs, worldviews, and value overlaps. Although these perceptions are still biased towards tangible benefits for human ends. However, most of the reviewed publications were short-term studies and distinct from each other, demonstrating the need for local experts’ knowledge elicitation to further weave the information. Our study further developed the SCP framework by incorporating the concept of nature’s diverse values, which is highly relevant and applicable to the seagrass socio-ecological setting and management initiatives in Indonesia.

How to cite: Widanto, D. S., Sasmito, S. D., and Waltham, N.: A systematic review of the diverse values of Seagrass Contributions to People (SCP) in Indonesia: A pilot study, EGU General Assembly 2026, Vienna, Austria, 3–8 May 2026, EGU26-984, https://doi.org/10.5194/egusphere-egu26-984, 2026.

The EU Nature Restoration Regulation is the first continent-wide, comprehensive law of its kind and is a key component of the EU Biodiversity Strategy. This sets binding targets to restore degraded ecosystems, particularly those with the most potential to capture and store carbon and to prevent, and reduce, the impact of natural disasters. The EU Nature Restoration Regulation contains seven specific targets, including:

‘marine ecosystems – restoring marine habitats such as seagrass beds or sediment bottoms that deliver significant benefits, including for climate change mitigation…….’

The 800 hectares of seagrass meadows in South-West England are rightly regarded as important biodiversity ‘hot spots’, providing habitats for many species of juvenile fish, cuttlefish and sea horses. Many of the meadows in the region have been impacted by a ‘Seagrass Wasting Disease’ in the 1930s and the more recent damage caused by the anchoring of small boats (usually pleasure craft). This damage is being rectified by re-planting of seagrass, but many of those engaged in this work do not appreciate the full story behind the present distribution and development of the meadows.

The oldest seagrasses are known from the Maastrichtian of The Netherlands and are found in the Maastricht Chalk Formation (70 million years’ old). Between that time and the present day there are very few direct records of seagrass fossils, and this is because:

  • Seagrass meadows from the tidal/inter-tidal boundary are not in an environment that is commonly preserved in the geological record; and
  • In modern seagrass meadows, the plants are rarely – if ever – preserved and are rarely found in cores drilled into the meadows below ~30 cm.

In marine cores taken in Plymouth Sound and elsewhere in Southern England there are only low levels of carbon (spores, pollen, dinoflagellates, seeds, and organic debris) and not the high levels that would be required to suggest that sea grasses sequester high levels of ‘blue carbon’ for extended periods of time. The accumulation of low carbon levels can be explained by the enhanced sedimentation created by the seagrass, the so-called allochthonous carbon. The one element of carbon sequestration that is often ignored is that of foraminifera, ostracods and bryozoans, all of which are extremely abundant in meadow sediments. In many cases, the biodiversity of the foraminifera (>100 species) dwarfs the usual biodiversity counts of larger organisms. Such fixed calcium carbonate does have a long-term storage potential.

The other issue that can be ignored by those studying seagrasses is that the marine environment has undergone significant change throughout the 1 million years of the Pleistocene/Holocene and many of the seagrass meadows have only just re-established themselves following the Last Glacial Maximum, when sea levels were 120‒130 m below present-day levels. How seagrass migrated back into the present-day coastal areas is not yet fully understood, including the separation of the inter-tidal and sub-tidal taxa.

How to cite: Hart, M. and Fisher, J.: South-West England seagrasses: ecology, evolution and contribution to biodiversity and carbon sequestration , EGU General Assembly 2026, Vienna, Austria, 3–8 May 2026, EGU26-4468, https://doi.org/10.5194/egusphere-egu26-4468, 2026.

EGU26-4510 | Posters virtual | VPS6

Assessing Long-Term Flood Risk and Elevation Ordinance Comparisons Using a Web-Based Geospatial Decision Tool 

Lakshmi Prasanna Kunku, Carol J Friedland, and Rubayet Bin Mostafiz

To support resilient community planning and informed hazard mitigation decisions, having an effective flood risk evaluation is very important especially in coastal and flood prone areas. This presentation is focused on the development of an interactive web-based decision-making platform designed to analyze future flood risk and elevation ordinance impacts across five parishes in Louisiana, USA. The website allows users to explore long-term flood risk projections and ordinance related costs over multiple future decades from 2030 to 2100. The platform integrates various geospatial datasets including multi-return-period flood depth projections, decadal population forecasts, and building inventories. Flood depth raster datasets are converted from raster to point data using python and then assigned to building data obtained from Coastal Protection and Restoration Authority (CPRA) using spatial join. Then the obtained datasets are used to calculate Average Annual Loss (AAL) for different elevation ordinances. This framework incorporates a range of flood elevation ordinances, including ASCE 24-14, ASCE 24-24, and freeboard-based standards (BFE +1’, +2’, and +3’), with ordinance costs and risk outcomes by decade. ArcGIS Pro is used for spatial analysis and 3D geospatial visualization, while interactive webpages and different elevation ordinance scenario comparisons are implemented with react vita app. To improve accessibility for non-technical users, the website integrates AI-driven features that assist users in navigating the tool, interpreting results, and comparing ordinance scenarios. The platform supports hotspot analysis, side-by-side visualization of present and future flood risks, and iterative refinement through user feedback sessions. Overall, this tool provides planners, homeowners, and policymakers with a forward-looking environment to assess flood mitigation strategies, ordinance performance, and population-driven risk changes over time by combining advanced spatial analytics with interactive and user-centered design.

How to cite: Kunku, L. P., Friedland, C. J., and Mostafiz, R. B.: Assessing Long-Term Flood Risk and Elevation Ordinance Comparisons Using a Web-Based Geospatial Decision Tool, EGU General Assembly 2026, Vienna, Austria, 3–8 May 2026, EGU26-4510, https://doi.org/10.5194/egusphere-egu26-4510, 2026.

EGU26-5322 | ECS | Posters virtual | VPS6

Selective pressure of atrazine on bacterial pattern in a hypersaline lake environment  

Yolanda Espín Montoro, Gustavo Martínez Couque, José Antonio Fernández Pérez, Manuel Álvarez Ortí, and Juan José Gómez Alday

The attenuation of atrazine in the saline water of the hypersaline Pétrola lake from a natural reserve (SE Spain) was studied to get more insight into the processes governing the fate of the contaminant in highly saline environments. In microcosms, the water column was spiked with 15.4 mg/L of atrazine for 24 days. Before atrazine amendment, the initial distribution of bacterial community was mostly composed of Proteobacteria (25.5 %), Cyanobacteria (25.2 %), Actinobacteriota (18.5 %), Verrucomicrobiota (11.5 %) and Bacteroidota (10.1 %). Within the mayor phyla, the most abundant families were identified as Cyanobiaceae (25 %), Rhodobacteraceae (10 %), Alcaligenaceae (9.9 %), Microbacteriaceae (7.3 %) and a poorly described PeM15 (6.2 %).

The reduction of atrazine concentration in the water column reaches 86.9 %, which means a reduction of dissolved atrazine mass of 98.1 %. Parallel to the decrease in atrazine, the amount of its intermediate degradation metabolite, desethylatrazine, increased. Desethylatrazine was the major short-term metabolite within the first 8-12 days, indicating the potential activity by atrazine-degrading bacteria. No deisopropylatrazine was detected in the saline water above detection limit. Microbiology results showed that atrazine can be removed from the saline lake environment. After atrazine amendment, the taxonomic bacterial composition at phylum level shifted to Proteobacteria (60.8 %), Patescibacteria (9.7 %), Bacteroidota (7.3 %), Campylobacterota (6.4 %) and Actinobacteriota (2.1 %). Atrazine supplementation suggested a selective pressure on bacterial structure morphology through the emergence of different dominant groups (i.e., Campylobacterota) or even the eradication of those phyla of bacteria capable of photosynthesis (i.e., Cyanobacteria). At family level, Rhodobacteraceae (16.7 %), Burkholderiaceae (11.7 %), Thiomicrospiraceae (7.9 %), Methylophagaceae (6.7 %), Sulfurimonadaceae (4.4 %) and Solimonadaceae (3.3 %) were the most abundant in the water column at the end of the experiment.

Related atrazine-degrading families established at the end of the experiment were Rhodobacteraceae, Solimonadaceae, Pseudomonadaceae, Rhizobiaceae, Chromatiaceae, Bacillaceae, Xanthomonadaceae, Caulobacteraceae, Moraxellaceae, Streptomycetaceae, Microbacteriaceae and Nannocystaceae. Related candidates such as Pseudomonas paralactis, Microbacterium sp., or Arthrobacter sp., among others, were isolated in water samples from previous studies. The bacterial candidates for atrazine degradation identified in the water column indicate that the herbicide acted as a selective pressure factor, altering the composition of the bacterial pattern. The water column would constitute a reactive environment which may govern the fate of pesticides in saline surface water bodies.

How to cite: Espín Montoro, Y., Martínez Couque, G., Fernández Pérez, J. A., Álvarez Ortí, M., and Gómez Alday, J. J.: Selective pressure of atrazine on bacterial pattern in a hypersaline lake environment , EGU General Assembly 2026, Vienna, Austria, 3–8 May 2026, EGU26-5322, https://doi.org/10.5194/egusphere-egu26-5322, 2026.

EGU26-6116 | ECS | Posters virtual | VPS6

Spatial Variation in Sediment Bacterial Communities Along a Salinity Gradient in a Northern Gulf of Mexico Coastal Ecosystem 

Sarah G. Parker, Beau Tryzbiak, Arya Patel, Gabriel Pereira, Lisa Chambers, and Melanie Beazley

Microorganisms in estuarine and coastal ecosystems are subject to changes in salinity and nutrient loads as well as threats from emerging contaminants, sea level rise, extreme weather patterns, and human encroachment. These ecosystems are of economic and ecological importance due to their biological diversity as well as their role in carbon sequestration, flood protection, and erosion prevention. However, the microbial community structure in the sediment of estuarine systems remains under researched despite the abundant ecosystem services they provide. In this study, we surveyed 25 sites within Econfina River State Park located in the eastern portion of the Northern Gulf of Mexico along a salinity gradient from freshwater upstream to coastal seagrass beds downstream. DNA extracted from the top 10 cm of sediment were 16S rRNA amplicon sequenced to determine microbial community structure. Results contribute to the understanding of microbial ecology of coastal ecosystems in the Northern Gulf of Mexico.

How to cite: Parker, S. G., Tryzbiak, B., Patel, A., Pereira, G., Chambers, L., and Beazley, M.: Spatial Variation in Sediment Bacterial Communities Along a Salinity Gradient in a Northern Gulf of Mexico Coastal Ecosystem, EGU General Assembly 2026, Vienna, Austria, 3–8 May 2026, EGU26-6116, https://doi.org/10.5194/egusphere-egu26-6116, 2026.

EGU26-7342 | ECS | Posters virtual | VPS6

Can CO2 outgassing explain Lomagundi Excursion? 

P a Janaarthanan and Sanjeev Kumar

The Lomagundi-Jatuli event (2.3-2.0 Ga) is one of the grandest carbon isotopic (δ13Ccarbonate) excursion events in the Earth’s history, marked by anomalous δ13Ccarbonate reaching up to + 30 ‰. Several hypotheses have been proposed to explain this excursion; however, they remain inadequate due to associated drawbacks. The conventional explanation is organic carbon burial due to enhanced productivity. But, the lack of organic rich stratas synchronous with the excursion demands the reconsideration of alternative biogeochemical processes to explain this isotopic anomaly. Moreover, the excursion is observed only in the evaporitic and nearshore carbonates, with no evidence from open ocean; demanding facies based biogeochemical explanation. Here, we explore the possibility of CO2 outgassing and calcite precipitation as potential drivers responsible for this excursion as these two processes remain the least explored among the proposed hypotheses. Through sedimentological evidences from previous studies and Rayleigh fractionation calculations, we argue that dominant loss of DIC through CO2 outgassing in the evaporitic facies and calcite precipitation in the nearshore facies along with a well-mixed DIC reservoir in the open ocean led to observed Lomagundi Excursion.

How to cite: Janaarthanan, P. A. and Kumar, S.: Can CO2 outgassing explain Lomagundi Excursion?, EGU General Assembly 2026, Vienna, Austria, 3–8 May 2026, EGU26-7342, https://doi.org/10.5194/egusphere-egu26-7342, 2026.

EGU26-7609 | ECS | Posters virtual | VPS6

Atmospheric and landscape controls on fire size in tropical dry forests: insights from the South American Gran Chaco 

Rodrigo San Martín, Catherine Ottlé, Anna Sorenssön, Florent Mouillot, and Pradeebane Vaittinada Ayar

Fire is a dominant disturbance in tropical and subtropical dry forests and a major contributor to variability in carbon emissions, atmospheric composition, and land–atmosphere interactions. Despite their global extent and rapid transformation, the processes controlling fire size and extreme fire events in dry forest systems remain less understood than in savannas or humid tropical forests.

We investigated the controls on fire size using the South American Gran Chaco as a representative large-scale tropical dry forest system spanning strong climatic, ecological, and land-use gradients. We analyzed two decades (2001–2022) of satellite-derived fire patches from the FRY v2.0 burned-area database, combined with ERA5-Land meteorology and Fire Weather Index diagnostics, land-cover composition, landscape fragmentation metrics, topography, and anthropogenic pressure proxies. Our analysis focuses explicitly on fire size rather than fire occurrence, using statistical approaches and machine learning tools such as Random Forest models with SHAP-based interpretation to disentangle the relative and interacting roles of atmospheric forcing, landscape structure, and human-driven land transformation.

Our results show that fire size distributions are highly skewed across the region, with a small fraction of large and extreme events accounting for a disproportionately large share of total burned area. Wind and atmospheric dryness exert a strong influence on the final shape and size. At the same time, precipitation plays opposing roles by constraining fire spread through fuel moisture and enhancing fuel accumulation in fuel-limited environments. Landscape structure mediates the translation of meteorological extremes into large burned areas, with land-cover composition, fuel continuity, and fragmentation consistently ranking among the most influential predictors of burned area. Topography systematically emerges as the dominant predictor across subregions and seasons, acting not as a direct driver of fire spread but as an integrative proxy capturing hydrological gradients, vegetation structure, and human accessibility. Direct anthropogenic proxies show weaker importance at the event scale but exert strong indirect control through long-term land-use change and fuel reorganization, which in turn modulate fuel continuity and landscape configuration.

These results highlight tropical dry forests as a distinct fire domain where fire size emerges from coupled climate–biosphere–human interactions. By combining Earth observation fire products with explainable machine-learning approaches, this study advances understanding of fire–Earth system interactions and supports improved fire-risk assessment in rapidly transforming dry forest regions.

How to cite: San Martín, R., Ottlé, C., Sorenssön, A., Mouillot, F., and Vaittinada Ayar, P.: Atmospheric and landscape controls on fire size in tropical dry forests: insights from the South American Gran Chaco, EGU General Assembly 2026, Vienna, Austria, 3–8 May 2026, EGU26-7609, https://doi.org/10.5194/egusphere-egu26-7609, 2026.

EGU26-8273 | ECS | Posters virtual | VPS6

Magnetic Disturbances to Cetaceans in Isafjörðurdjup 

Asit Rahman

Evidence suggests cetaceans utilise magnetoreception to navigate using magnetic fields. However, disturbances in the geomagnetic field from solar storms and anthropogenic activity can lead to beachings. Previous studies indicate fluctuations around 50 nT are large enough to influence strandings. Ísafjarðardjúp is home to a large humpback whale population in the summer, but marine activity, including fish farms, vessel traffic and coastal structures such as the Bolafjall radar station, makes the fjord prone to magnetic interference, potentially intefering with magnetoreception.  

To study the extent of disruption in the marine environment, a marine magnetic survey was conducted using a proton-spin magnetometer to map magnetically unstable regions of the fjord, which coincided with frequent whale sightings. This would highlight areas of the fjord where interference with magnetoreception is likely to occur, potentially leaving cetaceans vulnerable to disorientation, which could lead to navigational errors and beaching.
 
Areas of instability that were prone to magnetic disturbances were located in the middle of the fjord near Vigur Island and at the entrance. Instability in these regions show a 0.58 point-biserial correlation coefficient for creating fluctuations of 10 to 50nT within a 7km radius of the fish farms, and creating regions of 'extreme instability' with fluctuations above 50 nT located within 5 km of the farms. Bolafjall radar station situated near the entrance of the fjord is hypothesised to be responsible for extreme disturbances fluctuating as high as 230 nT.
 
Approximately 20% of cetacean sighting hotspots overlap with these unstable regions, and instability at the entrance of the fjord can potentially cause disorientation to cetaceans attempting to enter and exit. Therefore, policies, such as shielding submarine cables and restricted use of radar in vulnerable areas, are suggested in this study to reduce the risk of cetacean strandings.

How to cite: Rahman, A.: Magnetic Disturbances to Cetaceans in Isafjörðurdjup, EGU General Assembly 2026, Vienna, Austria, 3–8 May 2026, EGU26-8273, https://doi.org/10.5194/egusphere-egu26-8273, 2026.

EGU26-12372 | ECS | Posters virtual | VPS6

From native forests to planted tree crops: disentangling tree cover transitions driven by deforestation, fire, and plantation development using satellite observations 

Rodrigo San Martín, Catherine Ottlé, Philippe Peylin, Celine Lamarche, and Florent Mouillot

Land-use change in tropical regions has profoundly altered forest structure, disturbance regimes, and recovery pathways over recent decades, with important implications for fire activity and land–atmosphere interactions. Medium-resolution global land cover products are widely used to analyze these dynamics in climate and Earth system studies, yet their capacity to distinguish native forests from planted tree crops across disturbance and recovery phases remains limited. This raises critical questions about how forest loss, recovery, and resilience are inferred from satellite-based observations in human-modified tropical landscapes.

Here, we examine how forest-to-tree-crop transitions are represented in the ESA CCI Land Cover medium-resolution land cover (MRLC) product at 300 m spatial resolution over the period 1992–2022, and how these transitions relate to fire occurrence across Southeast Asia. We combine MRLC land cover maps and land cover transition layers with a high-resolution global dataset of planted tree crops providing spatial extent and year of establishment (Descals et al., 2024), together with fire information from FireCCI v5.1 at 250 m resolution (2001–2022) and fire polygon data from FRY v2.0. This integrated framework allows us to place land-cover changes associated with plantation establishment and maturation in the context of disturbance–recovery processes.

Our analysis focuses on land cover trajectories from native evergreen broadleaf forest to mosaic classes during plantation establishment, followed by reclassification to broadleaf tree cover as plantations mature. We examine the timing and duration of these transitions and their association with fire occurrence during land-use change. Preliminary results show systematic patterns in which oil palm expansion is linked to transient forest loss and elevated fire activity during early plantation stages, followed by reduced fire occurrence as plantations develop before being mapped again as tree cover.

These results demonstrate that confusion between native forests and planted tree crops in medium-resolution land cover products can lead to misleading interpretations of post-disturbance recovery and forest resilience. In particular, apparent forest recovery detected by satellite products may in some cases reflect a land-use replacement rather than true ecosystem recovery with important implications for the interpretation of disturbance–recovery dynamics, as well as for climate modeling and projections in human-modified tropical landscapes. This highlights the need for complementary high-resolution land cover information, such as that developed within the ESA CCI High Resolution Land Cover (HRLC) project, to better disentangle recovery from land-use change.

How to cite: San Martín, R., Ottlé, C., Peylin, P., Lamarche, C., and Mouillot, F.: From native forests to planted tree crops: disentangling tree cover transitions driven by deforestation, fire, and plantation development using satellite observations, EGU General Assembly 2026, Vienna, Austria, 3–8 May 2026, EGU26-12372, https://doi.org/10.5194/egusphere-egu26-12372, 2026.

EGU26-12474 | ECS | Posters virtual | VPS6

Beyond Static Fluxes: Constraining parameters of a wetland methane model in a new fully coupled CH4DAS using Satellite Concentrations and In-Situ Fluxes 

Rajarajan Vetriselvan, Peter Rayner, Antoine Berchet, Philippe Peylin, Elodie Salmon, Marielle Saunois, Juliette Bernard, and Alka Singh

Methane emissions from natural wetlands are the largest and most uncertain component in the global methane budget. Conventionally they are estimated using two main methods. Top-Down methods work by inverting atmospheric concentrations of methane into fluxes, using a chemistry transport model. This is often done by optimizing the scaling factors of the inventory flux maps, but this approach decouples the fluxes from their physics and has limited predictive capabilities. Conversely, Bottom-up methods use biogeochemical models to directly estimate the fluxes, but they are severely affected by the scarcity of in-situ flux observations to calibrate them. To bridge this gap, we present the development and validation of a new fully coupled Methane Data Assimilation System (CH4DAS). This system integrates these two techniques, and provides constraints to the bottom-up model (ie., optimizing its main parameters) from both satellite concentrations and site-level fluxes. Such integration ensures that flux estimates remain consistent with physical drivers, simultaneously addressing data scarcity and enabling predictive capability.

CH4DAS is developed within the Community Inversion Framework (Berchet et al., 2021) and couples SatWetCH4 (Bernard et al., 2025), a simple bottom-up wetland methane model with the LMDz-SACS chemistry-transport model. This system can simultaneously assimilate both satellite concentrations (GOSAT) and site-level in-situ fluxes (FLUXNET-CH4) within a variational assimilation scheme to constrain the model parameters. To address the scale challenges while simultaneously assimilating observations of different streams, we run two instances of SatWetCH4. The first, driven by global forcing is coupled with LMDz-SACS and constrained by Satellite observations. While the second instance driven by site-level forcing is constrained by in-situ fluxes. This way, the shared internal temperature sensitivity parameter Q100 is jointly constrained by two data streams, while site-level and regional base rate parameter K account for data-specific variability.

We mathematically validate the system using an Identical Twin Observing System Simulation Experiment (OSSE), demonstrating its capacity to constrain the control variables. Further, we apply the system to real-world data to demonstrate that the system can successfully reduce the mismatches in the prior to match the spatiotemporal gradients observed by GOSAT, enabling insights on regional CH4 budgets.

How to cite: Vetriselvan, R., Rayner, P., Berchet, A., Peylin, P., Salmon, E., Saunois, M., Bernard, J., and Singh, A.: Beyond Static Fluxes: Constraining parameters of a wetland methane model in a new fully coupled CH4DAS using Satellite Concentrations and In-Situ Fluxes, EGU General Assembly 2026, Vienna, Austria, 3–8 May 2026, EGU26-12474, https://doi.org/10.5194/egusphere-egu26-12474, 2026.

EGU26-14745 | Posters virtual | VPS6

Mapping Global Carbon Flux in Species across Terrestrial Biomes Under Climate Extremes 

Shakirudeen Lawal and Wayne Stewarts

Terrestrial ecosystems currently absorb a substantial proportion of anthropogenic carbon dioxide (CO₂) emissions, yet the persistence of this land carbon sink under accelerating climate change remains largely uncertain. While process-based vegetation models project continued enhancement of carbon uptake through CO₂ fertilization, there are growing observational evidence that suggests that climate extremes, particularly 3oC global warming level, may substantially constrain or reverse these gains through droughts and heatwaves. Recent global carbon budget assessments also show a rapid weakening of the land carbon sink, with dynamic global vegetation model ensembles and atmospheric inversions indicating a large decline in net land uptake between 2022 and 2023. Here we present an observation-constrained, species-specific quantification of global terrestrial carbon fluxes across major terrestrial biomes. We integrate a combination of satellite-derived vegetation indices, a geo-referenced global database of climate-induced tree mortality, and dynamic global vegetation models from the TRENDY intercomparison models to map spatial and temporal variability in carbon uptake, storage, and loss under historical and future climate conditions. Model simulations are forced with regionally downscaled climate projections and explicitly constrained using observed mortality signals to quantify the effects of CO₂ fertilization. Our results reveal a widespread divergence between modelled and observation-constrained carbon fluxes, with some biomes exhibiting a reduced carbon sink. Species adapted to moderately moist climate conditions show strong sink-to-source transitions, while drought-tolerant species exhibit greater resilience but limited long-term sequestration capacity. These findings demonstrate that climate extremes impose substantial limits on terrestrial carbon sequestration. By linking species-level ecological responses with carbon flux dynamics, our study provides a more realistic assessment of the future role of terrestrial ecosystems in regulating the global carbon cycle under ongoing climate change, as well as show species and regions for optimal sequestration.

Key words: Carbon Flux, Carbon Dioxide Removal, Biomes, Dynamic Vegetation Models, Drought, Heatwave

How to cite: Lawal, S. and Stewarts, W.: Mapping Global Carbon Flux in Species across Terrestrial Biomes Under Climate Extremes, EGU General Assembly 2026, Vienna, Austria, 3–8 May 2026, EGU26-14745, https://doi.org/10.5194/egusphere-egu26-14745, 2026.

EGU26-14857 | ECS | Posters virtual | VPS6

Canada’s forests shifting from a recovery-driven carbon sink to a disturbance-driven carbon source 

Salvatore Curasi, Joe Melton, Elyn Humphreys, Vivek Arora, Jason Beaver, Alex Cannon, Jing Chen, Txomin Hermosilla, Sung-Ching Lee, and Michael Wulder

Canada’s terrestrial ecosystems play a critical role in the global carbon cycle and are being affected by unprecedented climate change and wildfire disturbance. However, we have an incomplete understanding of Canada’s historical carbon cycle. Existing assessments, conducted at varying spatial scales, use a wide range of data sources and methodologies, which lead to significant differences in the estimated strength of Canada’s land carbon sink over recent decades. Moreover, many approaches (e.g., inversions and data-driven estimates) have a limited ability to disentangle the relative contributions of different processes to the carbon sink over the recent past (1700 - 2022). We addressed this gap using a land surface model recently tailored to Canada and the most comprehensive information depicting wildfire disturbance and timber harvest available to make, to our knowledge, the first physically coherent wall-to-wall estimates of all major carbon pools and fluxes for Canada. We show that Canada’s terrestrial ecosystems have been a carbon sink since the mid-20th-century, due to the influence of wildfire and timber harvest before 1940. Since the early 2000s, wildfire disturbance has been driving Canadian forests towards becoming a carbon source. Based on our findings from a purely process-oriented perspective, projected increases in wildfire activity will further impact the strength and direction of Canada's terrestrial carbon sink.

How to cite: Curasi, S., Melton, J., Humphreys, E., Arora, V., Beaver, J., Cannon, A., Chen, J., Hermosilla, T., Lee, S.-C., and Wulder, M.: Canada’s forests shifting from a recovery-driven carbon sink to a disturbance-driven carbon source, EGU General Assembly 2026, Vienna, Austria, 3–8 May 2026, EGU26-14857, https://doi.org/10.5194/egusphere-egu26-14857, 2026.

EGU26-15259 | ECS | Posters virtual | VPS6

Landward Migration of Coastal Wetlands under Land-Use Constraints in Australia 

Nipuni Perera, Melissa Wartman, Siegmund Nuyt, Peter Macreadie, and Micheli Duarte de Paula Costa

Sea level rise (SLR) is a key driver in altering spatial boundaries, species distribution, and functioning of coastal wetlands in the 21st century. Wetland adaptation to SLR depends on vertical accretion and landward migration; however, the magnitude and rate of these processes remain uncertain and are constrained by factors such as sediment supply and the availability of inland accommodation space. To enhance adaptive capacity, spatially explicit assessments are critical for identifying areas suitable for wetland migration. Nevertheless, much of the existing literature emphasises global-scale analyses with coarse spatial resolution and limited use of local SLR projections, which reduces their applicability for regional and local decision-making.

We conducted a scenario-based assessment of the potential extent of landward migration for mangroves and saltmarshes in Victoria, Australia, using high-resolution (10 m) regional spatial data under two socio-economic pathways (SSP2 and SSP5) for 2070 and 2090. The results indicate that, for both ecosystems, potential area gains from landward migration exceed losses from seaward inundation. For saltmarshes, ecosystem losses are driven more by mangrove encroachment (53%) than by inundation (47%). Land tenure emerges as a key factor shaping wetland migration capacity. Future accommodation space for mangroves is largely under public ownership (56%), primarily within protected areas and nature reserves (56.2%), providing a relatively secure buffer for inland migration. In contrast, most accommodation space for saltmarshes is privately owned (56.4%) and predominantly associated with primary production land use (45.4%). Without specific management actions, saltmarshes are likely to experience losses from both expanding mangroves and ongoing land-use pressures. Overall, these findings provide valuable insights to support stakeholders in scenario-based planning and the management of coastal and urban areas to enable wetland adaptation to rising sea levels.

How to cite: Perera, N., Wartman, M., Nuyt, S., Macreadie, P., and Duarte de Paula Costa, M.: Landward Migration of Coastal Wetlands under Land-Use Constraints in Australia, EGU General Assembly 2026, Vienna, Austria, 3–8 May 2026, EGU26-15259, https://doi.org/10.5194/egusphere-egu26-15259, 2026.

EGU26-15541 | ECS | Posters virtual | VPS6

Constructing a Multi-Scale Urban Cooling Island Ventilation Network to Mitigate the Urban Heat Island Effect: A Case Study of Changsha, China 

Xingfa Zhong, Baojing Wei, Luyun Liu, and Yijia Huang

         To address the intensifying urban heat island (UHI) effect driving by rapid urbanization, current research reveals a significant scale discontinuity between macro-level strategies, such as regional cooling network design, and micro-level studies that focus on localized cooling mechanisms of individual green patches. Macro-scale approaches often overlook small cooling islands embedded within dense urban fabrics, while micro-scale investigations lack systematic understanding of inter-patch connectivity. This study proposes a multi-scale cooling island ventilation network to synergistically mitigate UHI impacts across spatial hierarchies. Using the core area of Changsha City as a case study, the research introduces an innovative three-tier scale classification framework incorporating building density. By integrating relative land surface temperature and morphological spatial pattern analysis, the study identifies core cold island sources. Further, a cold island ventilation resistance surface is constructed using the CRITIC objective weighting method, enabling the identification of key nodes and corridors for establishing a comprehensive multi-scale ventilation network. Findings reveal that, amidst urban expansion and increasing building/road densities, landscape fragmentation has led to a “shrinking-in-size, growing-in-number” trend for both primary and secondary cold island sources. From 2009 to 2016, the total area of primary-scale cold sources declined sharply from 45 km² to 19.8 km², while their number rose from 130 to 151. The average patch size fell from 0.35 km² to 0.07 km², and the minimum temperature increased from 28.7 °C to 35.3 °C-signaling a depletion risk. Similarly, secondary cold sources shrank from 215.38 km² to 144.83 km², as their number increased from 123 to 169, with average patch size dropping from 1.75 km² to 0.86 km²-weakening their thermal buffering capacity. Despite this, ventilation corridors peaked in 2020, totaling 371 in number and 528.5 km in length, continuing to act as "relay stations" transmitting peripheral cooling effects to the urban core. Notably, tertiary cold sources rebounded after 2016 due to strengthened ecological conservation efforts, expanding by 237.5 km² by 2020. Their temperatures stabilized between 35–38 °C—significantly cooler than the urban core—demonstrating sustained cooling potential. Policy recommendations are proposed across three spatial scales: 1) primary scale, remove obstructions at cold source points to broaden cooling supply channels; 2) secondary scale: prioritize the protection of key corridors and junctions to preserve inter-patch connectivity and maintain dynamic cold air flow; 3) tertiary scale: safeguard and enhance core ecological areas to ensure stable and continuous cooling output. By identifying cold island sources and constructing a multi-scale ventilation network, this study offers a science-based framework for optimizing thermal environments in high-density urban areas.

Graphical Abstract

How to cite: Zhong, X., Wei, B., Liu, L., and Huang, Y.: Constructing a Multi-Scale Urban Cooling Island Ventilation Network to Mitigate the Urban Heat Island Effect: A Case Study of Changsha, China, EGU General Assembly 2026, Vienna, Austria, 3–8 May 2026, EGU26-15541, https://doi.org/10.5194/egusphere-egu26-15541, 2026.

EGU26-16516 | Posters virtual | VPS6

Advancing Ecohydrological Modelling with Coupled ParFlow-LPJ-GUESS: Role of Lateral Flow in Vegetation and Hydrology Simulations 

Zitong Jia, Yongshuo H. Fu, Shouzhi Chen, and Jing Tang

Climate change accelerates the global hydrological cycle, which has escalating impacts on human health and the socioeconomic development. However, many existing Earth system models neglect the more complex processes of topography-driven vegetation-surface-groundwater interactions, thereby failing to accurately capture climate-hydrological responses. To address this gap, we integrate the three-dimensional surface-subsurface hydrological model ParFlow with the dynamic global vegetation model LPJ-GUESS to investigate how lateral groundwater flow and vegetation dynamics jointly regulate hydrological fluxes. The fully coupled ParFlow-LPJ-GUESS (PF-LPJG) model (with and without lateral flow) and stand-alone LPJ-GUESS model were used to run hydrological simulations over a 38-year period at a resolution of 10 km across the Danube River Basin. The results demonstrate that the PF-LPJG model substantially improves streamflow and surface soil moisture simulations without requiring parameter calibration compared to stand-alone LPJ-GUESS, mitigates the underestimation of summer low flows during dry years, increases the accuracy of peak flow timing in wet years, and achieves a Kling-Gupta Efficiency (KGE) > 0.5 and Spearman’s ρ > 0.80 at over 80 % of gauging stations. Seasonal soil moisture anomalies are better captured (R = 0.51) compared to satellite-based products. Additionally, the modelled WTD agrees well with in-situ monitoring-well data, as indicated by a low RSR value (~1.31). Notably, the coupled model improves the representation of bare-soil evaporation and reduces transpiration-to-evaporation (T/E) ratio fluctuations, aligning more closely with the GLEAM v4.2 product. Sensitivity analysis reveals that shallow-rooted vegetation exhibits strong decreases in LAI and AET when lateral flow is removed, while slightly increasing LAI and AET in deep-rooted regions. The coupled model PF-LPJG entails a mechanistic framework for capturing bidirectional interactions among surface-subsurface water, vegetation dynamics and ecosystem biogeochemical processes, which can be applied to other catchments or climatic conditions to deeply analyze climate-induced modification on vegetation-water-carbon interactions. Future work will focus on how the lateral flow affects vegetation greening under different climatic conditions.

How to cite: Jia, Z., Fu, Y. H., Chen, S., and Tang, J.: Advancing Ecohydrological Modelling with Coupled ParFlow-LPJ-GUESS: Role of Lateral Flow in Vegetation and Hydrology Simulations, EGU General Assembly 2026, Vienna, Austria, 3–8 May 2026, EGU26-16516, https://doi.org/10.5194/egusphere-egu26-16516, 2026.

EGU26-16743 | ECS | Posters virtual | VPS6

Restoring Mediterranean holm oak forests: ecosystem functioning and climate mitigation in the LIFE RECLOAK project 

antonella gori, sara beltrami, francesca alderotti, francesco ferrini, camilla dibari, roberto ferrise, donatella paffetti, and cecilia brunetti

Mediterranean forest ecosystems are currently facing severe challenges due to the combined pressures of biotic and abiotic stressors. In particular, Holm oak (Quercus ilex L.) forests are experiencing a widespread decline driven by the effects of climate change-induced drought and the aggression of the soil pathogen Phytophthora cinnamomi. This decline threatens not only forest biodiversity but also the stability of essential ecosystem services. In response to this problem, the LIFE RECLOAK project aims to restore and improve the conservation status of these threatened habitats. The project adopts an approach involving the genetic selection of drought-tolerant and pathogen-resistant genotypes, their micropropagation, and subsequent planting in pilot sites across Italy, Spain, and Malta. Within this framework, Work Package 7 (WP7) is dedicated to the "Evaluation of ecosystem functioning and climate mitigation effects," validating the success of the reforestation efforts. Therefore, the primary objective of WP7 is to quantify the restoration of ecosystem processes and the enhancement of climate change mitigation potential provided by the selected resistant genotypes compared to traditional forest stock.

The activities of WP7 integrate field monitoring and modelling tasks. Firstly, the project will assess vegetation growth and biodiversity. In the pilot sites, key morphological parameters of Q. ilex (such as Basal Diameter (BD), Plant Height (PH), and Leaf Area Index (LAI)) will be measured annually to track biomass accumulation. Concurrently, biodiversity indexes (BI) will be calculated to monitor the recovery of understory vegetation. To evaluate the restoration of below-ground processes, soil quality will be assessed through measurements of soil respiration, Soil Organic Carbon (SOC), erosion rates, and Water Holding Capacity (WHC). Recognizing the slow growth rate of holm oaks, these monitoring activities are planned to continue for ten years after the project's conclusion, ensuring a long-term perspective on ecosystem recovery. Data collected from vegetation and soil monitoring will be used for the assessment of carbon sequestration, calculating the CO2 absorbed by both the woody biomass and the soil compartment. WP7 will also develop a monitoring tool using the Biome-BGC Musso ecohydrological model. By integrating site-specific pedoclimatic data with the physiological traits of the resistant genotypes, this model will be calibrated to simulate carbon and water pathways (e.g., Water Use Efficiency) over the plantation's lifespan. This approach quantifies the added value of the resistant genotypes, demonstrating their superior resilience under changing environmental and management conditions.

Finally, under the coordination of the Democritus University of Thrace, WP7 will integrate these findings to analyze broader Ecosystem Services (ES), including provisioning, regulating, and supporting functions. Ultimately, by validating biological indicators and establishing a robust carbon monitoring protocol, WP7 will demonstrate the effectiveness of using improved genotypes, offering a replicable model for restoring Mediterranean areas affected by forest dieback.


How to cite: gori, A., beltrami, S., alderotti, F., ferrini, F., dibari, C., ferrise, R., paffetti, D., and brunetti, C.: Restoring Mediterranean holm oak forests: ecosystem functioning and climate mitigation in the LIFE RECLOAK project, EGU General Assembly 2026, Vienna, Austria, 3–8 May 2026, EGU26-16743, https://doi.org/10.5194/egusphere-egu26-16743, 2026.

EGU26-16835 | ECS | Posters virtual | VPS6

Assessing the Impacts of Water Bodies Encroachment on Urban Land Surface Temperature 

M Niranjan Naik and Vimal Mishra

Water bodies play a crucial role in controlling urban heat by acting as a sink and enhancing evaporative cooling. However, rapid urbanisation in India has led to the progressive encroachment and shrinkage of water bodies, which threatens the urban thermal environment. In this study, we investigate the impact of urban water body encroachment on surrounding temperature using multidecadal Landsat-derived land surface temperature (LST) data at 30 m spatial resolution and water body datasets. The LST of Water bodies and surrounding urban areas within their vicinity are estimated to assess spatiotemporal changes in LST. Our results reveal a substantial increase in LST in urban regions surrounding water bodies in recent decades, indicating a decline in their local cooling effectiveness. Furthermore, encroached water bodies exhibit a pronounced rise in surface water temperature than non-encroached water bodies. The warming of both water surfaces and adjacent urban areas highlights the compound thermal impacts of water body encroachment. The findings indicate that the loss of urban water bodies due to encroachments contributes to the warming of urban areas. The study underscores the importance of protecting and restoring urban water bodies as effective nature-based solutions for mitigating rising urban temperatures and enhancing climate resilience in rapidly growing urban cities.

How to cite: Naik, M. N. and Mishra, V.: Assessing the Impacts of Water Bodies Encroachment on Urban Land Surface Temperature, EGU General Assembly 2026, Vienna, Austria, 3–8 May 2026, EGU26-16835, https://doi.org/10.5194/egusphere-egu26-16835, 2026.

EGU26-17838 | ECS | Posters virtual | VPS6

Research progress on magnetotactic bacteria under high magnetic field 

Junfeng Wang and Kun Ma

Magnetotactic bacteria (MTB) are an ancient microbial lineage that navigate geomagnetic field lines via intracellular magnetosomes, and their unique multi-disciplinary properties have long drawn research attention. This study focuses on MTB’s behavioral and metabolic adaptations under high magnetic fields—including extreme environments six orders of magnitude stronger than the geomagnetic field—and explores their application potential.Our recent progress is outlined as follows: 1) Using Magnetospirillum gryphiswaldense MSR-1 as the model strain, we analyzed how high magnetic fields reprogram MTB metabolism, modulate biomineralization dynamics, and impact MmaK scaffold assembly as well as magnetofossil genesis.2) We clarified the regulatory role of MTB-derived Mms6 protein in biomineralization, and synthesized magnetosome-mimetic nanocrystals in vitro that match natural magnetosomes in cuboctahedral morphology, soft ferromagnetic behavior, and high saturation magnetization. 3) We built a magnetic nanorobot-based navigation system to realize precise spatial control and trajectory planning of MTB, paving new ways for MTB-mediated nanodrug delivery and magnetic navigation.

References

[1] WAN, Hengjia, et al. Assembly dynamics of magnetotactic bacterial actin-like protein MamK under shielded geomagnetic fields: In vitro evidence of inhibited filament formation. International Journal of Biological Macromolecules, 2025, 320: 145863.

[2] Tao, Tongxiang, et al. "Boosting SARS-CoV-2 enrichment with ultrasmall immunomagnetic beads featuring superior magnetic moment." Analytical Chemistry 95.30 (2023): 11542-11549.

[3] Ma, Kun, et al. "Magnetosome-inspired synthesis of soft ferrimagnetic nanoparticles for magnetic tumor targeting." Proceedings of the National Academy of Sciences 119.45 (2022): e2211228119.

[4] TAO, Tongxiang, et al. A Precise BSA Protein Template Developed the C, N, S Co-Doped Fe3O4 Nanolayers as Anodes for Efficient Lithium-Ion Batteries. ACS Applied Energy Materials, 2022, 5.8: 10254-10263..

How to cite: Wang, J. and Ma, K.: Research progress on magnetotactic bacteria under high magnetic field, EGU General Assembly 2026, Vienna, Austria, 3–8 May 2026, EGU26-17838, https://doi.org/10.5194/egusphere-egu26-17838, 2026.

Tropical forests provide vital ecological, economic, cultural and climate-regulating services to local and global communities. However, these ecosystems are threatened by deforestation, often driven by complex and region-specific factors. Numerous studies have been conducted to predict the spatial distribution of deforestation risk, yet little research has explored the possible advantages of predicting deforestation intensity patterns. To support more effective forest management and conservation planning, this study examines the use of deep learning for predicting the spatial patterns of deforestation intensity.

This research develops and evaluates a regression-based ResUNet architecture for predicting deforestation intensity patterns. 
The deforestation datasets are, in most cases, highly skewed and zero-dominated, which poses the first challenge since this can significantly affect the predictive performance of the regression model. Several loss functions have been evaluated to mitigate this effect. The results illustrate how the Tweedie loss performs best. Furthermore, with a Root Mean Squared Error (RMSE) of 0.00494 on all values and 0.0169 on non-zero values, the Tweedie ResUnet model consistently outperforms the baseline XGBoost regression model. 

To test the model's cross-regional generalizability, four tropical regions were selected, each located on a different continent and characterised by varying deforestation drivers and dynamics. The Tweedie-ResUNet architecture was trained and tested on each study area. The differences in performance could be explained by regional characteristics such as data quality, topography, and seasonal cloud cover. However, the results still demonstrate a strong potential for the model's applicability to other tropical regions. 

The overall findings of this study suggest that deep learning models can be utilised to offer valuable insight into spatial patterns of deforestation intensity. 

How to cite: Sillem, K. and Cue la rosa, L.: Beyond Risk: Predicting Tropical Deforestation Intensity Patterns with Regression-Based Fully Convolutional Neural Networks, EGU General Assembly 2026, Vienna, Austria, 3–8 May 2026, EGU26-18862, https://doi.org/10.5194/egusphere-egu26-18862, 2026.

EGU26-21475 | ECS | Posters virtual | VPS6

Drought resilience and fruit performance in strawberry tree (Arbutus unedo L.) populations: ecophysiological screening and postharvest behaviour  

Giovanni Pascucci, Francesca Alderotti, Ermes Lo Piccolo, Sara Beltrami, Cassandra Detti, Andrea Baptista, Valeria Palchetti, Lorenzo Bini, Francesco Ferrini, Maria Dulce Antunes, Edgardo Giordani, Cecilia Brunetti, and Antonella Gori

Climate change is increasing the frequency and intensity of drought and heat events in Mediterranean regions, urging the need for resilient fruit crops that link stress tolerance to relevant fruit quality traits. My PhD project focuses on the strawberry tree (Arbutus unedo L.), an underutilised Mediterranean evergreen fruit species of considerable ecological relevance in Southern Europe, with a recognised capacity to cope with diverse abiotic and biotic constraints. The project objective is to characterise six Italian A. unedo populations in terms of physiological performance under water-limited conditions and fruit quality characteristics. The primary step is to select provenances with contrasting pedoclimatic characteristics and to use calculated climatic indices (e.g., Emberger’s Q2) across an aridity–temperature gradient. These provenances are then screened for constitutive traits under well-watered conditions combining measurements of xylem vulnerability to embolism formation (P50), water-use strategy (e.g., minimum epidermal conductance, gmin; specific leaf area, SLA), and cellular drought tolerance derived from pressure–volume analysis (turgor loss point, TLP; osmotic potential at full turgor, π₀; and modulus of elasticity, ε).  After that, inducible trait modifications are tested under water stress and recovery conditions, monitoring gas exchange, plant water relations, chlorophyll fluorescence parameters, hydraulic resistance, and growth. In parallel,  a core component of the work investigates fruit physiological performance across different ripening stages (identified by skin colour) and during post-harvest storage. Fruits, harvested at the yellow–orange stage, are analysed for respiratory activity using a custom fruit chamber coupled to a LI-COR 6800 system. Post-harvest dynamics are monitored under two storage treatments (ambient temperature vs. 4 °C) and related to quality attributes, including colour development, soluble solids (°Brix), firmness, weight loss, pectin content, sugar profile, and polyphenol-related traits. Within this post-harvest study, the project also considers the use of edible coatings as a practical tool to modulate storage techniques and help preserve the quality attributes of this perishable fruit. Therefore, integrating provenance screening with fruit respiration and post-harvest physiology provides a practical basis for selecting A. unedo genotypes with improved drought resilience and high fruit yield and quality, thereby fostering A. unedo cultivation in Mediterranean areas under a changing climate.


How to cite: Pascucci, G., Alderotti, F., Lo Piccolo, E., Beltrami, S., Detti, C., Baptista, A., Palchetti, V., Bini, L., Ferrini, F., Antunes, M. D., Giordani, E., Brunetti, C., and Gori, A.: Drought resilience and fruit performance in strawberry tree (Arbutus unedo L.) populations: ecophysiological screening and postharvest behaviour , EGU General Assembly 2026, Vienna, Austria, 3–8 May 2026, EGU26-21475, https://doi.org/10.5194/egusphere-egu26-21475, 2026.

EGU26-22143 | Posters virtual | VPS6

Alleviating Biocrust Blindness: An Easy Guide to Morphogroups of Biocrusts  

Lea Condon, Carrie Barker, and Peter Coates

Biological soil crusts (biocrusts) are increasingly recognized as important components of ecosystems. Biocrusts are instrumental in maintaining functions such as soil stability and reduced abundance of invasive annual grasses. Impacts of fire are likely to be less severe where invasive plants are reduced and biocrusts are abundant. These organisms can thrive under drought conditions and help intact ecosystems be more resilient to drought. However, expertise on these organisms remains limited.  Practitioners are often interested in the topic but might feel they would benefit from additional resources on how to identify these organisms. We have developed a single-page, front and back guide that enables anyone, regardless of previous experience, to recognize biocrusts in the field and categorize them into ecologically meaningful groups, with known functional roles. The guide has been tested both in the field and by examining biocrust samples in hand. Data associated with testing the guide was used to improve it. The resulting guide describes higher-level groups of algae, mosses, and lichens. Light algal crusts are described as their own group. Dark algal crusts are presented with gelatinous lichens due to similar ecologies and increased accuracy of identification when these groups are combined. The determination of algal crusts was accepted as correct, regardless of the light or dark designation, due to the quality of our samples. Mosses are split into short and tall. In addition to the gelatinous lichens / dark algal crust group, lichens were classified into five additional categories: crustose, cup, foliose, fruticose, and scale. This tool has been created from the ground up, driven largely by the accuracy with which non-experts can correctly classify presented groups. In addition to reporting on the accuracy of each group, we explain how sample type (resin, dried and in petri dishes, or enlarged photographs) played a role in the accuracy of identification. We describe the ecology and functional roles of the presented groups, giving further justification for their classification. We anticipate that adoption of the guide is likely to have far-reaching implications, such as an increase in the number of studies on biocrusts at the level of functional roles. 

How to cite: Condon, L., Barker, C., and Coates, P.: Alleviating Biocrust Blindness: An Easy Guide to Morphogroups of Biocrusts , EGU General Assembly 2026, Vienna, Austria, 3–8 May 2026, EGU26-22143, https://doi.org/10.5194/egusphere-egu26-22143, 2026.

Mesozoic Oceanic Anoxic Events (OAEs) are critical geological episodes linked to global carbon cycle perturbations, climate warming, and ecosystem restructuring. However, the regional expression of OAEs in the eastern Tethys remains insufficiently constrained. This study focuses on the Early Jurassic Toarcian OAE (T-OAE)—integrating petrological, mineralogical, and geochemical analyses of two key sections to reconstruct Early Jurassic sedimentary evolution, paleoclimate-paleoenvironment dynamics, and their responses to the T-OAE. Pronounced negative carbon isotope excursions (CIEs) are recorded in both marine strata, correlatable with global T-OAE records. Intensified continental chemical weathering  and enhanced terrigenous detrital input are common responses of the eastern Tethys to T-OAE, driven by global warming. Redox proxies reveal oxic-suboxic conditions in open marine settings of the eastern Tethys during OAEs, regulated by regional factors (water depth, basin restriction, freshwater input), contrasting with the anoxic-euxinic environments in the western Tethys. Bioproductivity showed spatial heterogeneity: organic matter accumulation was controlled by redox conditions and productivity, with high accumulation in restricted lagoons versus low-moderate in open shelves.

This study reveals the regional response patterns of the eastern Tethys to Mesozoic OAEs, highlighting the spatial heterogeneity of redox and productivity dynamics, and provides new insights into the Mesozoic climate-ocean-biosphere system.

How to cite: Yi, J. and Fu, X.: Sedimentary Environment Evolution and Response to Mesozoic Toarcian Oceanic Anoxic Event (T-OAE) in the Eastern Tethys, EGU General Assembly 2026, Vienna, Austria, 3–8 May 2026, EGU26-279, https://doi.org/10.5194/egusphere-egu26-279, 2026.

EGU26-633 | ECS | Posters virtual | VPS7

Microbially Induced Sedimentary Structures in a Mesoproterozoic Erg System: A Case Study from the Mangabeira Formation, Brazil 

Amanda Feitosa, Manoela Bállico, Ezequiel Souza, Claiton Scherer, Flávia Callefo, Vanessa Balbinot, Gustavo Tatsch, Elder Yokoyama, Amanda Leite, Adriano Reis, Sebastião Silva, and Alexandre Santos

Microbially Induced Sedimentary Structures (MISS) are syndepositional primary structures that occur both in some of the earliest forms of life and in modern environments. Throughout geological time, microorganisms developed metabolic strategies that enabled their establishment and proliferation in a wide range of settings, including arid environments such as deserts. However, MISS are widely recognized in tidal flats and other shallow-marine environments, whereas examples preserved in continental deposits remain comparatively scarce. A comprehensive review of Precambrian MISS occurrences indicates a notable expansion of documented records during the Mesoproterozoic, coincident with the assembly of the Columbia supercontinent and a concurrent rise in atmospheric oxygenation. These global transitions may have promoted the ecological diversification of microbial communities and facilitated their dispersal into progressively drier continental interiors. Under favorable conditions, microorganisms proliferate and form microbial mats that interact with external factors such as sedimentation, currents, erosional processes, and other physical drivers. Their presence in arid terrestrial deposits is thus of considerable importance, as it underscores how microbial communities evolved and developed adaptive capabilities that enabled them to colonize and persist within intermittently wet landscapes subjected to elevated environmental stress. This study documents the occurrence of MISS within continental desert depositional systems of the Mangabeira Formation, São Francisco Craton, Brazil (1.6 Ga), preserved in wet sandsheet deposits. These occurrences broaden the sparse record of MISS in Proterozoic desert environments and offer new constraints on the capacity of early microbial communities to endure highly stressful and intermittently wet conditions. To investigate the conditions that enabled microbial establishment in this ancient desert, this study applies a multi-method approach integrating sedimentological, stratigraphic, petrographic, and microtextural datasets. The vertical succession reveals six distinct drying-upward cycles, each associated with fluctuations in groundwater level that periodically generated stable, moisture-rich surfaces suitable for microbial mat development. Within these intervals, MISS occur in millimetric heterolithic laminites displaying wavy–crinkly lamination, wrinkle marks, roll-up structures, deformational features, authigenic minerals with convolute morphologies, trapped grains, and organic carbon remnants. Complementary Raman analyses reveal characteristic carbonaceous peaks (at ~1370, 1590, and 1610 cm⁻¹), confirming the presence of organic carbon and kerogen. Collectively, the integrated dataset indicates that microbial colonization in the Mangabeira Formation was episodically favored by groundwater-controlled moisture stability, which enhanced substrate cohesion and enabled the formation of distinctive biosedimentary fabrics. These findings, contextualized within the broader Mesoproterozoic expansion of MISS, highlight the capacity of early microbial communities to establish themselves in hydrologically stressed desert landscapes and refine the sedimentological and geochemical criteria necessary for recognizing MISS in deep-time continental systems.

How to cite: Feitosa, A., Bállico, M., Souza, E., Scherer, C., Callefo, F., Balbinot, V., Tatsch, G., Yokoyama, E., Leite, A., Reis, A., Silva, S., and Santos, A.: Microbially Induced Sedimentary Structures in a Mesoproterozoic Erg System: A Case Study from the Mangabeira Formation, Brazil, EGU General Assembly 2026, Vienna, Austria, 3–8 May 2026, EGU26-633, https://doi.org/10.5194/egusphere-egu26-633, 2026.

EGU26-1007 | ECS | Posters virtual | VPS7

Uncovering Causal Pathways of Agricultural Droughts using Climate and Vegetation Signals 

Hempushpa Sahu, Pradeep Kumar Garg, Saurabh Vijay, and Antara Dasgupta

The impacts of climate change are directly visible in the intensification and increasing frequency of extreme climate events, such as floods and droughts. Since droughts result from complex, multivariate, and non-linear land-atmosphere interactions, understanding these relationships is crucial for developing impactful future measures to reduce or mitigate drought impacts. Many studies have performed correlation analysis among these variables, but (1) correlation does not fully resolve causality and complexity of drought occurrence, due to which (2) the nonlinear behavior of drought propagation remains poorly understood. This study applies conditional independence tests, such as the Peter and Clark Momentary Conditional Independence algorithm (PCMCI+), to identify and analyze the causal drivers of drought at different lag periods using multivariate time series data. We investigated the influence of seven important variables for drought incidences on drought-induced vegetation responses in the drought-prone Bundelkhand region of Central India as well as its seven districts (Banda, Chitrakoot, Hamirpur, Jalaun, Jhansi, Lalitpur, Mahoba) separately. We used ERA-5 land monthly data at 0.1˚ spatial resolution for climatic variables, including precipitation, temperature, evaporation, relative humidity, soil moisture, and biophysical variables as Leaf Area Index (LAI) and the Normalized Difference Vegetation Index (NDVI) which measures vegetation health via greenness used as a proxy for drought-induced vegetative stress, were taken from Peking University’s Global Inventory Modelling and Mapping Studies version 1.2 (PKU GIMMS) at 0.0833˚ spatial resolution. The analysis spans 32 years temporally from 1990 to 2021 and is carried out at a monthly scale by temporally aggregating the data through monthly averages.

For each variable, PCMCI+ measures partial correlation  as a function of the maximum time delay and the significance threshold applied.  Results here are presented for a maximum time lag of 3 months and a significance value of 0.05. At the investigated spatiotemporal scales, precipitation is the primary driver of soil moisture in Bundelkhand given a 3-month lag. Temperature primarily affects LAI with a 1-month lag, while accumulated warmth supports vegetation on longer timescales (3-month lag). Among atmospheric factors, relative humidity emerges as the strongest control on vegetation greenness and canopy development, influencing both NDVI, and LAI. The results also reveal important land-atmosphere feedback. The negative feedback between soil moisture, NDVI, and LAI indicates self-limiting plant growth under water stress 2-3-month lag. Vegetation contributes to surface cooling as expected, reflected in the inverse relationship between LAI and temperature. Furthermore, vegetation regulates evaporation, with NDVI affecting evaporation at a 2-month lag and LAI at a 3-month lag. Spatially, district-level patterns generally mirror the regional findings, except for Lalitpur, where fewer and different causal links were identified. Overall, the study shows that humidity-driven vegetation dynamics and multi-lag feedback between the land surface and atmosphere are central to drought evolution, highlighting the importance of explicitly representing these coupled processes in ecohydrological assessments. Future work should translate these identified causal pathways into next-generation drought monitoring and forecasting systems that incorporate lag-aware vegetation-climate interactions to improve drought early-warning capabilities and anticipatory mitigation planning.

How to cite: Sahu, H., Garg, P. K., Vijay, S., and Dasgupta, A.: Uncovering Causal Pathways of Agricultural Droughts using Climate and Vegetation Signals, EGU General Assembly 2026, Vienna, Austria, 3–8 May 2026, EGU26-1007, https://doi.org/10.5194/egusphere-egu26-1007, 2026.

EGU26-1046 | ECS | Posters virtual | VPS7

Multi-Proxy Reconstruction of Late Quaternary Monsoon Variability and Fluvial Response in the Central Ganga Plain, India: Insights from magnetic, CHNS and geochemistry records. 

Jayabharathi Jayakumar, Amal ms, Binita phartiyal, Anupam sharma, Pankaj Kumar, Gaurav D. Chauhan, and Prasanna kannan

The Central Ganga Plain (CGP), a key sector of the Indo-Gangetic foreland basin, contains thick, continuous Quaternary alluvial sequences. Its rapidly subsiding basins preserve a high-resolution terrestrial archive, ideal for reconstructing Indian Summer Monsoon (ISM). This study examines sedimentary profiles from distinct river systems in the Central Ganga Plain (CGP) using a multi-proxy framework. A Late Quaternary trench from the Gomti river (26°52′ N, 80°56′ E, Lucknow) and a Holocene section from the Betwa river (25°28′ N, 79°5′ E, Hamirpur). Sediment sample from Lucknow profile were analysed for CHNS, AMS ¹⁴C dating, mineral magnetism, and bulk geochemistry (major, trace, and REE), while those from Hamirpur were analysed using OSL and AMS ¹⁴C dating, alongside CHNS. The established chronology or Lucknow trench, record from ~24 to 3 kyr BP. The CHNS data shows a significant shift at ~20 kyr, marked by high TOC (3.97%) and C/S ratio (~ 300) indicating enhanced organic productivity and freshwater conditions. Concurrent mineral magnetic signatures (χlf, SIRM and ꭓARM) suggest strong detrital input linked to weaker monsoon. This evolving climatic condition is further investigated through bulk geochemistry, (major, trace and REE), which provide critical insights into sediment provenance, weathering regimes, and paleo-hydrological conditions. The chronology for the Hamirpur trench covers from ~800-12000 years BP and the CHNS data provide distinct environmental phases, marked by a sharp peak in TC (3.31%), TOC (1.56%) and C/N ratio (~439), indicating a enhanced terrestrial organic matter preservation in a low-energy, waterlogged setting around ~3000 kyr BP. This integrated high-resolution multiproxy record from the two distinct river systems provides new insights into monsoon variability and sedimentary responses in the Central Ganga Plain during the late Quaternary.

How to cite: Jayakumar, J., ms, A., phartiyal, B., sharma, A., Kumar, P., D. Chauhan, G., and kannan, P.: Multi-Proxy Reconstruction of Late Quaternary Monsoon Variability and Fluvial Response in the Central Ganga Plain, India: Insights from magnetic, CHNS and geochemistry records., EGU General Assembly 2026, Vienna, Austria, 3–8 May 2026, EGU26-1046, https://doi.org/10.5194/egusphere-egu26-1046, 2026.

EGU26-1934 | ECS | Posters virtual | VPS7

From Divers to Communities: An IoT-Based Crowdsourcing Sensing Approach to Protect Underwater Heritage Sites 

Apostolos Gkatzogias, Dionysis Bitas, Katerina Georgiou, Angelos Amditis, and Panagiotis Michalis

Underwater cultural heritage, such as ancient shipwrecks and submerged archaeological sites, faces increasing risks from climate-driven environmental changes. Salinity shifts, temperature anomalies, and biofouling contribute to the degradation of these resources [1]. This study explores deploying 12 IoT-enabled devices with a crowdsourcing strategy to monitor and address these challenges effectively. 

Three device variants are available: Type 1 features an acrylic enclosure and is deployable either from boats at depths of 2–3 meters or by divers for short-duration deployments. Type 2 uses an aluminum enclosure and is designed for long-term seabed deployments. Types 1 and 2 both measure temperature, salinity, and pressure. Type 3 is a specialized variant that replaces the pressure sensor with a chlorophyll sensor and is intended for monitoring algal concentrations. 
Each device incorporates a data logger built on a microcontroller, connected to sensors via serial interfaces such as RS485 and I2C. The microcontroller interfaces with sensors to record measurements, storing data locally until retrieval. All  devices feature a power management system with custom-designed PCBs for efficient energy use.  

Data gathered by the devices is stored locally and transferred to a cloud platform via an intuitive mobile app. Communication between the devices and the smartphone uses Bluetooth Low Energy (BLE), while data uploads to the cloud.  The application provides immediate and structured access to the data, eliminating the need for additional hardware or infrastructure and enabling seamless data availability without added operational costs. 

Community participation plays a central role in this system. Local communities deploy and retrieve boat-based sensors, improving the coverage and frequency of monitoring activities. By pooling data from various contributors, detailed information of environmental conditions near cultural heritage sites is acquired. 

The devices are subject to thorough calibration, either through controlled sensing operations or by comparison with ground-truth data acquisitions, to ensure reliable data collection. Conductivity sensors are standardized against established salinity benchmarks, temperature sensors are tested using laboratory-grade reference instruments, pressure sensors are calibrated in controlled pressure chambers, and chlorophyll sensors are validated using fluorescence reference standards. 

Field trials at four underwater sites tested the system under diverse conditions, providing a robust environment to assess device performance and crowdsourcing effectiveness. Feedback from divers, local participants, and heritage professionals refined functionality. Adjustments included stronger enclosures, improved BLE connection stability and an enhanced mobile app interface. 

This study demonstrates the potential of combining smart sensor technology with community engagement to protect underwater heritage. Leveraging IoT devices and collaboration expands monitoring, reduces costs, and fosters local stewardship, offering a scalable, sustainable solution to mitigate environmental impacts on submerged cultural treasures. 

References: 

[1] P. Michalis, C. Mazzoli, V. Karathanassi, D. I. Kaya, F. Martins; M. Cocco, A. Guy and A. Amditis, "THETIDA: Enhanced Resilience and Sustainable Preservation of Underwater and Coastal Cultural Heritage," IGARSS 2024 - 2024 IEEE International Geoscience and Remote Sensing Symposium, Athens, Greece, 2024, pp. 2208-2211, doi: 10.1109/IGARSS53475.2024.10642229. 

[2] L. Pavlopoulos, P. Michalis, M. Vlachos, A. Georgakopoulos, C. Tsiakos and A. Amditis, "Integrated Sensing Solutions for Monitoring Heritage Risks," IGARSS 2024 - 2024 IEEE International Geoscience and Remote Sensing Symposium, Athens, Greece, 2024, pp. 3352-3355, doi: 10.1109/IGARSS53475.2024.10641101. 

Acknowledgement: 

This research has been funded by European Union’s Horizon Europe research and innovation programme under THETIDA project (Grant Agreement No. 101095253). 

How to cite: Gkatzogias, A., Bitas, D., Georgiou, K., Amditis, A., and Michalis, P.: From Divers to Communities: An IoT-Based Crowdsourcing Sensing Approach to Protect Underwater Heritage Sites, EGU General Assembly 2026, Vienna, Austria, 3–8 May 2026, EGU26-1934, https://doi.org/10.5194/egusphere-egu26-1934, 2026.

EGU26-1982 | Posters virtual | VPS7

Underwater Operations for Data Collection in Integrated Cultural Heritage Monitoring and Protection 

Panagiotis Michalis, Stella Demesticha, Paschalina Giatsiatsou, Anna Demetriou, Fabio Ruberti, Guido Gabotto, Flavio Martins, Claudio Mazzoli, and Angelos Amditis

Underwater cultural heritage (UCH) is threatened by climatic risks, natural hazards, pollution and human induced activities, which increases the need for integrated monitoring approaches that combine advanced technologies with reliable in situ observations. This study presents the experience gained during underwater operations carried out in THETIDA project. This involved the deployment of coordinated teams of specialized and recreational divers across four Mediterranean pilot sites for data collection and documentation in support of integrated monitoring and protection of UCH sites. Diving teams were systematically deployed to collect various datasets (e.g. high-resolution photographic and video data), perform archaeological measurements, mapping using established underwater archaeology techniques and provide ground truth and spatial referencing data using a series of underwater technologies (e.g. wearable sensors, hyperspectral cameras, autonomous under water vehicles, among others).

At the 18th-century Nissia shipwreck (Cyprus), diving operations were carried out in parallel with a site excavation, hyperspectral imaging of wooden structures, material and biofouling sampling and the deployment of wearable, seabed and boat operated environmental sensing systems. Comparable methodologies were applied at deeper sites, including the WWII Equa shipwreck and the Roman Albenga II shipwreck of Gallinara Island (Italy), as well as the WWII B-24 Liberator aircraft (Portugal). Across these sites, divers performed detailed photogrammetric surveys and 3D reconstructions, in operations under constrained visibility and challenging conditions, putting into practice the validation of the performance and durability of prototype underwater sensing devices. Diver observations obtained at sites were also considered essential for the identification of site-specific risks, such as sediment mobility, biological colonization and physical disturbances. In addition to scientific data acquisition, the underwater operations supported participatory monitoring through citizen-science activities (operation of boat sensing devices), aiming to contribute to long-term site and data continuity.

The obtained results demonstrate that diving underwater operations are considered to be a key complementary component for integrated UCH monitoring, merging knowledge from specialist expertise with sensor-based systems in an effort to enhance informed conservation and protection strategies. Data gathered is also essential for the development of hazard and risk models that allow the prediction and aid the management of these UCH. The experience gained indicates that diving data collection is essential for integrating archaeological documentation, environmental sensing, and survey data under real field conditions. Underwater diver-led operations can serve as both primary data collectors and ground-truth contributors effectively bridging together human expertise with advanced monitoring technologies for the protection of underwater cultural heritage.

Acknowledgement:

This research has been funded by European Union’s Horizon Europe research and innovation programme under THETIDA project (Grant Agreement No. 101095253) (Technologies and methods for improved resilience and sustainable preservation of underwater and coastal cultural heritage to cope with climate change, natural hazards and environmental pollution).

How to cite: Michalis, P., Demesticha, S., Giatsiatsou, P., Demetriou, A., Ruberti, F., Gabotto, G., Martins, F., Mazzoli, C., and Amditis, A.: Underwater Operations for Data Collection in Integrated Cultural Heritage Monitoring and Protection, EGU General Assembly 2026, Vienna, Austria, 3–8 May 2026, EGU26-1982, https://doi.org/10.5194/egusphere-egu26-1982, 2026.

Our cultural memory is permanently endangered and, often, damaged irretrievably, given that cultural disasters, are quite repetitive, whether in cases of man-made or of natural disasters, armed conflicts and climate change combined with earth’s tectonic activity constituting, potentially, the primary causes.

The southwestern Peloponnese in Greece, precisely the region of Pylia, due to its proximity to the Hellenic trench, is considered to be tectonically as one of the most active areas in Greece, representing a major subduction zone. At the same time, it constitutes also a broad area with a very long history and a wealth of archaeological sites and relics. Focusing on the western coastline of the said region, directly exposed to variations of sea level height, as well as to conditions of rapid erosion due to the aggressive components of seawater, it should be considered as an area of ​​urgent priority to be monitored and protected.

Specifically, Voidokilia bay at the western coast of Messenia Prefecture, to the north of Navarino bay, a highly fragile ecosystem, actually under a NATURA Network protection status, constitutes the related case-study. Nevertheless, Voidokilia bay, is also one of the most attractive landscapes worldwide, thus facing rapid tourism challenges, ending up in increased disaster risks, both for the cultural as well as for the environmental assets. Accordingly, an interdisciplinary methodology within the scientific field of digital humanities has been applied for digitizing archaeological sites, excavated or not, underwater or not, as well as for highlighting their interdependence with the wider Messenia region’s archaeological sites network, further combined with trade routes connecting southwestern Peloponnese and the Aegean islands, via southeastern Peloponnese and Attica, thus fulfilling the notion of applied archaeology.

In this context, applying geoinformatics proved to be the most effective methodology for the related holistic cultural heritage management, in the perspective of an effective strategic planning on the part of the State apparatus, whether for private or public works, taking also into consideration charters, European directives and good practices, already applied worldwide, such as people’s community inclusion, in the direction of a public archaeology model.

The cornerstone of the specific research procedure has been extensive documentation, integration of different data types, such as archaeological, bibliographic, (palaeo)environmental, geospatial, remotely sensed imagery, for building up the sites’ multidimensional profile and revealing spatial relations and settlements’ interdependence, further highlighting the related buffer zones, in the perspective of delineating wider areas of archaeological profile, for anticipating the long-standing threats to archaeological assets such as rapidly increasing tourism, mismanaged development, poor excavation and looting, lack of conservation, climate change posing further significant threats to cultural heritage assets.

Conclusively, further constituting a potential contribution to the archaeological cadastre, already established by the Hellenic Republic, as well as proposing mild tourism development for keeping the balance between urban regeneration and environmental protection, in accordance with the Sustainable Development Goal 11-Sustainable cities and communities, one of the 17 SDGs established by the United Nations General Assembly in 2015, with the official mission to “Make cities inclusive, safe, resilient and sustainable”.

How to cite: Chroni, A. and Karathanassi, V.: The western Peloponnese coastline cultural landscape: cultural heritage management policy tools for making cities inclusive, safe, resilient and sustainable, EGU General Assembly 2026, Vienna, Austria, 3–8 May 2026, EGU26-2191, https://doi.org/10.5194/egusphere-egu26-2191, 2026.

EGU26-3138 | Posters virtual | VPS7

Historical floods of the 19th century in the amazon 

Kaylane Sousa, Daniela Granato, Antonio Neto, and Elke Nunes

Instrumental long-term climate records are scarce worldwide, especially in tropical regions such as the Brazilian Amazon. The lack of systematic data prior to the 20th century limits understanding of long-term climate variability and extreme events. This study is situated within the field of Historical climatology. It aims to contribute to knowledge of climate extreme events that occurred during periods of limited climatological data through analysis, focusing on the flooding events of 1859/60 and 1892 in the Amazon River basin. The research aligns 19th-century historical documents, such as newspapers, periodicals, official correspondence, and travel logs, with climate information from dendrochronological studies to reconstruct the magnitude, duration, and impacts of these flood events. Methodologically, it is constructed through an interdisciplinary approach combining environmental history, historical climatology, and hydrology, using written records as climate proxies that provide crucial information on river levels, rainfall seasonality, and flood persistence. Analysis of tree-rings from the Amazonian trees known as “Cedro-Vermelho” (Cedrela Odorata) indicates that the floods of 1859/60 and 1892 were among, if not the, most severe flooding extremes of the 19th century on the Amazon River basin. Historical descriptions of damage to livestock, farming, agriculture, urban infrastructure, and the living conditions of the population, which mainly consisted of “ribeirinhos”, a traditional culture and way of life near the rivers, back this up. The results demonstrate that rescuing and systematizing historical climate information from a region with a traditional lack of instrumental records helps fill a gap in tropical data. Regions such as those analyzed in this study have often been overlooked in historical climate research. The potential of historical records combined with dendrochronological analysis has proven extremely promising. It allows not only cross-validation of information but also the recovery of climate data through a non-conventional method of analyzing climate before the 20th century, helping to build a more comprehensive understanding of past climate in the vast Amazonian territory.

How to cite: Sousa, K., Granato, D., Neto, A., and Nunes, E.: Historical floods of the 19th century in the amazon, EGU General Assembly 2026, Vienna, Austria, 3–8 May 2026, EGU26-3138, https://doi.org/10.5194/egusphere-egu26-3138, 2026.

EGU26-3862 | Posters virtual | VPS7

Connecting Citizens, Science, and Vulnerable Heritage: An AR-Based Approach to Climate Resilience  

Konstantinos Koukoudis, Tina Katika, Alexis Touramanis, Angelos Amditis, and Panagiotis Michalis

The preservation of underwater and coastal cultural heritage is challenged by climate change, including sea-level rise, coastal erosion, extreme events and long-term environmental degradation. These threats require not only scientific monitoring and risk assessment, but also active engagement of local communities and stakeholders to foster awareness and citizen centered resilience.

This contribution presents the Augmented Reality (AR) crowdsourcing mobile application, to engage citizens, divers and local communities in exploring heritage sites, understanding climate-related risks and contributing to resilience strategies with collection of ground-truth data. The AR mobile application focuses on providing complex scientific knowledge into intuitive, place-based experiences accessible to non-expert audiences through interactive 3D reconstructions, contextualized information supported by visualizations of environmental and site-specific data over time. The AR mobile app supports enhanced learning and strengthens connections between citizens, heritage sites and scientific evidence, by allowing users to visualize digital content within their physical surroundings.

The application has been deployed across seven underwater and coastal pilot sites: the Equa Shipwreck (La Spezia, Italy), the Albenga A Shipwreck at Gallinara Island (Italy), the Hiorthhamn Arctic mining station (Svalbard, Norway), Lake IJssel (The Netherlands), the B-24 Liberator aircraft wreck (Algarve, Portugal), the Castle of Mykonos (Greece) and the Nissia Shipwreck (Cyprus). Each pilot features a tailored AR campaign reflecting its specific heritage value, ranging from Roman cargo vessels and WWII wrecks to Arctic industrial remains and coastal fortifications. Site-specific content visualises relevant climate hazards such as erosion, sea-level rise, storm impacts and material decay, while enabling users to explore excavation layers, alternative site states and historical reconstructions. The AR experiences are built using optimised 3D scans, reconstruction models, archival imagery, curated scientific content with interactive Points of Interest. Dynamic visualisations illustrate processes such as habitat formation, sediment movement, and structural transformation, supporting a deeper understanding of how environmental change affects heritage over time. All content has been developed in close collaboration with domain experts to ensure scientific accuracy and educational value.

A citizen-engagement study has been conducted to assess usability, user motivation, and the application’s effectiveness in raising awareness of climate risks to cultural heritage. Full validation across all pilot sites is taking place, ensuring that results reflect the cultural, geographic and environmental diversity of the seven pilot sites.

Acknowledgement:

This research has been funded by European Union’s Horizon Europe research and innovation programme under THETIDA project (Grant Agreement No. 101095253) (Technologies and methods for improved resilience and sustainable preservation of underwater and coastal cultural heritage to cope with climate change, natural hazards and environmental pollution).

How to cite: Koukoudis, K., Katika, T., Touramanis, A., Amditis, A., and Michalis, P.: Connecting Citizens, Science, and Vulnerable Heritage: An AR-Based Approach to Climate Resilience , EGU General Assembly 2026, Vienna, Austria, 3–8 May 2026, EGU26-3862, https://doi.org/10.5194/egusphere-egu26-3862, 2026.

EGU26-4120 | ECS | Posters virtual | VPS7

Seasonal and Interannual Variability of Tide-Gauge Records along the Angolan Coast for the period 2015 – 2020  

Fernao Guilherme, Maria Neves, and Luísa Lamas

Tide-gauge observations are among the most reliable sources for assessing sea-level variability and its seasonal and temporal changes in coastal regions. This study analyzes sea-level records obtained from tide gauges along the Angolan coast for the period 2015–2020, with the objective of characterizing the seasonal and interannual variability of tides. The methodology included quality control and pre-processing of hourly and monthly sea-level data, removal of non-tidal signals, harmonic tidal analysis, and the assessment of seasonal variability and its statistical significance. Despite limitations related to data gaps, limited temporal resolution, and the lack of complementary oceanographic data, the results reveal pronounced seasonal and interannual variability in sea level. This variability reflects the combined influence of tidal dynamics, regional ocean circulation, wind forcing, and climate-related processes. The analysis highlights the importance of continuous and homogeneous tide-gauge records along the Angolan coast for improving the detection and interpretation of sea-level variability. The findings contribute to coastal monitoring efforts and provide relevant information for coastal management, risk assessment, and the development of adaptation strategies in the context of sea-level change.

Keywords:  Sea level variability, Tide-gauge observations, Seasonal and interannual variability, Angolan coast.

How to cite: Guilherme, F., Neves, M., and Lamas, L.: Seasonal and Interannual Variability of Tide-Gauge Records along the Angolan Coast for the period 2015 – 2020 , EGU General Assembly 2026, Vienna, Austria, 3–8 May 2026, EGU26-4120, https://doi.org/10.5194/egusphere-egu26-4120, 2026.

EGU26-4208 | Posters virtual | VPS7

Reconstruction of Japan's Cold-Season Climate in the Past Few Hundred Years Using High-Resolution Multi-Proxy 

Naoko Hasegawa, Genki Katata, Junpei Hirano, Hitoshi Yonenobu, Koh Yasue, Fujio Kumon, Nozomi Hatano, Hiroshi Takahashi, Masumi Zaiki, and Takehiko Mikami

To understand the climate conditions in Japan before the commencement of modern official meteorological observations, it is necessary to indirectly estimate them using proxy data that serve as climate indicators.

In Japan, there is a nearly continuous annual dataset of Lake Suwa's freezing records spanning over 580 years. Furthermore, diaries from various parts of Japan contain daily weather records. By utilizing these records, daily climate data with the minimum temporal resolution can be obtained. By leveraging these proxies, it is possible to reconstruct the climate of the cold season, which has been previously less understood, across various temporal and spatial scales.

The objective of this study is to reconstruct the changes in cold-season climate in Japan over the past several hundred years with high temporal resolution.

The proxy data currently used include: lake and terrestrial sediments (Lake Suwa, approximately 1000 years), records of cherry blossom flowering and full bloom dates primarily collected in Kyoto (approximately 1000 years), tree rings (approximately 300 years), daily weather records from diaries (approximately 200 years), freezing records of Lake Suwa and Lake Jusan (approximately 580 and 150 years, respectively), early-meteorological observation data (approximately 50 years), and Japan Meteorological Agency observation data (approximately 150 years).

Firstly, the most extensive dataset, the cherry blossom flowering data, is used as a reference. Next, proxy variables are standardized after removing trends caused by human activities. Subsequently, regression analysis is performed for each period where variations either coincide or do not coincide. Furthermore, for each proxy variable, spatial correlations were calculated using 20th-century meteorological observation data to identify the regions represented by that proxy variable.

(This research was funded by JSPS Grant-in-Aid for Scientific Research (24H00118).

How to cite: Hasegawa, N., Katata, G., Hirano, J., Yonenobu, H., Yasue, K., Kumon, F., Hatano, N., Takahashi, H., Zaiki, M., and Mikami, T.: Reconstruction of Japan's Cold-Season Climate in the Past Few Hundred Years Using High-Resolution Multi-Proxy, EGU General Assembly 2026, Vienna, Austria, 3–8 May 2026, EGU26-4208, https://doi.org/10.5194/egusphere-egu26-4208, 2026.

EGU26-4441 | ECS | Posters virtual | VPS7

Intensified dominance of El Niño-like convection relevant for global atmospheric circulation variations 

Shuheng Lin, Fenying Cai, Dieter Gerten, Song Yang, Xingwen Jiang, Zhen Su, and Jürgen Kurths

Tropical convectionanomaly could serve as a crucial driver of global atmospheric teleconnections and weather extremes around the world. However, quantifying the dominances of convection anomalies with regional discrepancies, relevant for the variations of global atmospheric circulations, remains challenging. By using a network analysis of observation-based rainfall and ERA5 reanalysis datasets, our study reveals that El Niño-like convection is the most primary rainfall pattern driving the global atmospheric circulation variations. High local concurrences of above-normal rainfall events over equatorial central-eastern Pacific amplify their impacts, even though the most intense rainfall anomalies are observed near the Maritime Continent. Furthermore, we find that the impacts of El Niño- like convection will be tripled by the end of this century, as projected consistently by 23 climate models. Such “rich nodes get richer” phenomenon is probably attributable to the dipolar rainfall changes over theequatorial western-central Pacific. This study highlights the dominant role of El Niño- like convection on the global climate variations, especially under the future changing climate.

How to cite: Lin, S., Cai, F., Gerten, D., Yang, S., Jiang, X., Su, Z., and Kurths, J.: Intensified dominance of El Niño-like convection relevant for global atmospheric circulation variations, EGU General Assembly 2026, Vienna, Austria, 3–8 May 2026, EGU26-4441, https://doi.org/10.5194/egusphere-egu26-4441, 2026.

EGU26-5292 | Posters virtual | VPS7

ABSTRACT - Overall Contribution of EM4C to the TRIQUETRA Project  

Vasileios Spyrakos

The contribution of EM4C to the TRIQUETRA project addressed a central challenge in contemporary cultural heritage protection: transforming complex scientific risk assessment knowledge into practical, operational tools that support informed decision-making by professionals and heritage authorities. From the outset, EM4C adopted an application-oriented approach, extending beyond academic research to the development of structured methodologies and digital decision-support tools aligned with real-world conservation needs.

EM4C’s involvement spanned the full project lifecycle, from methodological design and knowledge structuring (WP3) to validation and evaluation (WP6), assessment of exploitation potential and future development pathways (WP7), and contribution to reporting and documentation activities (WP1). This integrated engagement ensured continuity between research, implementation, evaluation, and long-term usability of project outcomes.

Within WP3, and particularly Task 3.6, EM4C acted as task leader for the development of tools, methods, and technologies aimed at mitigating risks to cultural heritage sites. The work recognized that heritage vulnerability results from the interaction of multiple factors, including construction materials, environmental conditions, historical interventions, patterns of use, and diverse natural hazards exacerbated by climate change. Rather than addressing these factors in isolation, EM4C developed a structured framework reflecting real-world site behavior, where risks emerge through combined and cumulative effects over time.

A major challenge identified was the extreme complexity of potential risk scenarios. Initial theoretical analysis showed that more than 1.8 million combinations could arise when accounting for all variables, rendering manual assessment impractical. EM4C addressed this through a rational reduction process, grouping construction materials into four realistic tri-material combinations commonly found in heritage sites. This filtering reduced the scenario space to 15,120 valid and prioritized cases, maintaining representativeness while ensuring usability.

These scenarios were implemented digitally through two decision-support tools: the M REPORT ENGINE for monument-scale assessments and the LS REPORT ENGINE for landscape-scale risk management. Both tools generate structured technical outputs based on user-selected parameters such as materials, hazards, and risk intensity. Crucially, the proposed conservation and protection measures are grounded in an extensive manual synthesis of scientific literature, technical guidelines, and recognized good practices, ensuring technical accuracy, consistent terminology, and non-commercial neutrality.

The developed tools were evaluated within WP6 through presentations and hands-on assessments involving conservators, engineers, and cultural heritage authorities, including representatives of the Hellenic Ministry of Culture. Feedback collected through questionnaires and qualitative observations confirmed the tools’ clarity, relevance, and capacity to support structured decision-making, while also identifying directions for future refinement.

Within WP7, EM4C assessed the exploitation potential of the model and tools, demonstrating their adaptability to diverse institutional contexts and their suitability as flexible decision-support systems. The work highlighted their potential evolution into more specialized, data-integrated applications.

Overall, EM4C’s contribution effectively bridged theory and practice, delivering scientifically robust yet operationally meaningful tools that enhance the long-term impact and applicability of the TRIQUETRA approach to cultural heritage risk management.

How to cite: Spyrakos, V.: ABSTRACT - Overall Contribution of EM4C to the TRIQUETRA Project , EGU General Assembly 2026, Vienna, Austria, 3–8 May 2026, EGU26-5292, https://doi.org/10.5194/egusphere-egu26-5292, 2026.

EGU26-7064 | Posters virtual | VPS7

Late Pleistocene to Holocene Multi-proxy Paleoenvironmental and Paleoclimatic Reconstruction of the Makgadikgadi Basin, Central Kalahari, Botswana 

Trhas Kahsay, Asfawossen Asrat, Nitesh Sinha, Marta Marchegiano, and Fulvio Franchi

The Makgadikgadi Basin (MKB), in the central Kalahari Basin of northeastern Botswana, currently consists of a wide complex playa lake system, a relic of the Paleolake Makgadikgadi. Reconstructing the Quaternary depositional, environmental, and climatic history of the lacustrine-playa system has great significance for revealing the basin's evolution. However, its sedimentary record remains largely unexplored due to methodological challenges. In this study, four sediment cores, up to 1.6 m deep, were collected along a generally E-W transect from the western to central parts of the Ntwetwe pan, MKB.  Our multi-proxy record, including sedimentology, chronology, ostracod-based biostratigraphy, and clumped (∆47) isotope geochemistry from these cores, reveals three complex hydroclimatic sequences that refine the environmental and climatic evolution of the MKB for the past 29 cal ka BP. The computed Bayesian age depth model and preliminary clumped isotope analysis on ostracod valves suggest the late Pleistocene (~29-19.5 cal ka BP) hypersaline-saline phase occurred under relatively low temperature conditions (∆47-T = ~18.5-21°C), aligning with global glacial cooling and supporting interpretations of severe aridity in the Kalahari during the Last Glacial Maximum. The shift to a freshwater ostracod assemblage by ~5.2 cal ka BP partly corresponds to the termination of the African Humid Period (AHP), with a mean temperature (∆47-T) of ~16.8°C. However, our record reveals significant complexity during the Late Holocene. The dominance of brackish water assemblage from ~4-1.6 cal ka BP suggests a prolonged transitional phase toward aridity, consistent with the broad trend of ITCZ retreat. Most notably, the late Holocene (~1.6-1 cal ka BP) assemblage, indicating a mix of brackish and freshwater taxa alongside extreme and warmer temperatures (∆47-T = ~28.5°C). This implies a period of complex hydrological variability, potentially driven by increased summer rainfall variability or episodic flood inflow. Consequently, the Late Pleistocene and Middle Holocene data align with regional patterns, while the Late Holocene sequence particularly highlights the current extreme climate in the region, suggesting ostracod growth under extreme ephemeral playa lake conditions.

How to cite: Kahsay, T., Asrat, A., Sinha, N., Marchegiano, M., and Franchi, F.: Late Pleistocene to Holocene Multi-proxy Paleoenvironmental and Paleoclimatic Reconstruction of the Makgadikgadi Basin, Central Kalahari, Botswana, EGU General Assembly 2026, Vienna, Austria, 3–8 May 2026, EGU26-7064, https://doi.org/10.5194/egusphere-egu26-7064, 2026.

EGU26-8488 | Posters virtual | VPS7

The Million Year Ice Core Project at Dome C North 

Joel B. Pedro and the Million Year Ice Core Project Team

The Million Year Ice Core (MYIC) Project is an Australian Antarctic Program initiative to recover a continuous ice core spanning the mid-Pleistocene Transition (MPT; 700–1,250kyr). MYIC pilot drilling and borehole reaming for casing installation started in the 2024/25 austral summer at Dome C North (DCN, 75.04220S, 123.63120E, ice depth of 3064 m). DCN is 9 km NE of Concordia Station and 45 km NE of the European Beyond EPICA Oldest Ice site at Little Dome C (LDC). In the 2025/26 season, casing was installed and deep drilling commenced using a new AAD deep drill system. Completion of drilling to bedrock is scheduled for the 2028/29 season.

One-dimensional ice modelling, constrained by ice penetrating radar and isochrones traced back to the original EPICA Dome C ice core site, indicate an age above the basal ice at DCN potentially reaching 2 million years (Ma) and a resolution at 1.5 Ma of 10,000 years per metre or better (Chung et al., 2023).

Laboratory capabilities for MYIC are directed at measurements required to test hypotheses on the cause of the MPT. Ice core continuous flow analysis (CFA) for conductivity, particles and soluble ions are underway, with fraction-collected aliquots taken for measurement of cosmogenic 10Be. Gas and water isotope measurements on the returned ice are scheduled to start this year. The new gas laboratory developed for the project combines a small-sample sublimation extraction system coupled to a Quantum Cascade Laser spectrometer and dual inlet mass spectrometry for combined measurement of CO2, δ13C-CO2, CH4, and N2O, as well as the main air isotopes. There are opportunities for measurements of other parameters through national and international collaboration.

How to cite: Pedro, J. B. and the Million Year Ice Core Project Team: The Million Year Ice Core Project at Dome C North, EGU General Assembly 2026, Vienna, Austria, 3–8 May 2026, EGU26-8488, https://doi.org/10.5194/egusphere-egu26-8488, 2026.

The Norian-Rhaetian boundary (NRB) marks a critical interval of Late Triassic global environmental instability, ecological crisis, and climatic transition, which preceded the sustained biodiversity decline culminating in the end-Triassic mass extinction. Despite its significance, the drivers of carbon cycle and biotic disturbances across the NRB remain unresolved. In most cases, these major mass extinctions in geological history are interpreted as chain reactions triggered by volcanic activity. Interestingly, the NRB and Rhaetian intervals lack compelling evidence for synchronous, precisely dated, large-scale volcanism with demonstrable global effects. In this context, the Central Atlantic Magmatic Province (CAMP) erupted later at ca. 201 Ma, while other impact-related triggers and/or proposed large igneous provinces (LIP), such as the Angayucham LIP in Alaska (214 ± 7 Ma), remained weakly constrained in magmatic timing, magnitude, and environmental significance. In the absence of significant volcanism, the mechanisms underlying carbon cycle perturbations and ecological crises become even more enigmatic.

Here, we present a high-resolution carbonate carbon isotope (δ13Ccarb) profile spanning the Late Triassic to Early Jurassic from South China. Through independent U-Pb dating and cyclostratigraphic analysis, a high-precision astronomical timescale was established. Carbon isotope variations are strongly controlled by orbital cycles, and the record reveals two large-magnitude negative carbon isotope excursions (CIEs) at ca. 205 Ma and 201 Ma, corresponding to the NRB and Triassic-Jurassic Boundary (TJB), respectively. Our study posits that astronomically driven climate change persistently influenced the NRB and subsequent Rhaetian intervals, triggering a series of chain reactions involving climate, vegetation, carbon burial, greenhouse gas emissions, and other factors. Ultimately, it acted as an amplifier in the NRB event, leading to carbon cycle perturbations and ecological crises during this period, thus potentially preconditioning the Earth system for the subsequent end-Triassic mass extinction. This study further highlights the significance of low-latitude coastal areas as dynamic amplifiers of carbon cycle instability and underscores the vulnerability of modern carbon reservoirs under ongoing climate change.

How to cite: Lu, T. and Fu, X.: Astronomically Driven Climate Change as an Amplifier of Carbon Cycle Instability and Ecological Crisis at the Norian-Rhaetian Boundary, EGU General Assembly 2026, Vienna, Austria, 3–8 May 2026, EGU26-8903, https://doi.org/10.5194/egusphere-egu26-8903, 2026.

EGU26-9183 | Posters virtual | VPS7

Digital Integration of Environmental, Socio-Economic and Hazard Data for Heritage Resilience 

Katerina Georgiou, Konstantinos Routsis, Panagiotis Michalis, and Angelos Amditis

Cultural heritage is exposed to a wide range of risks arising from natural processes, extreme events and human activities, making heritage resilience a challenging and complex issue. Existing risk assessment and management approaches often lack cohesion, difficult to access or insufficiently aligned with the everyday needs of heritage managers and local communities, resulting in gaps in understanding, as well as preparedness and response capacity.

This contribution focuses on addressing these challenges by merging scientific knowledge, field-based experience, and community generated awareness through an integrated digital environment. Within the European project THETIDA, a web-based visualization and decision-support platform has been developed with the main objective of supporting a holistic understanding of cultural heritage resilience. The platform integrates hazard information, environmental monitoring data, socio-economic indicators and spatial representations within a single, accessible interface, enabling users to explore and understand how multiple risks interact and affect heritage assets and their surrounding environments.

The platform delivers three main categories of services: (i) Remote Sensing–Based Services, including inundation and flood prediction, coastal erosion monitoring, material degradation mapping, land-use change detection, and geo-hazard assessment; (ii) In-Situ Sensing Services, supporting on-site monitoring and material characterization; and (iii) a Decision Support System providing seismic hazard analysis, multi-risk assessment, and socio-economic impact evaluation. Interactive geospatial functionalities allow users to explore datasets through structured spatial representations, such as hexagonal grid systems and visualize multiple data layers simultaneously. The system operates through standard web browsers without the need for specialized GIS software, ensuring accessibility for diverse user groups, including heritage professionals, decision-makers and local communities. Multiple data formats, such as GeoJSON, TIFF, PDF, 3D models and imagery, are processed and visualized in near real time within the platform.

Τhe results demonstrate that the integration of digital tools is not only considered as a technological advancement but also as a key enabler for collaboration, participation and sustainable heritage management. Interactive and cooperative digital environments can significantly enhance the resilience of cultural heritage sites to climate and disaster-related risks, supporting informed, inclusive and actionable management strategies.


Acknowledgement:

This research has been funded by European Union’s Horizon Europe research and innovation program under THETIDA project (Grant Agreement No. 101095253) (Technologies and methods for improved resilience and sustainable preservation of underwater and coastal cultural heritage to cope with climate change, natural hazards and environmental pollution).

How to cite: Georgiou, K., Routsis, K., Michalis, P., and Amditis, A.: Digital Integration of Environmental, Socio-Economic and Hazard Data for Heritage Resilience, EGU General Assembly 2026, Vienna, Austria, 3–8 May 2026, EGU26-9183, https://doi.org/10.5194/egusphere-egu26-9183, 2026.

EGU26-10629 | Posters virtual | VPS7

On the  links between large-scale atmospheric circulation and extreme events in the Danube basin, identified by Palmer drought indices 

Constantin Mares, Ileana Mares, Venera Dobrica, and Crisan Demetrescu

The aim of this study is to explore links between large-scale atmospheric circulation and meteorological and hydrological drought events in the Danube basin.

Based on previous studies on the relationship between large-scale atmospheric circulation and the occurrence of extreme events in the Danube basin, especially in the middle and lower Danube basin, two climate indices were considered. The first index characterizes the Greenland-Balkan Oscillation (GBOI) and the second is the well-known index associated with the North Atlantic Oscillation (NAOI). For meteorological and hydrological drought, the Palmer Drought Severity Index (PDSI), with applications especially in the agricultural field, and, respectively, the Palmer Hydrological Drought Index (PHDI), especially useful for estimating drought affecting water resources on longer timescales, were taken into account.

To find the type of connection (linear/non-linear) between large-scale climate indices (GBOI, NAOI) and those at the regional scale (PDSI, PHDI), elements from information theory, such as mutual information, were applied. To get time-frequency details, bivariate and multivariate wavelet transforms were used.

The analyses were performed separately for each season. The most statistically significant results were obtained both for the link between GBOI and PDSI, in the winter season, and for that between GBOI and the two analysed Palmer indices, in the spring season.

Regarding the influence of NAOI, it is much less than that of GBOI, but it can be considered relatively significant in winter on PDSI and in spring on PHDI.

From the wavelet coherence analyses it was observed that the significant coherences between the large-scale atmospheric indices and the analysed Palmer drought indices are located in frequency bands, corresponding to ~11–year, 22-year and 33-year period bands, that can be associated with the Schwabe, Hale and even Bruckner solar activity cycles.

In exploring regional-scale droughts, for the future studies, it appeared evident the importance of taking into account of the simultaneous or delayed influence of solar activity on terrestrial climate variables.

How to cite: Mares, C., Mares, I., Dobrica, V., and Demetrescu, C.: On the  links between large-scale atmospheric circulation and extreme events in the Danube basin, identified by Palmer drought indices, EGU General Assembly 2026, Vienna, Austria, 3–8 May 2026, EGU26-10629, https://doi.org/10.5194/egusphere-egu26-10629, 2026.

EGU26-11292 | Posters virtual | VPS7

Urban Flood Risk Assessment Using High-Resolution 3D Building Models and Multi-Temporal Meteorological Data 

Iuliana Pârvu, Iuliana Cuibac, Adrian Pârvu, Nicoleta Pârvulescu, Ioana Corneanu, Sorin Cheval, Vasile Crăciunescu, Alexandru Dumitrescu, Vlad Amihaesei, Ștefan Gabrian, Ștefan Dinicila, and Nicu Tudose

Urban areas are increasingly exposed to flood hazards due to climate change, densification and growing urbanization. Remote sensing datasets can be used to monitor the floods and warn the population. Much more, simulations of hazards, using high resolution geospatial datasets combined with meteorological data can be derived. In this case, solutions prior to the events can be implemented, so increasing the resilience of cities to natural hazards.

This study presents a high-resolution 3D urban model of Brașov, Romania, developed from an airborne photogrammetric datasets acquired in 2025, and its application in urban flood risk assessment. The 3D building models were obtained using footprints from the national topographic database and the height derived from the computed normalized Digital Surface Model (nDSM). For the flood modelling the hydrological network and land cover data were used.

To assess flood risk, time series precipitation dataset was analyzed and used in the modelling framework. The combined analysis under different scenarios, enabled the identification of flood areas and the estimation of the number of exposed buildings. The results highlight the importance of high-resolution 3D urban data for understanding flood dynamics in complex urban settings and support decision-making processes related to urban planning, risk mitigation, and climate resilience. The output also represents a starting point for a Digital Twin for Brașov.

How to cite: Pârvu, I., Cuibac, I., Pârvu, A., Pârvulescu, N., Corneanu, I., Cheval, S., Crăciunescu, V., Dumitrescu, A., Amihaesei, V., Gabrian, Ș., Dinicila, Ș., and Tudose, N.: Urban Flood Risk Assessment Using High-Resolution 3D Building Models and Multi-Temporal Meteorological Data, EGU General Assembly 2026, Vienna, Austria, 3–8 May 2026, EGU26-11292, https://doi.org/10.5194/egusphere-egu26-11292, 2026.

EGU26-12459 | ECS | Posters virtual | VPS7

Oyster shells record seasonal climate variability in the middle Eocene Paris Basin under higher-than-modern temperatures and seasonal rainfall patterns 

Aniket Mitra, Steven Goderis, Michiel Baatsen, Xianye Zhao, Swagata Chaudhuri, Béatrice A. Ledésert, Philippe Claeys, and Inigo A. Müller

The Eocene experienced pronounced temporal changes in temperature and atmospheric pCO2, with multiple warming phases from the early to late middle Eocene. High-resolution, sub-annual palaeoclimate reconstructions are essential to evaluate the impact of elevated pCO2 on seasonal climate dynamics, providing critical insights for mitigating future climate crises. Middle Eocene Climatic Optimum (MECO), the Lutetian–Bartonian boundary warming event (~41 Ma) is particularly relevant, as current pCO2 levels are rising rapidly and could reach similar concentrations within a century.

Bivalvia shells, growing incrementally, record seasonal to even sub-daily climatic and environmental fluctuations throughout their life. Shells of the oyster Cubitostrea cubitus, a shallow-to-marginal marine cementing bivalve from the Sables du Guépelle Formation (~41 Ma) of the Paris Basin (~41° N palaeolatitude), contain very low Mn and Fe concentrations (<250 µg/g), indicating their pristinity. These shells are used as a palaeoclimate archive in a multiproxy approach that combines LA-ICP-MS trace element analyses and clumped isotope thermometry (Δ47), integrated with simulations from the Community Earth System Model (CESM). Sub-annual periodic variations in trace elements to Ca ratios along the oyster hinge indicate an oyster lifespan of ~16 months when aligned with monthly temperature variability from CESM simulations. Clumped isotope thermometry (Δ47-T) records a seasonal sea surface temperature (SST) amplitude of ~8 °C, where the summer temperature reaching 28.3 ± 4.4 °C (68% CI) and winter temperatures of  19.6± 3.5 °C. Summer δ18Ow (-1.1± 0.9  ‰), consistent with Bartonian seawater compositions (-0.5 to -1.0 ‰), indicate a strong seasonal marine influence in early Bartonian Paris Basin. In contrast, significantly lower winter δ18Ow values (-2.9± 0.7 ‰) reflect enhanced freshwater input, which is further supported by relatively lower Sr/Ca profile, a salinity indicator consistent with increased winter rainfall predicted by CESM simulations.

In summary, our preliminary results indicate that during the MECO, the Paris Basin experienced seasonal sea-surface temperature variability comparable to that of modern shallow waters along the French North Sea coast, but with higher temperatures of approximately 10 °C throughout the year. In contrast to the modern climate (in the region of : 0–5° E, 46–50° N), where annual precipitation is relatively evenly distributed, rainfall during the MECO appears to have been strongly seasonal.

How to cite: Mitra, A., Goderis, S., Baatsen, M., Zhao, X., Chaudhuri, S., Ledésert, B. A., Claeys, P., and Müller, I. A.: Oyster shells record seasonal climate variability in the middle Eocene Paris Basin under higher-than-modern temperatures and seasonal rainfall patterns, EGU General Assembly 2026, Vienna, Austria, 3–8 May 2026, EGU26-12459, https://doi.org/10.5194/egusphere-egu26-12459, 2026.

EGU26-14335 | Posters virtual | VPS7

Breaking Disciplinary Boundaries: Bringing the Biological Role out of the Blind Spot in DRF-Based Assessments of Limestone Weathering under a Changing Climate 

Snežana Radulović, Goran Anačkov, Boris Radak, Miloš Ilić, Božidar Radulović, Maja Novković, Samir Djug, Lejla Smailagić Vesnić, Saida Ibragić, and Nusret Dresković

Limestone cultural heritage has increasingly been threatened by the complex interplay of climatic stressors, air pollution, and biological colonization. In this STECCI study, a bio-geochemical dose-response framework was introduced to quantify and interpret the decay of stećci-medieval tombstones constructed from locally sourced limestone, across fifteen culturally significant sites in Southeastern Europe. While existing dose-response functions (DRFs) have traditionally been applied to climatic, chemical and physical weathering, biological link has often been in the Blind Spot, despite mounting evidence that lichens, mosses, and microbial taxa contribute actively to stone decay.

Two widely used DRF models Lipfert (1989) and Kucera et al. (2007) were applied to multi-decadal environmental data (1992-2023), accounting for variations in precipitation, temperature, and pollutant load (SO₂, NOₓ, PM₁₀). Bioassement surveys were conducted to record biological colonization using a modified Braun-Blanquet scale and photographic quadrat sampling. At the same toime, spatial overlays of DRF results and biological data were produced to identify zones of specific vulnerability, where climatic exposure and biodeteriogen presence were observed to overlap. As expected, the Lipfert model responded more strongly to high-precipitation karstic settings, while the Kucera model captured the cumulative effect of pollutants and humidity in urban sites. However, both models were shown to underestimate decay in areas with extensive lichen or moss coverage, highlighting the need for biotic factors to be integrated into predictive modeling. To address this, a multi-stressor approach was developed, coupling DRF-predicted surface recession with biological indicators and  introdicing b coficient within the both mathematical models, as Lithobiontic organisms, such as Lobothallia cheresina, Xanthoria elegans, and Grimmia pulvinata, were found to contribute to micro-fracturing, mineral leaching, and, most importantly, moisture retention, often acting synergistically with atmospheric deposition. Based on these insights, a STECCI Preservation Measures Assessment tool was proposed to classify heritage sites according to modeled decay, biocolonization intensity, and conservation urgency.

This integrative methodology was conducted to sharp the diagnostic capacity of DRFs and enabled the generation of science-based insights, integrating risk assessment models for heritage exposed to climatic, natural, and anthropogenic hazards. In light of projected climate shifts and persistent anthropogenic emissions, it is recommended that heritage conservation efforts adopt bio-geo diagnostics to transition from reactive toward preventive conservation strategies. The approach presented here is transferable to other limestone heritage materials and contributes to the growing discourse on climate-resilient cultural heritage preservation.

Acknowledgement: The STECCI project has received funding from the European Union’s Horizon Europe research and innovation programme under Grant Agreement No. 101094822 (STECCI), managed by the European Research Executive Agency (REA).


How to cite: Radulović, S., Anačkov, G., Radak, B., Ilić, M., Radulović, B., Novković, M., Djug, S., Smailagić Vesnić, L., Ibragić, S., and Dresković, N.: Breaking Disciplinary Boundaries: Bringing the Biological Role out of the Blind Spot in DRF-Based Assessments of Limestone Weathering under a Changing Climate, EGU General Assembly 2026, Vienna, Austria, 3–8 May 2026, EGU26-14335, https://doi.org/10.5194/egusphere-egu26-14335, 2026.

EGU26-14400 | ECS | Posters virtual | VPS7

Development of a Multi-Criteria Framework for Identifying Intra-Urban Heat Islands in Support of Urban Heat Mitigation in Athens, Greece 

Melitini Oikonomou, Ilias Agathangelidis, and Constantinos Cartalis

This study develops a novel multi-criteria framework for the identification of intra-urban heat islands by integrating indicators related to three-dimensional urban morphology (e.g., height-to-width ratio and sky view factor), land cover characteristics, satellite-derived land surface temperature, and thermal comfort conditions. The proposed framework practically enables the delineation of urban areas with distinct thermal and morphological profiles, thereby providing a robust basis for targeted, site-specific intervention strategies.

Subsequently, a range of bioclimatic heat mitigation measures is assessed for selected hotspots, including nature-based solutions such as increased tree planting and green roofs, as well as the application of high-albedo (cool) materials. The effectiveness of these measures is evaluated using advanced urban climate simulation models (ENVI-met and UT&C), allowing for a comparative assessment of their performance under varying spatial configurations and microclimatic conditions.

Overall, the study provides evidence-based guidance for urban heat mitigation and supports climate-resilient urban planning in Mediterranean cities, with Athens serving as a representative case study.

How to cite: Oikonomou, M., Agathangelidis, I., and Cartalis, C.: Development of a Multi-Criteria Framework for Identifying Intra-Urban Heat Islands in Support of Urban Heat Mitigation in Athens, Greece, EGU General Assembly 2026, Vienna, Austria, 3–8 May 2026, EGU26-14400, https://doi.org/10.5194/egusphere-egu26-14400, 2026.

EGU26-14428 | Posters virtual | VPS7

Controls on Ash-Fall Deposit Preservation in Low-Energy Depositional Systems of the Rio Bonito Formation, Paraná Basin, Brazil 

Ana Victória Ribeiro Franqueira, Manoela Bettarel Bállico, Luana Moreira Florisbal, Monica Oliveira Manna, and Claiton Marlon dos Santos Scherer

The Paraná basin is composed of stratigraphic units that record distinct paleoenvironmental settings, organized into six supersequences. The Gondwana I Supersequence  (Permian) records a transgressive-regressive cycle associated with tectonic and climatic changes, in which periglacial successions (Itararé Group), coastal and marine (Guatá Group), and continental deposits (Passa Dois Group) are preserved. These sedimentary units crop out along the eastern margin of the Paraná Basin in a complex structural configuration that reveals significant tectonic displacements attributed to normal faults, resulting in the lateral juxtaposition of stratigraphically distinct units. Due to this arrangement, volcanogenic deposits play a fundamental role as stratigraphic markers, as they allow the establishment of precise geochronological correlations. This study presents geochronological data obtained from a volcanogenic deposit at Morro dos Conventos outcrop, and compares it with a compilation of the ages of volcaniclastic sediments interbedded with sedimentary deposits from the Rio Bonito Formation, aiming to constrain the evolution of depositional systems that enabled the preservation of such volcanogenic deposits within this interval. The detailed stratigraphic section of the outcrop was conducted and samples were collected for geochronological analysis. U-Pb zircon ages were determined by LA-MC-ICP-MS from a volcanogenic layer. The results reveal a unimodal zircon population with a concordia age of 286 ± 1.4 Ma (N = 9; MSWD = 1.2), allowing correlation of the deposit with the Artinskian Stage. Sedimentological and stratigraphic analysis of the section indicates a paleoenvironment of storm wave-dominated shelf, with interbedded subsystems recording high-frequency cycles associated with changes in sea level or sedimentation rates within the second-order Permian transgressive sequence. Sedimentological and geochronological data suggest that the studied succession correlates with the upper portion of the Rio Bonito Formation, in a context of progressive drowning by the Palermo Sea. At the top of the section, a progradation of subsystems is observed, characterized by the arrangement of subaerial sequences under humid backshore conditions. A similar configuration has been documented in other areas of the basin during the Cisuralian, where pelitic successions associated with coal deposits preserve centimeter-thick intercalated volcanic ash layers. The preservation of these features is attributed to paleoenvironmental conditions of subsystems developed along the margins of subaqueous bodies, dominated by low-energy settings with limited reworking, favoring the deposition of fine-grained sediments. In the studied outcrop, the preservation of the volcanogenic deposit is interpreted as a result of deposition within fine-grained sediments characterized by redoximorphic structures, indicative of fluctuating conditions between dry and wet periods typical of subaerial environments influenced by aqueous systems. A similar preservation context is observed in volcanogenic deposits recorded both in CPRM wells (Brazilian Geological Survey) and in nearby outcrops of this stratigraphic interval. The coexistence of low-energy depositional systems and episodes of high-magnitude explosive volcanism along the western margin of Gondwana enabled the preservation of ash-fall deposits in the Paraná Basin stratigraphic record, commonly associated with the Choiyoi Magmatism during the proposed Rio Bonito Formation sedimentation interval.

How to cite: Ribeiro Franqueira, A. V., Bettarel Bállico, M., Moreira Florisbal, L., Oliveira Manna, M., and Marlon dos Santos Scherer, C.: Controls on Ash-Fall Deposit Preservation in Low-Energy Depositional Systems of the Rio Bonito Formation, Paraná Basin, Brazil, EGU General Assembly 2026, Vienna, Austria, 3–8 May 2026, EGU26-14428, https://doi.org/10.5194/egusphere-egu26-14428, 2026.

EGU26-15510 | Posters virtual | VPS7

Analysis of quantitative pollen-based reconstructions 

Konrad Gajewski

Quantitative estimates of Holocene climate conditions have been developed since the 1960s using space‑for‑time calibration approaches. Although hundreds of reconstructions are now available globally, questions persist regarding their accuracy. We evaluate quantitative reconstructions derived from three sources: site‑specific studies, regional reconstruction compilations, and regional products generated from global databases. The focus is on Holocene pollen‑based reconstructions, which remain the most widely used indicators of terrestrial paleoclimate and on North American Arctic and treeline regions. Reconstructions developed at individual sites often display substantial high‑frequency variability, including anomalous values and abrupt shifts, reflecting in part calibration-related artifacts. Regional averages (“stacks”) reduce some of this variability, yet comparisons based on different reconstruction sources reveal divergences. Conversely, studies analyzing paired cores from a single lake or from closely spaced sites frequently demonstrate strong replication and relatively low reconstruction error. Multi‑proxy analyses of Arctic cores likewise reveal both areas of agreement and persistent discrepancies. Addressing these inconsistencies remains a challenge for Holocene climate reconstruction.


How to cite: Gajewski, K.: Analysis of quantitative pollen-based reconstructions, EGU General Assembly 2026, Vienna, Austria, 3–8 May 2026, EGU26-15510, https://doi.org/10.5194/egusphere-egu26-15510, 2026.

EGU26-17979 | Posters virtual | VPS7

Sharp turnovers in Pliocene hydroclimate variability in the Levantine Corridor, East Mediterranean 

Nicolas Waldmann, Miao Yunfa, Olabayo Olaopa, Mohd Danish, Gaihong Niu, John Greenlee, Shah Parth, Ilaria Mazzini, Isla Castañeda, and Nimer Taha

The Pliocene (5.33-2.58 Ma) was comparatively warmer (+ 1.8-3.6 0C) than today and was characterized by elevated CO2 concentrations (400 ppmv). Thus, studying sedimentary sequences dated to this interval can serve as excellent analogues for comparing present conditions and provide tools for better modeling future trends. Yet, while most studies rely on marine archives, continental data dating back to this interval are scarce, particularly from boundary regions such as the Levantine Corridor. Sediments from the Erk-el-Ahmar Fm. (lacustrine, 3.9 Ma, Jordan Valley, Israel) and Bnot Lot member of the Sedom Fm. (lagoonal/lacustrine, 3.2-4.0 Ma, Dead Sea, Israel) highlight as one of the few well-exposed continental archives in the region that date back to that time.

In the present contribution, we explore these two sedimentary archives and integrate in a multi-proxy fashion the physical, chemical, and biological properties of both outcrop and core sections (with the latter only retrieved from the Erk-el-Ahmar sequence). This study aims to reconstruct the paleoenvironmental setting and changing hydroclimatic conditions in the Levantine Corridor during these time intervals. By amalgamating the datasets, we show that while the region is characterized by increased warmth and augmentation in precipitation patterns, occasional cooling phases coupled with drought punctuate the Pliocene climatic history in the Levantine region.

By synthesizing these diverse datasets into a consistent narrative, the project illuminates how precipitation, evaporation, and ecosystem processes interact under high-CO2 and high-temperature conditions. The outcomes provide the first robust benchmark of Pliocene hydroclimate evolution in the Levantine Corridor, offering critical insight into thresholds of lake resilience, feedback mechanisms, and the persistence of aquatic systems under sustained global warmth.

How to cite: Waldmann, N., Yunfa, M., Olaopa, O., Danish, M., Niu, G., Greenlee, J., Parth, S., Mazzini, I., Castañeda, I., and Taha, N.: Sharp turnovers in Pliocene hydroclimate variability in the Levantine Corridor, East Mediterranean, EGU General Assembly 2026, Vienna, Austria, 3–8 May 2026, EGU26-17979, https://doi.org/10.5194/egusphere-egu26-17979, 2026.

EGU26-19097 | ECS | Posters virtual | VPS7

Land-Atmosphere Drivers of Cloudburst Events 

Anandita Kaushal, Manabendra Saharia, and Balaji Rajagopalan

Cloudbursts, defined as sudden, intense rainfall episodes, are increasingly frequent extreme weather events in the Indo-Himalayan region, causing widespread devastation to human life and property; yet understanding their causal mechanisms and improving predictability remains constrained by incomplete knowledge of atmospheric and land-based precursors. Particularly, the role of soil moisture as a vital land-surface component has been underexplored in the context of cloudburst formation. This study hypothesizes that increased soil moisture from agricultural irrigation amplifies atmospheric moisture fluxes via land-atmosphere coupling and contributes to enhanced cloudburst risk. The objective here is to attribute moisture source locations, identify critical pre-event land-atmospheric indicators, and assess soil–atmosphere coupling through the analysis of IMD-specified cloudburst events from 1991 to 2020 using the Indian Land Data Assimilation System (ILDAS) dataset. We employ NOAA's Hybrid Single-Particle Lagrangian Integrated Trajectory (HYSPLIT) back-trajectory model and create Integrated Vapor Transport (IVT) maps, composited with winds, surface pressure, and sea level pressure, to trace moisture source locations. Pre-event anomaly detection and change-point analysis are performed using the Pruned Exact Linear Time (PELT) algorithm on soil moisture, precipitation, evaporation, and runoff variables across nine spatially proximate grid cells per event. Additionally, extreme percentile threshold exceedances and non-parametric persistence metrics quantify the early-warning potential. Decadal NDVI trends contextualize Land Use/Land Cover (LULC) influences. Results reveal moisture source hotspots in regions undergoing land-use transitions, with steep pressure gradients establishing strong circulation patterns that contribute moisture to multiple cloudburst events. Significant temporal anomalies occur across all four variables, with threshold exceedances and change-point detections ranging from 2 to 10 occurrences per event and anomaly persistence spanning 2 to 8 days for soil moisture. Early warning lead times of 15 to 120 days are identified for soil moisture, precipitation, evaporation, and runoff anomalies preceding the cloudburst events. These findings suggest that further quantifying the causal links among these variables can better help understand soil–atmosphere coupling and substantially improve early warning systems for detecting extreme rainfall events.

How to cite: Kaushal, A., Saharia, M., and Rajagopalan, B.: Land-Atmosphere Drivers of Cloudburst Events, EGU General Assembly 2026, Vienna, Austria, 3–8 May 2026, EGU26-19097, https://doi.org/10.5194/egusphere-egu26-19097, 2026.

EGU26-19525 | ECS | Posters virtual | VPS7

Optimizing Aerosol Emissions over Europe using Surface Black Carbon Measurements 

Babitha George, August Thomasson, Pontus Roldin, Arjo Segers, and Nick Schutgens

One approach to reduce the uncertaintites in the black carbon (BC) emissions estimated using the  bottom-up inventories is by integrating the atmospheric models with observational data. In this study, we estimate aerosol emissions  over Europe (15◦W–35◦E, 33–73 ◦N) by assimilating surface observations of BC from EBAS network using Local Ensemble Transform Kalman Filter (LETKF) in the LOTOS-EUROS chemical transport model. Sensitivity experiments indicate that an ensemble size of 24 and a localization distance of 300 km provide optimal performance. Furthermore, we assess the influence of CAMS BC boundary conditions on the emission estimates and find that these boundary conditions tend to overestimate BC concentrations near the domain boundaries.

Our results show that the bottom-up approach generally overestimates BC emissions across Europe. Quantitatively, the posterior emissions are found to be 21% and 30% lower than the prior emissions for the years 2011 and 2021, respectively. A reduction in both emissions and associated uncertainties is observed over central Europe, where the observations are dense. Seasonal analysis reveals that emission decreases are most pronounced over the central domain during autumn and winter. Finally, the validation of optimized BC concentrations with independent observations showed a decrease in bias and RMSE, however the correlation remains poor compared to the background concentrations.

How to cite: George, B., Thomasson, A., Roldin, P., Segers, A., and Schutgens, N.: Optimizing Aerosol Emissions over Europe using Surface Black Carbon Measurements, EGU General Assembly 2026, Vienna, Austria, 3–8 May 2026, EGU26-19525, https://doi.org/10.5194/egusphere-egu26-19525, 2026.

EGU26-20603 | ECS | Posters virtual | VPS7

How climate change rewrites metal decay: forecasting ancient shipwreck corrosion under acidified seawater 

Ludovica Pia Cesareo, Luigi Germinario, Floriana Salvemini, Ian Donald MacLeod, Edoardo Marchettoni, Corrado Ambrosi, Luigia Donnarumma, Adelmo Sorci, and Claudio Mazzoli

Underwater cultural heritage sites are under increasing pressure from emerging environmental risks: warmer waters and changing seawater chemistry are accelerating corrosion processes in ways that remain difficult to quantify in terms of their impacts on protected archaeological metals. This work proposes an experimental approach that makes these changes measurable and comparable across sites using metallic coupons carefully selected to match materials revealed from a series of wrecks. Coupons were deployed at different depths at four different locations, and retrieved at fixed time intervals. The development of corrosion layers, concretions, and biofouling in the natural environment was investigated. Observations were integrated with results from a second experimental approach. The same set of coupons was exposed to controlled environmental conditions using a custom Micro-Environment Simulator (MES). MES was set to reproduce marine conditions at 4 bar gauge pressure (40 m depth), 20 °C water temperature, and pH 7.7, simulating ocean acidification by the end of this century according to the CMIP6 projections for the Mediterranean under the SSP5-8.5 Warming 4 °C scenario. Results have shown a significant shift in electrochemical equilibria under declining pH, significantly influencing the stability of the corrosion products, and determining a shift in the behaviour of the corrosion layers from protective barrier to pathway for continued metal loss. By linking corrosion behaviour to specific environmental settings, the approach provides indicators of when and where deterioration is likely to accelerate under future scenarios. These outputs support preventive strategies for underwater metallic heritage by identifying high-risk wreck contexts, and guiding actions before irreversible loss occurs.

Acknowledgement:

This research has been funded by European Union’s Horizon Europe research and innovation programme under THETIDA project (Grant Agreement No. 101095253) (Technologies and methods for improved resilience and sustainable preservation of underwater and coastal cultural heritage to cope with climate change, natural hazards and environmental pollution).

How to cite: Cesareo, L. P., Germinario, L., Salvemini, F., MacLeod, I. D., Marchettoni, E., Ambrosi, C., Donnarumma, L., Sorci, A., and Mazzoli, C.: How climate change rewrites metal decay: forecasting ancient shipwreck corrosion under acidified seawater, EGU General Assembly 2026, Vienna, Austria, 3–8 May 2026, EGU26-20603, https://doi.org/10.5194/egusphere-egu26-20603, 2026.

EGU26-21729 | ECS | Posters virtual | VPS7

When Adaptation Follows Hazard, Not Vulnerability: Flood Loss and Damage in Assam 

Surbhi Vyas, Anamika Barua, and Chunchu Mallikarjuna

Assam, one of India’s most flood-prone states, has a vulnerability to climate change that is shaped by a complex socio-political context and increasing biophysical pressures. A range of policies and on-the-ground initiatives have been introduced to support climate change adaptation (CCA). However, understanding what works, where, and how remains critical for advancing effective and equitable adaptation. This study addresses this gap by examining Assam, a historically flood-prone state that experiences significant loss and damage each year.

Despite widespread exposure to floods, loss and damage across Assam is uneven. In several districts, high vulnerability rather than flood intensity drives severe economic and non-economic loss and damage. In some cases, districts with relatively low flood hazards experience high loss and damage due to social, economic, and institutional vulnerabilities. Differences in the type and quality of adaptation implementation further shape these outcomes.

To examine the role of adaptation in reducing and managing loss and damage, qualitative fieldwork was conducted in three districts representing different drivers of flood impacts. Majuli, a river island that experiences floods almost every year, records relatively low loss and damage. This is largely due to lower vulnerability and the presence of effective adaptation measures. Long-term structural interventions and community-led practices have enabled adaptation to move beyond coping towards more transformative pathways.

In contrast, Barpeta, a district exposed to high flood hazard, experiences high loss and damage due to high socio-economic vulnerability. Deep inequalities, uneven community distribution, limited adaptive capacity, and local political dynamics constrain effective adaptation. As a result, adaptation efforts in Barpeta have largely progressed only from coping to intermediate, incremental adaptation, despite decades of recurrent flooding.

The third case, Udalguri, is located farther from the Brahmaputra and is primarily affected by flooding from smaller tributaries. Although flood intensity is relatively low, the district experiences high loss and damage, particularly loss of human life. Flooding is a relatively recent phenomenon in this area, and communities are poorly prepared. High vulnerability, driven by inadequate adaptation strategies, persistent social inequality, and pronounced caste–class differentiation, has kept adaptation responses at the coping stage, with little progression towards incremental change.

Insights from expert interviews, key informant interviews, focus group discussions, and community interactions reveal that adaptation planning in Assam is largely guided by flood hazard levels rather than vulnerability. This hazard-focused approach results in unequal protection and leaves highly vulnerable communities exposed to severe loss and damage, not only economic but also high non-economic, which is not even documented.

Overall, the findings demonstrate that flood impacts cannot be understood through water levels alone. Vulnerability fundamentally shapes how floods are experienced and how damaging they become, particularly in relation to non-economic loss and damage. By foregrounding lived experiences and overlooked forms of loss, this study argues for a shift in adaptation planning beyond physical flood control. Policies must recognize vulnerability, systematically document non-economic losses, and support locally grounded, socially just adaptation pathways that protect people, not only infrastructure. This is especially critical in regions like Assam, where social vulnerability continues to turn even moderate floods into human tragedies.

How to cite: Vyas, S., Barua, A., and Mallikarjuna, C.: When Adaptation Follows Hazard, Not Vulnerability: Flood Loss and Damage in Assam, EGU General Assembly 2026, Vienna, Austria, 3–8 May 2026, EGU26-21729, https://doi.org/10.5194/egusphere-egu26-21729, 2026.

EGU26-21797 | ECS | Posters virtual | VPS7

Heatwave and Air pollution, a synergetic effect or not: A case Study 

Renu Masiwal, Dilip Ganguly, and Ravi Kunchala

Temperature essential for all the life form, but when the same temperature crosses its threshold limit it can become a threat for the same. In the recent decades the world has experienced a shift in temperature range both minima and maxima, as both are shifting towards the higher tail. And this is detrimental for health and air quality. Also very few studies talk about how rising temperature can impact the air quality and vice versa. Therefore, in the present work we have studied the long term heatwave pattern over Delhi, India using the ground based and satellite data observations. Delhi is known for its hot summers, landlocked geography and dense population.  During May 2022 , city experienced long heat wave event where daily maximum temperature observed higher than 40 OC   for consecutively  around 10 days  which not only  causes heat stress but also the pollution stress over the city as the concentration of Particulate matter (PM10 and PM2.5) observed significantly higher than the  non-heatwave period of the month. Air Quality Index (AQI) was moved from moderate to very poor during the heatwave period compared to non-heatwave where AQI showed satisfactory to poor condition. Further we observed that the Temp and Demand data increases monotonically during this period from 30 °C with demand ≈4500–5200 MW to about 38 °C with demand ≈6800–7070 MW, indicating a strong positive linear response. The regression analysis showed with 1°C increase in air temperature can increase the city demand by 97MW with r=0.61. We have further calculated night vs day slope, indicate that when night stays hot (>35°C) people might be keep cooling system running more intensely or for longer hours. And each degree increase in nighttime temperature put much larger load on demand compared to same warming during the day.

How to cite: Masiwal, R., Ganguly, D., and Kunchala, R.: Heatwave and Air pollution, a synergetic effect or not: A case Study, EGU General Assembly 2026, Vienna, Austria, 3–8 May 2026, EGU26-21797, https://doi.org/10.5194/egusphere-egu26-21797, 2026.

EGU26-873 | ECS | Posters virtual | VPS8

Geo-statistical and hydrochemical assessment of spring water quality and water sustainability based on WHO standards in the Agadir Ida-Ou-Tanane region 

Aya Raïs, Abdellaali Tairi, Ahmed El Mouden, Safae Ijlil, Hamza Ait Moh, Mohammed Hssaisoune, and Lhoussaine Bouchaou

Water resources worldwide are increasingly threatened by growing anthropogenic pressures and inherent hydrogeological constraints, raising concerns about their suitability for domestic use. This study aims to assess the physicochemical quality of certain springs in the Agadir Ida-Ou-Tanane region and evaluate compliance with international thresholds established by the World Health Organization (WHO) for drinking water. A total of twenty-six water samples were collected across the studied region and analyzed for key parameters including Electrical Conductivity (EC), Total Dissolved Solids (TDS) and Total Hardness (TH). The EC values ranged from 275 µS/cm to 4210 µS/cm with an average of 1446.15 µS/cm. For Total dissolved solids, values ranged from 135 ppm to 7140 ppm, with Total hardness presented a maximum value of 3217.02 mg/L and minimum value of 188.9 mg/L. Water Quality Index (WQI) was calculated to provide an integrated evaluation of the overall water quality.Spatial distribution of water quality was further examined through Inverse Distance Weighting (IDW) interpolation. WQI based classification  revealed that 73.1% of the springs were in acceptable quality categories, with 34.6% classified as excellent and 38.5% as good. Despite this generally favorable status, TDS values approach or exceed international thresholds in several locations, indicating the need for region-wide monitoring and treatment strategies. Considering the heavy dependence of rural communities on spring water, these findings underscore the importance of investing in adequate treatment infrastructure and implementing robust protection measures for sustainable water resource management.

How to cite: Raïs, A., Tairi, A., El Mouden, A., Ijlil, S., Ait Moh, H., Hssaisoune, M., and Bouchaou, L.: Geo-statistical and hydrochemical assessment of spring water quality and water sustainability based on WHO standards in the Agadir Ida-Ou-Tanane region, EGU General Assembly 2026, Vienna, Austria, 3–8 May 2026, EGU26-873, https://doi.org/10.5194/egusphere-egu26-873, 2026.

EGU26-1058 | ECS | Posters virtual | VPS8

A Statistical Methodology for Regional Scale Future Projection of the Seasonal Frequency of Sub-daily Extreme Rainfall Events 

Abhay Varshney and Vemavarapu Venkata Srinivas

Sub-daily extreme rainfall (SDER) events frequently lead to natural disasters, including flash floods, urban floods, landslides, and soil erosion. It is essential to make a reliable prediction of its frequency at the local/regional spatial scale for the future period, in order to devise improved disaster mitigation and adaptation strategies. It has been observed that current CMIP6 GCMs have limitations in simulating short-duration (sub-daily) heavy rainfall events, and large biases are often observed in the control run simulations compared to historical observations at various locations worldwide. Hence, there is a lack of confidence in considering the crucial future projections obtained from those GCMs as reliable. In this study, we present a novel statistical methodology for predicting the seasonal frequency of SDER for 99 river sub-basins (RSBs) in India, encompassing tropical, temperate, arid, and polar climates across various topographies. The methodology identifies the scaling relationship between the SDER frequency and the associated potential atmospheric variables/drivers for each RSB. Results indicated that the seasonal frequency of SDER scales with (i) near-surface air temperature (SAT), and (ii) moisture content in the air, which is measured by near-surface dew-point temperature (DPT). The scaling relationship exhibits an increasing (scaling) phase followed by a decreasing (reverse scaling) phase as the (dew point) temperature increases. The range of SAT and DPT in the scaling relationship varies with RSB and climate. The SAT and DPT values at peak frequency are high for mountainous areas and lower for non-mountainous areas. The effectiveness of those scaling relationships in predicting SDER frequency at the seasonal scale was assessed/validated for the recent past (1981-2020). The method performed fairly well for RSBs with non-mountainous topography and moderately well for RSBs with mountainous topography across climate zones, except for years with an abnormally high or low SDER frequency. A finer spatial-resolution scaling relationship is deemed necessary for mountainous topographies where SDER exhibits a rather local nature. In addition, the time trends in simulated and observed frequencies closely matched. The proposed methodology is applied to predict the future seasonal frequency of SDER in the RSBs for different SSP climate scenarios till the end of the twenty-first century. The performance of various GCMs in projecting the seasonal frequency of SDER is also evaluated.

How to cite: Varshney, A. and Srinivas, V. V.: A Statistical Methodology for Regional Scale Future Projection of the Seasonal Frequency of Sub-daily Extreme Rainfall Events, EGU General Assembly 2026, Vienna, Austria, 3–8 May 2026, EGU26-1058, https://doi.org/10.5194/egusphere-egu26-1058, 2026.

In various parts of arid and semi-arid region of India such as Rajasthan people are mainly depended on groundwater for fulfil their daily demands like drinking and watering their crops. However, in the Khetri mining region of Jhunjhunu district, extensive mining and smelting of copper and associated sulfide minerals have led to heavy metal contamination and a deterioration in groundwater quality. Therefore, this study evaluates the overall groundwater quality and the related human health risks in the region severely affected by copper mining and metallurgical activities. We have collected total 59 groundwater samples from both pre- and post-monsoon periods and were examined for physicochemical parameters, cations, anions, and heavy metals (Pb, Cd, Cr, Cu, Fe). Multivariate analysis, including PCA and correlation, revealed that geogenic processes, such as carbonate and silicate weathering, dominate natural groundwater chemistry. Whereas anthropogenic inputs from mining, ore processing, agriculture, and industrial waste significantly elevate toxic metal concentrations. The elevated level of Pb, Cd and Cr were detected across many locations, often exceeding permissible limits. Non-carcinogenic risks (HI) for Cr, Pb and Cd surpassed the safe thresholds in many locations, and carcinogenic risks (CR) for Cr, Cd, and Pb exceeds the permitted limit of 1 × 10⁻⁴ at multiple sites, indicating significant long-term health threats. The integrated EWQI–Monte Carlo framework thus combines the objectivity of entropy-based weighting with the statistical power of probabilistic simulation, enabling a more realistic and comprehensive evaluation of both groundwater quality and the related human health risks. In addition of this, the risk assessment for human health (HRA) revealed that children are at more danger than adults due to their greater exposure per body weight. These findings clearly indicate an urgent need for groundwater quality management through the adoption of remediation actions and the exploration of alternative sources to protect community health from contaminated groundwater.

How to cite: Kumar, M., Pathania, T., and Gaurav, K.: Integrated EWQI–Monte Carlo framework for assessing groundwater quality and health risk in the Khetri mining region of Jhunjhunu district, Rajasthan, India, EGU General Assembly 2026, Vienna, Austria, 3–8 May 2026, EGU26-1227, https://doi.org/10.5194/egusphere-egu26-1227, 2026.

EGU26-3097 | ECS | Posters virtual | VPS8

sMARt riverbank filtration monitoring: how environmental tracers and high-resolution data support resilient drinking water supply 

Krzysztof Janik, Arno Rein, and Sławomir Sitek

Riverbank filtration (RBF) is a managed aquifer recharge (MAR) technique applied worldwide, operating at the river–groundwater interface and offering the potential to enhance both groundwater quantity and quality, thereby improving drinking water supply security. However, its sustainable implementation requires a robust understanding of hydraulic interactions between surface water and groundwater as well as hydrochemical processes, supported by targeted local and regional monitoring strategies. Moreover, recharge efficiency and water quality benefits may vary in response to seasonal and event-based fluctuations in river flow, upstream contaminant inputs, and site-specific aquifer heterogeneity. In our study, we investigated river water–groundwater mixing, along with bank filtrate residence times, to improve the understanding of recharge dynamics at the Kępa Bogumiłowicka RBF site, a key regional water supply system located near Tarnów, southern Poland. Environmental tracers, including stable water isotopes, chloride concentration, water temperature and specific electrical conductance, were combined with high-resolution hydrological, meteorological and groundwater abstraction records. The results demonstrate that RBF is the dominant aquifer recharge mechanism, contributing more than 90% of the year-round yield from seven production wells located near the riverbank. Based on this case study, we propose a practical and transferable framework for efficient RBF monitoring and management. The approach integrates multi-tracer observations with ensemble end-member mixing analysis (EEMMA), combining discrete sampling with continuous physicochemical and hydrometeorological monitoring over at least one hydrological year. This cost-effective workflow enables robust recharge-source assessment, supports the evaluation of both quantitative and qualitative groundwater status, and facilitates proactive responses to upstream pollution events and rapid hydrological changes. As such, it provides a valuable template for the long-term, sustainable and resilient management of MAR-based drinking water resources in shallow alluvial aquifers.

How to cite: Janik, K., Rein, A., and Sitek, S.: sMARt riverbank filtration monitoring: how environmental tracers and high-resolution data support resilient drinking water supply, EGU General Assembly 2026, Vienna, Austria, 3–8 May 2026, EGU26-3097, https://doi.org/10.5194/egusphere-egu26-3097, 2026.

Accurate or exact estimations of hydraulic conductivity (K) and infiltration rate are crucial for understanding soil-water interactions, optimising irrigation practices, evaluating groundwater recharge potential, and designing drainage systems. Conventionally laboratory permeability tests and in-situ infiltrometer tests, provide direct estimates of soil hydraulic behaviour. However, these methods have limitations of their point-specific nature and are unable to capture subsurface heterogeneity across larger spatial scales. In contrast, the electrical resistivity tomography (ERT) technique offers a non-invasive geophysical approach that is capable of detecting subsurface variations in soil electrical resistivity properties. The electrical resistivity estimates can further be interpreted to analyse soil types, soil layer structures, moisture and mineral contents, and pore connectivity. These are ultimately related to soil hydraulic properties, such as hydraulic conductivity and soil-water interaction behaviour, such as vertical infiltration rates. One of the accurate methods of estimating K is a pumping test, which is expensive and time-consuming. Other methods include laboratory permeameter tests, which require the collection of soil samples from the field, which often are disturbed ones and thus may produce K values with considerable uncertainties. The primary goal of this study is to establish the relationship between hydraulic conductivity (K) and electrical resistivity (ER) to replace the tests mentioned above. The second objective of this study is to establish an ER-infiltration rate relationship to convert point-based infiltration measurements into area-wide infiltration maps using resistivity data, minimizing the number of infiltrometer tests needed, saving time, manpower, and resources. Field investigations executed here involve ERT surveys using different electrode configuration arrays, such as the Wenner, Schlumberger, and dipole-dipole, across selected test sites that represent various soil textures and moisture conditions. The resistivity profiles are inverted to generate 2D subsurface sections, enabling identification of moisture zones and shallow saturation patterns. Parallelly, laboratory permeability tests are carried out on undisturbed soil samples to determine hydraulic conductivity, while infiltrometer tests are performed to obtain field-scale infiltration characteristics and steady-state infiltration rates. The combined dataset provided a comparative evaluation of resistivity variations in relation to measured soil-hydraulic parameters. Once these relationships are established, ERT can move beyond the simple imaging and serve as a fast and cost-effective way to estimate how water moves through the soil over a wider area. This will significantly reduce the need for frequent point-based tests and help capture natural variations in soil conditions that are often required in hydrological studies. Site evaluations can thus become faster and efficient, while areas with higher infiltration potential can be identified with greater confidence, and the overall planning of irrigation, drainage, and groundwater recharge strategies becomes more informed and robust.

Keywords: Electrical Resistivity Tomography (ERT); Hydro-geophysical characterization; Hydraulic Conductivity; Infiltration Rate; Groundwater recharge; Soil Heterogeneity.

How to cite: Jaiswal, M., Ganguly, S., and Prashanth, T.: Integration of electrical resistivity tomography, permeability and infiltrometer tests for modelling hydraulic conductivity and infiltration rates in the field, EGU General Assembly 2026, Vienna, Austria, 3–8 May 2026, EGU26-3766, https://doi.org/10.5194/egusphere-egu26-3766, 2026.

EGU26-4336 | ECS | Posters virtual | VPS8

“Environmental implications of natural sources of arsenic and boron in hydrothermal bodies in the second biggest lake of México.” 

Betsabe Atalia Sierra Garcia, Selene Olea, Isabel Israde Alcántara, Ruth Esther Villanueva Estrada, Eric Morales Casique, Olivia Zamora Martínez, Javier Tadeo León, Martha Gabriela Gómez Vasconcelos, Ramón Avellán Denis, and Nelly Ramírez Serrato

Lake Cuitzeo is the second biggest lake in Mexico. It is placed in a semi-graben
structure, linked to volcanic rocks and fault systems. On the lake shoreline,
hydrothermal bodies emerge. These present arsenic and boron concentrations and
are used in thermal spas. Nevertheless, it is necessary to study the original and
behavior of these hydrothermal bodies, which provides information for the
sustainable management in order to benefit the local users.
The objective of this work is to determine the spatial distribution of the
hydrothermal manifestations, as well as their hydrogeochemical characteristics and
the temperature they reach at depth. The methodology consisted of sampling thermal wells and springs, along with laboratory determination of major ions and
trace elements. Subsequently, hydrogeochemical diagrams, isoline maps, and
geochemical indicators were used to understand their behavior. The results show
that the thermal sites have higher temperatures at depth and are associated with
the presence of faults.
Finally, the information compiled in this study may be useful for defining a safe and
feasible use of the geothermal resource for the communities inhabiting the study
area, whether for energy generation or for direct-use applications.

How to cite: Sierra Garcia, B. A., Olea, S., Israde Alcántara, I., Villanueva Estrada, R. E., Morales Casique, E., Zamora Martínez, O., Tadeo León, J., Gómez Vasconcelos, M. G., Avellán Denis, R., and Ramírez Serrato, N.: “Environmental implications of natural sources of arsenic and boron in hydrothermal bodies in the second biggest lake of México.”, EGU General Assembly 2026, Vienna, Austria, 3–8 May 2026, EGU26-4336, https://doi.org/10.5194/egusphere-egu26-4336, 2026.

EGU26-5224 | ECS | Posters virtual | VPS8

Assessing spatio-temporal variations of groundwater level in the Damodar River basin, India using MODFLOW 

Ankita Kumari and Tinesh Pathania

The global demand for groundwater is expected to increase due to changing hydrological and population patterns. Hence, spatio-temporal characterization of groundwater is crucial for its sustainable management options. This study introduces a fully distributed groundwater simulation model, based on the MODFLOW framework, to understand the fluctuations in the groundwater table and basin-scale hydrological dynamics of the Damodar River basin (DRB) in India. Monthly simulations were conducted over a 5-year period (2015–2020) to quantify changes in groundwater head and interactions between the river aquifer and the watershed. Real field abstraction data were used to represent pumping components of water use in the MODFLOW model. Parameter Estimation Test (PEST) based calibration and validation were performed to estimate the unknown hydraulic conductivity and recharge. The model outcomes reasonably align with heads at the observation wells, thereby improving our understanding of the water table in large river basins. The findings highlight the influence of monsoon precipitation and the overall changes observed in DRB. Furthermore, the study combined the tributary stream network and PEST-calibrated recharge, which further enhanced the physical representation and accuracy of the model despite the additional data requirements. Decline in groundwater level was observed, which potentially highlights unsustainable water management practices in the river basin. The results underscore the significance of numerical groundwater models, which are crucial for informed decision-making in robust groundwater planning interventions.


Keywords: Groundwater, MODFLOW, PEST, recharge, river basin

How to cite: Kumari, A. and Pathania, T.: Assessing spatio-temporal variations of groundwater level in the Damodar River basin, India using MODFLOW, EGU General Assembly 2026, Vienna, Austria, 3–8 May 2026, EGU26-5224, https://doi.org/10.5194/egusphere-egu26-5224, 2026.

EGU26-6358 | Posters virtual | VPS8

Spatial Variability of Uranium in Shallow Aquifers of Semi-Urban Indian Landscapes 

Deepak Kumar, Shubhi Khare, and Sandhya Kurre

Uranium contamination in shallow aquifers is emerging as a concern for groundwater-quality issues across several parts of India. The present study evaluates the spatial distribution, concentration levels in shallow groundwater systems of selected semi-urban regions of India. Secondary data used in this assessment were obtained from the Central Ground Water Board (CGWB), covering semi-urban areas across all Indian states. The results reveal pronounced spatial heterogeneity in uranium concentrations, with numerous locations exceeding the permissible limits prescribed by the World Health Organization (WHO) and the Bureau of Indian Standards (BIS) for drinking water. Analysis of uranium concentration data for the period 2024–2025 indicates that shallow aquifers in parts of Karnataka, Punjab, and Rajasthan exhibit average uranium concentrations of approximately 133 ppb, 48 ppb, and 79 ppb, respectively, while maximum concentrations of 488 ppb, 202 ppb, and 119 ppb respectively, were recorded at select locations. A substantial proportion of groundwater samples were found to exceed WHO guideline values, highlighting widespread contamination concerns. The findings of this study offer critical insights for water-resource managers and policymakers in developing strategies to protect drinking-water security in uranium-affected regions of India.

How to cite: Kumar, D., Khare, S., and Kurre, S.: Spatial Variability of Uranium in Shallow Aquifers of Semi-Urban Indian Landscapes, EGU General Assembly 2026, Vienna, Austria, 3–8 May 2026, EGU26-6358, https://doi.org/10.5194/egusphere-egu26-6358, 2026.

EGU26-7784 | Posters virtual | VPS8

Research on the Adaptation Strategies of Urban Stormwater Drainage to Increased Rainfall Due to Climate Change 

ShengHsueh Yang, DerRen Song, MaoSong Huang, JyhHour Pan, XiJun Wang, ChenWei Chen, and KehChia Yeh

A 2024 climate change study in Taiwan indicated an increase in rainfall of approximately 10-35%, causing flooding in some urban areas where stormwater drainage systems exceeded their original design protection standards. Furthermore, urban stormwater drainage systems improvements in Taiwan often face complex and intertwined spatial issues related to road traffic and underground utility lines, making rapid engineering improvements difficult. Therefore, to address the threats already posed by climate change, the use of big data monitoring of urban areas and surrounding regions, along with rapid AI-powered algorithms for drainage systems, is imperative. The New Taipei City Government, in order to manage urban water information, has developed a series of adaptation strategies for its drainage system. These strategies address environmental factors such as drainage sections affected by tides and storm surges, rainfall characteristics in nearby mountainous areas, and sections with gates and pumping stations that cannot drain by gravity. The aim is to lower urban drainage levels to prevent flooding and shorten flooding duration. This includes practical operational recommendations and early flood warnings. The method is based on historical practical experience and AI-generated water level forecasts to conduct drainage system decision analysis and management value setting. It combines real-time rainfall data from the Internet of Things, road flooding sensors, road CCTV, stormwater sewer water levels, and pumping station water levels. The data used includes actual data from the past 3 hours, forecasted rainfall for the next 6 hours, tidal changes, and real-time water level information at various monitoring locations to formulate adjustment strategies. Synchronous information is released within the drainage system to systematically set stormwater sewer water levels, treating stormwater sewers as flood retention spaces for monitoring and water level control. Based on operational experience gained from the past 3 years of implementation, this method will be used in the future to address the threats posed by increased rainfall due to climate change and to formulate urban flood control strategies to reduce disaster losses.

How to cite: Yang, S., Song, D., Huang, M., Pan, J., Wang, X., Chen, C., and Yeh, K.: Research on the Adaptation Strategies of Urban Stormwater Drainage to Increased Rainfall Due to Climate Change, EGU General Assembly 2026, Vienna, Austria, 3–8 May 2026, EGU26-7784, https://doi.org/10.5194/egusphere-egu26-7784, 2026.

EGU26-8457 | Posters virtual | VPS8

Using a novel chain of models to mimic source aquifer depressurisation  impacts across the Doongmabulla Springs Complex , Queensland, Australia 

Anne Gibson, Richard Cresswell, Jarrah Muller, Samantha Capon, Rebekah Grieger, Penn Lloyd, David Stanton, and Miles Yeates

The Doongmabulla Springs Complex (DSC) is a cluster of groundwater-dependent wetlands located in central Queensland, Australia. The DSC has over 160 individual springs ranging from over 9 ha, with pools of water, down to vents less than 10 cm across, supporting individual grasses. The springs are home to a variety of plant species (many endemic) that are adapted to the unique physico-chemical parameters of the groundwater discharge on which they rely. Wetlands and scalds of the DSC support a listed Threatened Ecological Community of species dependent on this natural discharge of groundwater from underlying artesian aquifers of the Galilee Basin. The springs are protected under Australia’s State and Commonwealth Environmental legislation. 

Aquifer depressurisation due to mine dewatering occurring to the east of the springs has the potential to threaten spring biodiversity in future by reducing groundwater discharge and consequent wetland persistence. Assessing the likelihood and possible magnitude of these threats requires a multi-disciplinary modelling approach to address complex groundwater – surface water – ecosystem interactions: 1) define groundwater pressure change probabilities; 2) simulate likely wetland response; and 3) evaluate potential ecological impacts. Once such a modelling chain is in place, impact mitigation may be assessed, considering the effect of interventions at each stage of the chain.

To support the numerical modelling, extensive hydrological, ecological and physio-chemical data collection and analysis was undertaken to understand spring wetland area and species microhabitats and distributions over multiple scales and time frames, including seasonal and inter-annual variability. Generation of realistic and defensible conceptualisations for the springs is critical and is described in a companion paper (Cresswell, et al., these proceedings).

Regional numerical groundwater modelling (MODFLOW) generated potential groundwater pressure change responses relevant to the DSC source aquifers. Potential groundwater depressurisation over time at the individual spring locations was utilised in a wetland water balance model (GoldSim) to describe wetland persistence, size and seasonality. Water balance outputs were translated into spatial representations of predicted spring hydrology (TUFLOW), generating area and shape configurations that could be compared to historical wetland persistence data and then utilised to predict potential effects on suitable habitat for key flora species under a range of scenarios including mining-related groundwater drawdown and climate change using maximum entropy species distribution modelling (MaxEnt). This latter process relates known species’ occurrences to measurable variables that describe the environment (such as soil moisture, soil salinity and pH) to predict the presence or absence of a species at unsampled locations and under future groundwater drawdown scenarios. 

The results of the application of this novel chain of models have informed a revised impact assessment for the potential impacts of mine dewatering on the unique vegetation communities at the Doongmabulla Springs Complex and enables development of targeted mitigation approaches for individual wetlands and species.

How to cite: Gibson, A., Cresswell, R., Muller, J., Capon, S., Grieger, R., Lloyd, P., Stanton, D., and Yeates, M.: Using a novel chain of models to mimic source aquifer depressurisation  impacts across the Doongmabulla Springs Complex , Queensland, Australia, EGU General Assembly 2026, Vienna, Austria, 3–8 May 2026, EGU26-8457, https://doi.org/10.5194/egusphere-egu26-8457, 2026.

EGU26-8525 | ECS | Posters virtual | VPS8

Seasonal water uptake pattern in Agathis australis (kauri), a large and long-lived Southern Hemisphere conifer, using water stable isotopes  

Melanesia Boseren, Luitgard Schwendenmann, and Gretel Boswijk

Understanding seasonal water uptake depth (WUD) in trees is critical for assessing trees’ physiological responses to seasonal variability in microclimatic conditions and soil water availability. While broadleaf and conifer species in the Northern Hemisphere have been widely studied, studies of seasonal changes in WUD of large and long-lived evergreen conifers in the Southern Hemisphere are rare.

We investigated the effect of season and tree size on the water uptake pattern of Agathis australis (kauri), a large and long-lived endemic conifer, over an 18-month period. Our study site, a remnant kauri-dominated forest, is located in West Auckland, northern New Zealand. We collected stem cores from seven kauri trees (n = 3 < 50 cm diameter, n = 4 > 100 cm diameter) and soil samples underneath each of the seven trees (organic layer (OL), 0-10 cm, 10-20 cm, 20-30 cm, 30-50 cm, 50-70 cm, 70+ cm) across six seasons (austral spring 23,  austral summer 23-24, austral autumn 24, austral winter 24, austral spring 24, and austral summer 24-25). Water from soil and stem cores was extracted using cryogenic vacuum extraction. We measured δ2H and δ18O in all samples and used a Bayesian mixing model (MixSIAR) to determine WUD.

Our preliminary results show that across season and tree size, kauri obtained a larger proportion of water from the shallow layer (OL to 30 cm depth; ~ 60%) compared to ~ 40% sourced from layers below 30 cm. There was greater reliance on water from the shallow layer (up to 75%) during austral summer 23-24 and 24-25. We did not observe strong differences in WUD between small and large trees across our study seasons. These insights advance ecohydrological research on Southern Hemisphere evergreen conifers and highlight the importance of understanding species-specific response to microclimatic conditions and changing water availability.

How to cite: Boseren, M., Schwendenmann, L., and Boswijk, G.: Seasonal water uptake pattern in Agathis australis (kauri), a large and long-lived Southern Hemisphere conifer, using water stable isotopes , EGU General Assembly 2026, Vienna, Austria, 3–8 May 2026, EGU26-8525, https://doi.org/10.5194/egusphere-egu26-8525, 2026.

In arid and semi-arid regions, the agriculture thrives on the use of irrigation systems such as drip and sprinkler irrigation which ensures the higher irrigation application efficiencies. However, the planning and design of drip irrigation systems continue to rely on generic understanding and manual hydraulic calculations which often leads to sub-optimal performance. The present study addresses this gap by using a numerical model for analysing the drip irrigation for Okra Cultivation in a semi-arid district of Udaipur, Rajasthan, India. Therefore, the objectives of this study are analysing the hydraulic performance of the given network of drip irrigation using a numerical model and evaluate its adequacy and operational efficiency.

The hydraulic adequacy is determined using EPANET 2.2 modelling tool employing pressure driven demand (PDD) approach. The temporal variability in the behaviour of system was captured by running the extended period simulation model. The model incorporates operational control rules to define the variable demands for the different phases of the growth of the plant and scheduling the pump and valve operations thereby enabling the digital twin of the drip irrigation system. The source of water taken as well is explicitly represented in the model while the filtration unit is represented as a non-return valve with high loss coefficient. In addition to the watering, the fertigation of the crops is also simulated in the model according to the fertigation schedule.

The hydraulic performance of the irrigation system is evaluated using standard performance indicators  such as the Coefficient of Uniformity, Coefficient of Variation, and Distribution Uniformity. Furthermore, the reliability of system performance is assessed using network reliability parameter.  Thus, the study will assist farmers and stakeholders in achieving optimal operation of drip irrigation systems by addressing and minimizing the multiple technical and operational challenges associated with this irrigation method.

How to cite: Gupta, K.: Numerical Modelling of Drip Irrigation to Improve Water Use Efficiency in Semi-Arid Agroecosystems, EGU General Assembly 2026, Vienna, Austria, 3–8 May 2026, EGU26-8945, https://doi.org/10.5194/egusphere-egu26-8945, 2026.

EGU26-9012 | ECS | Posters virtual | VPS8

Ecohydrological Modelling of Annual Water Yield and Water-Related Ecosystem Services in the Semi-Arid Region of Warangal, India 

Swetha Dasari, Manali Pal, and Venkata Reddy Keesara

Urban and peri-urban regions in semi-arid India are increasingly exposed to contrasting climatic extremes, namely water scarcity and flooding, driven by complex interactions between anthropogenic pressures and biophysical processes. In this context, the present study investigates long-term changes in the annual water yield (AWY) ecosystem service across sub-watersheds of the Godavari River Basin encompassing the semi-arid Warangal district, Telangana, India. The InVEST AWY model is applied for two representative years, 1995 and 2025. The results indicate that AWY ranges from 460-890 mm yr⁻¹ in 1995, with relatively higher values in the north-eastern sub-watersheds, but declines across most sub-watersheds by 2025 to 220-690 mm yr⁻¹. The annual precipitation found to be 1400 to 1230 mm yr⁻¹ over the study period, while potential evapotranspiration increase substantially from 2253 to 2955 mm yr⁻¹, enhancing atmospheric evaporative demand and reducing water availability. Sensitivity analysis (expressed in terms of elasticity, E), shows that AWY is highly sensitive to precipitation variability (E = 1.84) and moderately negatively sensitive to urban-related biophysical parameters (root restricting depth: E = -0.42, crop coefficient (Kc): E = -0.39).  In contrast, sensitivity to potential evapotranspiration is lower (E = -0.36), highlighting the combined influence of climatic forcing and urban expansion. Spatially, urban land use in 1995 is concentrated in the central region, with cropland and forest dominating the western and eastern parts, respectively, yielding a mean AWY of 718.51 mm yr⁻¹. By 2025, relatively higher AWY zones shift toward the north-eastern region, reflecting reduced evapotranspiration associated with urban expansion; however, the overall mean AWY declines to 476.36 mm yr⁻¹, indicating that land-use changes influenced spatial patterns while climatic factors governed the temporal decline. The decline in AWY between 1995 and 2025 corresponds with reduced ecosystem service values (ESV) for water-yield related regulation services, particularly water regulation (ESV1995 = 16.37 to ESV2025 = 12.91 million US$) and water supply (ESV1995 = 84.73 to ESV2025 = 73.69 million US$). Overall, the findings demonstrate the joint role of climate variability and urbanization in shaping sub-watershed water yield and associated ecosystem services, providing insights for climate-responsive urban and landscape management.

How to cite: Dasari, S., Pal, M., and Keesara, V. R.: Ecohydrological Modelling of Annual Water Yield and Water-Related Ecosystem Services in the Semi-Arid Region of Warangal, India, EGU General Assembly 2026, Vienna, Austria, 3–8 May 2026, EGU26-9012, https://doi.org/10.5194/egusphere-egu26-9012, 2026.

EGU26-10663 | ECS | Posters virtual | VPS8

Groundwater Level Prediction in Urban Areas under Data Scarcity Using a Regionalized LSTM Framework 

Aatish Anshuman and Manish Panigrahi

Scarcity of groundwater level (GWL) data poses a significant challenge to effective groundwater resource modeling, particularly in urban and peri-urban regions where anthropogenic influences further complicate hydrological processes. In this study, a machine learning–based framework is developed to predict groundwater levels for Bhubaneswar city, India, using Long Short-Term Memory (LSTM) neural networks. Given the data-driven nature of machine learning models and the limited availability of long-term observations, a regionalized modeling approach is adopted by coalescing GWL measurements from 31 closely located monitoring wells. To enable the model to capture well-specific variability, each well is characterized using static indicators derived from hydrological and socio-environmental datasets. Multiple combinations of predictor variables are evaluated to identify those most effective in representing groundwater level dynamics. The optimal model, trained on aggregated regional data, demonstrates strong predictive performance during testing, with a correlation coefficient (R) of 0.89 and a Nash–Sutcliffe Efficiency (NSE) of 0.79. The proposed regionalized LSTM framework shows promise for reliable groundwater level prediction at individual wells in data-scarce urban settings, offering a practical tool for groundwater assessment and management.

How to cite: Anshuman, A. and Panigrahi, M.: Groundwater Level Prediction in Urban Areas under Data Scarcity Using a Regionalized LSTM Framework, EGU General Assembly 2026, Vienna, Austria, 3–8 May 2026, EGU26-10663, https://doi.org/10.5194/egusphere-egu26-10663, 2026.

EGU26-10790 | ECS | Posters virtual | VPS8

Ranked Multiscale Catalog of Precipitation Extremes using Cross Scale Extremity for the Indian Peninsular Region 

Sree Anusha Ganapathiraju, Paul Voit, Norbert Marwan, and Maheswaran Rathinasamy

Extreme precipitation events (EPEs) are expected to increase in frequency and intensity under global warming and can trigger various impacts such as floods and landslides, which can undermine the socio-economic stability by raising the risk of loss of human lives, infrastructure failure and agricultural losses. Consequently, the study of hydroclimatic extremes has grown substantially in the recent decades, supported by high-resolution data and multivariate event-based analytical frameworks that improve understanding and resilience to climate-related risks. The rainfall induced impacts often show a compound nature because the underlying processes are scale-dependent and can overlap and intensify each another. Therefore it is important to consider extremeness across spatio-temporal scales when assessing EPEs. However, the the complex topography and diverse climatic conditions in the Indian Peninsular region pose a key challenge in assessing and characterizing the EPEs. In this context, a comprehensive ranked catalog of EPEs is developed from the 73 year long data set, based on their extremity across spatio-temporal scales. To increase the robustness of the underlying statistical analysis and to make an optimal use of the data, a combination of the peak-over-threshold (POT) method and the cross-scale weather extremity index (xWEI) is introduced to quantify the spatiotemporal extremity. In addition, the study exemplifies the applicability of POT method and compares the resulting extremeness with the conventional annual maxima approach. The catalog identifies EPEs that are jointly extreme across spatial and temporal scales and distinguishes short-lived localized storms from persistent, widespread events, thereby enabling a systematic characterization of EPE typologies. By linking each EPEs xWEI value to the season and meteorological divisions, the catalog offers a consistent basis for comparing historical events, and advances process-based understanding of regional hazard regimes. In summary, the resulting catalog can be a valuable tool in improving the robustness of quantitative risk assessments and enhancing the reliability of climate change attribution analyses.

How to cite: Ganapathiraju, S. A., Voit, P., Marwan, N., and Rathinasamy, M.: Ranked Multiscale Catalog of Precipitation Extremes using Cross Scale Extremity for the Indian Peninsular Region, EGU General Assembly 2026, Vienna, Austria, 3–8 May 2026, EGU26-10790, https://doi.org/10.5194/egusphere-egu26-10790, 2026.

Groundwater contamination arising from mining activities represents a persistent and complex environmental challenge, particularly in coal-bearing regions where sulfide-rich mine overburden is extensively exposed to atmospheric conditions. Upon interaction with oxygen and moisture, pyrite oxidation generates acidic by-products and mobilizes dissolved constituents, such as ferrous, ferric iron, sulfate, and hydrogen ions. Understanding and predicting the spatiotemporal evolution of contaminant plumes in such systems remains challenging due to the coupled nature of variably saturated flow, multicomponent geochemical reactions, and microbially mediated processes. This study develops a comprehensive numerical modeling framework for simulating contaminant transport and remediation processes associated with oxidation reactions in unsaturated mine overburden systems. Variably saturated flow is represented through discretization of the governing flow equation in the vertical domain using hydraulic head-based parameters, and the resulting tridiagonal system of linear equations is efficiently solved using the Thomas algorithm. The model couples variably saturated groundwater flow, represented by Richards’ equation, with multicomponent reactive transport equations describing the generation and migration of key oxidation products (Fe²⁺, Fe³⁺, SO₄²⁻, and H⁺). In addition, sulfate reduction mediated by sulfate-reducing bacteria (SRB) is incorporated to capture biologically driven attenuation mechanisms relevant to natural and engineered remediation scenarios. Simulations are performed for a total of 22 years (8030 days). A time step of 0.1 day and a grid size of 0.2 m are identified as the optimal choices for the simulations. The simulation results indicate that the concentrations of oxidation-derived species decrease significantly from 200 to 40 mol/m³ in clay, 300 to 95 mol/m³ in loam, and 1 to 0.2 mol/m³ in sand. Sensitivity analysis shows that peak sulphate sensitivity in clay with a sensitivity index (SI) of 0.65 and in loam with an SI of 0.5 under high saturation condition (water content, wc = 0.9), while ferrous ions exhibit maximum sensitivity in loam under low saturation condition (wc = 0.2) with an SI of 750. The findings support the development of predictive frameworks that can inform sustainable groundwater management, optimize remediation strategies, and address key challenges in the practical application of contaminant transport models.

How to cite: Roy, G. and Sivakumar, B.: Hydrogeochemical Forensics of Pyrite Oxidation in Unsaturated Mine Overburden: A Numerical Simulation Framework for Groundwater Contaminant Migration., EGU General Assembly 2026, Vienna, Austria, 3–8 May 2026, EGU26-12747, https://doi.org/10.5194/egusphere-egu26-12747, 2026.

EGU26-13428 | ECS | Posters virtual | VPS8

Hydrogeological and Hydrochemical Characterization of Quarry Lakes in the Piedmont Alluvial Plain 

Giovanni Pigozzi, Alessandra Bianco Prevot, Lucia Biasio, Luca Carena, Daniele Cocca, Domenico Antonio De Luca, Elena Egidio, Manuela Lasagna, and Andrea Mittaridonna

Quarry lakes, primarily located in alluvial plains, form as a result of the deepening of quarry excavations beyond the water table of the shallow aquifer.

They allow for full exploitation of the deposit without excessively damaging the landscape, limiting land consumption. Quarry lakes play also an important ecological and landscape role, because they provide (i) habitats for aquatic plants, aquatic animal species and birds, and (ii) recreational opportunities. Additionally, they contribute to management of water resources and mitigation of flood risks.

In the Piedmont region (NW Italy), quarry lakes are numerous and of considerable size due to the high market demand for concrete and aggregates. These quarry lakes are mostly located along the Po River, the main river of the region, and its main tributaries.

This study focused on six active quarry lakes and, primarily, a hydrogeological reconstruction of the surrounding areas was carried out. Lake water samples were collected in the summer and autumn of 2025 and analysed for hydrochemical composition. Field parameters, including pH, electrical conductivity, and water temperature, were also recorded.

The hydrochemical results, compared with data from the regional network of groundwater monitoring wells, reveal a strong correlation between lake waters, the surface aquifer, and watercourses. The chemical characterization of these quarry lakes supports the study of their  photochemical activity, and the assessment of their potential use as nature-based basins for quaternary treatment of water, thus allowing to minimize the overexploitation of groundwater resources in a context of more frequent drought events due to climate change.

How to cite: Pigozzi, G., Bianco Prevot, A., Biasio, L., Carena, L., Cocca, D., De Luca, D. A., Egidio, E., Lasagna, M., and Mittaridonna, A.: Hydrogeological and Hydrochemical Characterization of Quarry Lakes in the Piedmont Alluvial Plain, EGU General Assembly 2026, Vienna, Austria, 3–8 May 2026, EGU26-13428, https://doi.org/10.5194/egusphere-egu26-13428, 2026.

EGU26-15246 | Posters virtual | VPS8

Nitrate behavior in a groundwater flow system that discharges into the largest lakes of Mexico 

Aurora Guadalupe Llanos Solis, Selene Olea Olea, Eric Morales Casique, Olivia Zamora Martínez, Javier Tadeo León, Martha Gabriela Goméz Vasconcelos, Denis Ramón Avellán, and Nelly Ramírez Serrato

The nitrate input in the groundwater and surface water is the main source of contamination in many areas of the world. In Mexico, agricultural activities depending of groundwater and surface water. The groundwater flow system (GFS) is a single system with recharge and discharge zone were the interactions between surface and groundwater are present. In Mexico, the Cuitzeo GFS is a is one of the most agriculturally developed areas in central Mexico and includes the second and third largest lakes, lakes Cuitzeo and Patzcuaro.
The main object of this work is to analyze the nitrate behavior in groundwater and lake waters to understand the spatial changes over two years.
The methodology includes sampling of major ions of 39 sites, including wells, dugwells, springs, and lakes in the dry season for the years 2024 and 2025. Additionally, hydrogeochemical diagrams and spatial analysis were developed. The nitrate concentrations in this country are regulated by Mexican rules.
The results show that 11 sites exceed the permitted limit of concentrations according to these rules. Nitrates predominate in the zone of major population close to Morelia city and close to Lake Cuitzeo. Whereas ammonium is present close to the lake Patzcuaro. These distributions are in groundwater and surface waters, reflecting the same processes in both water bodies. This area presents a rapid expansion and intensification of berry and avocado cultivation, which have displaced local crops and driven unsustainable patterns of agricultural water use.
This study provided valuable information about the source and quantification of nitrate species contaminations, which can help to generate new management strategies.

How to cite: Llanos Solis, A. G., Olea Olea, S., Morales Casique, E., Zamora Martínez, O., Tadeo León, J., Goméz Vasconcelos, M. G., Avellán, D. R., and Ramírez Serrato, N.: Nitrate behavior in a groundwater flow system that discharges into the largest lakes of Mexico, EGU General Assembly 2026, Vienna, Austria, 3–8 May 2026, EGU26-15246, https://doi.org/10.5194/egusphere-egu26-15246, 2026.

EGU26-15319 | ECS | Posters virtual | VPS8

Groundwater quality assessment in semi-arid Morocco: spatial analysis and monitoring 

Aicha Mouncif, Oussama Nait-Taleb, Morad Karroum, Samira Krimissa, Mustapha Namous, and Abdenbi Elaloui

Groundwater is a critical water resource in Morocco, particularly in semi-arid regions where agricultural demand and local uses place increasing pressure on aquifers. In this setting, a clear and spatially explicit assessment of groundwater quality is essential to support monitoring strategies and contribute to more sustainable water management.

This study presents an approach for characterizing groundwater quality in a semi-arid area of Morocco based on physico-chemical analyses of groundwater samples collected from wells and springs. Water quality is identified through the computation of a groundwater quality index derived from multiple measured parameters, providing a synthetic and comparable metric across sampling points. The results are then integrated within a Geographic Information System (GIS) framework to explore spatial patterns and support interpretation at the territorial scale. Spatial interpolation is used to map the distribution of both the individual parameters and the quality index, highlighting local contrasts and potential hotspots within the study area.

Overall, the findings indicate generally satisfactory groundwater quality, while also revealing localized variations that justify targeted follow-up and site-specific attention. The proposed workflow is transferable and can be adapted to other semi-arid settings in Morocco to support diagnosis, prioritization of actions, and long-term, sustainable groundwater resource management.

Keywords : Groundwater quality; Morocco; semi-arid environment; physico-chemical parameters; water quality index; GIS; spatial interpolation; mapping; sustainable water management


How to cite: Mouncif, A., Nait-Taleb, O., Karroum, M., Krimissa, S., Namous, M., and Elaloui, A.: Groundwater quality assessment in semi-arid Morocco: spatial analysis and monitoring, EGU General Assembly 2026, Vienna, Austria, 3–8 May 2026, EGU26-15319, https://doi.org/10.5194/egusphere-egu26-15319, 2026.

EGU26-16051 | ECS | Posters virtual | VPS8

Characterization of Paleochannel and Floodplain Aquifers Using Vertical Electrical Sounding: A Case Study from the Western Part of Bengal Basin 

Ankit Dipta Dutta, Akhilesh Kumar Yadav, Abhijit Mukherjee, and Probal Sengupta

The subsurface architecture of paleochannel and floodplain deposits, as well as their hydrogeological significance, remains insufficiently characterized in the Ganges upper delta region. The present study evaluates the hydrogeological implications for groundwater resource assessment and aquifer vulnerability in Chakla, North 24 Parganas, West Bengal. Descriptions and discrimination of different subsurface regimes are provided based on electrical resistivity. Vertical Electrical Sounding (VES) surveys are conducted at 51 sites, distributed across paleochannel (np = 31) and floodplain (nf = 20) geomorphic settings. Six-layer resistivity models are developed for each site through inversion analysis. Regime-specific hydrogeological properties are quantified through non-parametric statistical testing (Wilcoxon rank-sum and Kruskal-Wallis) on the modeled VES data. Furthermore, longitudinal conductance and transverse resistance, as obtained from the Dar-Zarrouk parameter analysis, are explored. VES inferences are found to be in well accordance with the borehole lithology from six cores. Paleochannel aquifers and floodplain aquitards exhibit significantly different resistivity distributions due to different grain sizes and saturation. Paleochannel sites reveal higher median resistivity (49.5 Ω·m) and coarser grain sizes, indicating high-capacity aquifers with enhanced investigation depth. On the other hand, floodplain sites are characterized by lower resistivity (19.2 Ω·m), finer grain sizes, and low-permeability confining layers. The findings of the present study support targeted groundwater exploration in paleochannel zones and aquifer protection in floodplain areas, providing key insights for water supply assessment and contaminant vulnerability.

Keywords: Vertical Electrical Sounding (VES), Paleochannel aquifer, Electrical resistivity, Dar-Zarrouk parameters, Hypothesis testing, Non-parametric statistics

How to cite: Dutta, A. D., Yadav, A. K., Mukherjee, A., and Sengupta, P.: Characterization of Paleochannel and Floodplain Aquifers Using Vertical Electrical Sounding: A Case Study from the Western Part of Bengal Basin, EGU General Assembly 2026, Vienna, Austria, 3–8 May 2026, EGU26-16051, https://doi.org/10.5194/egusphere-egu26-16051, 2026.

EGU26-16155 | ECS | Posters virtual | VPS8

Microbial Heterogeneity Outweighs Sediment Variability in Regulating Hyporheic Nitrogen Removal 

Yang Xian, Zhiping Xiao, Zhang Wen, and Stefan Krause

The hyporheic zone serves as a critical hotspot for nitrogen attenuation, driven by flow in streambed sediments, biogeochemical reactions, and enhanced microbial activity. It has, however, yet to be determined how the interaction of heterogeneity in sedimentary physical (e.g., permeability) and chemical (e.g., organic matter content) properties influences nitrogen cycling in complex hyporheic environments. Here we developed numerical models coupling porous flow, reactive transport, and microbial dynamics for realistic heterogeneous streambed scenarios. Simulations reveal that small-scale spatial variations in sediments physical and chemical properties exert negligible effects on nitrogen removal, whereas the spatial heterogeneity in functional microbial biomass dominates nitrogen removal dynamics. This is caused by biofilm-induced bioclogging that drastically reduces hyporheic exchange, thereby weakening the role of sedimentary heterogeneity. This study represents the first quantitative assessment of how sedimentary and microbial spatial heterogeneities jointly regulate nitrogen removal in hyporheic systems, offering critical insights for predictive modeling of bedform interfaces.

How to cite: Xian, Y., Xiao, Z., Wen, Z., and Krause, S.: Microbial Heterogeneity Outweighs Sediment Variability in Regulating Hyporheic Nitrogen Removal, EGU General Assembly 2026, Vienna, Austria, 3–8 May 2026, EGU26-16155, https://doi.org/10.5194/egusphere-egu26-16155, 2026.

EGU26-16236 | ECS | Posters virtual | VPS8

Flood-Driven Groundwater Recharge for India  

Ritaja Roy and Vimal Mishra

Rapid groundwater depletion, driven by intensive pumping and growing climate variability, poses a critical threat to water security across India. Concurrently, climate change is intensifying the frequency and magnitude of flood events, generating episodic but potentially significant opportunities for natural aquifer replenishment. However, the contribution of floods to groundwater in India remains poorly quantified. In this study, we systematically quantify flood‐driven groundwater recharge across the major river basins of India. Using the integrated, physically based ParFlow-CLM hydrological model, we evaluate three fundamental attributes of flood recharge: (i) the contribution of flood runoff to total groundwater recharge, (ii) the temporal lag between flood peaks and aquifer response, and (iii) the persistence of flood‐induced recharge signals following an event. These metrics are evaluated across diverse hydrogeological settings to identify where floodwaters are most effectively captured and retained within aquifers. Our results show strong spatial contrasts in flood recharge efficiency. The highly permeable alluvial aquifers of the Indus, Ganga and Brahmaputra basins exhibit the highest flood-to-recharge contribution and the longest persistence, indicating a strong capacity to capture and retain floodwater. In contrast, less permeable and fractured hard-rock aquifers in large parts of central and southern India show weaker and shorter-lived recharge responses to floods. By explicitly linking flood dynamics to subsurface hydrologic response, this study provides a framework for identifying priority regions for flood‐based groundwater management. The results demonstrate how increasing flood extremes under climate change can be strategically harnessed to enhance the resilience of India’s groundwater resources.

How to cite: Roy, R. and Mishra, V.: Flood-Driven Groundwater Recharge for India , EGU General Assembly 2026, Vienna, Austria, 3–8 May 2026, EGU26-16236, https://doi.org/10.5194/egusphere-egu26-16236, 2026.

EGU26-16340 | Posters virtual | VPS8

Propagation of Meteorological Drought to Groundwater Drought in India 

Aayush Aayush and Vimal Mishra

Groundwater drought poses a growing threat to water security in India, as groundwater supplies support agriculture, ecosystems, and domestic use. Although meteorological and hydrological droughts and their propagation have been studied, the propagation of drought into groundwater systems in India has not been examined. In this study, we employed Standardized Precipitation Index (SPI), the CGWB-based Standardized Groundwater Index (SGI), and the GRACE-based Groundwater Storage Anomaly (GWSA) to investigate meteorological drought and groundwater drought across the Indian region. We estimated drought propagation duration, recovery duration, mean drought duration, and maximum drought duration. The results show that regions in the north, northwest, northeast, and a few regions in southern India have the longest propagation time from meteorological to groundwater drought, while other zones, such as central India, have relatively shorter propagation times. We also find that regions in northeast and northwest India recover faster from groundwater droughts than other regions. Our results also show that the Dryness Index (DI), Seasonality Index (SI), and Land Surface Controls (NDVI, soil moisture (SM), and Evapotranspiration (ET)) play a significant role in the propagation time of meteorological to groundwater droughts across different zones. Overall, understanding the propagation and recovery plays a vital role in aiding effective management and planning of groundwater resources in India.

How to cite: Aayush, A. and Mishra, V.: Propagation of Meteorological Drought to Groundwater Drought in India, EGU General Assembly 2026, Vienna, Austria, 3–8 May 2026, EGU26-16340, https://doi.org/10.5194/egusphere-egu26-16340, 2026.

EGU26-17910 | Posters virtual | VPS8

Understanding the drivers of hydraulic redistribution under salt stress 

Dvir Hochman and Nimrod Schwartz

Hydraulic redistribution (HR), the passive movement of water through plant root systems from wet to dry soil layers, plays a critical role in maintaining plant water status and nutrient uptake in water-limited environments. While HR is well-documented under drought, its dynamics become significantly more complex in saline conditions where total soil water potential is driven by both matric and osmotic components.

In this study, we employed a split-root experimental design using young avocado trees to isolate and quantify HR. The root system of each tree was divided between two pots: a "wet pot" maintained at field capacity and a "drying pot" where irrigation was withheld. We utilized high-precision weighing lysimeters to monitor nocturnal weight changes in the drying pot, alongside soil moisture sensors and isotopic water labelling to track water movement.

Our preliminary results confirm the occurrence of HR in young avocado trees under non-saline control conditions. The phenomenon was clearly identified in two out of three trees monitored during the initial experimental phase, as evidenced by nocturnal increases in soil water content and corresponding weight changes in the drying pots. These findings provide a foundational baseline for the next phase of the research, which aims to evaluate how increasing levels of salt stress (NaCl) in the wet pot influence the osmotic gradients and root hydraulic conductivity that drive HR. By comparing control and saline treatments, we seek to determine whether salinity-induced changes in total water potential suppress or shift the patterns of hydraulic redistribution.

How to cite: Hochman, D. and Schwartz, N.: Understanding the drivers of hydraulic redistribution under salt stress, EGU General Assembly 2026, Vienna, Austria, 3–8 May 2026, EGU26-17910, https://doi.org/10.5194/egusphere-egu26-17910, 2026.

Soil Aquifer Treatment (SAT) relies on biogeochemical processes occurring within the vadose zone to improve the quality of secondary treated wastewater during infiltration. Dissolved organic matter (DOM) is a key driver of these processes; however, its depth-dependent transformation within the soil profile remains insufficiently resolved at the molecular level under field conditions.

In this study, we investigated the vertical evolution of fluorescent dissolved organic matter (fDOM) within the soil profile of a full-scale SAT infiltration basin. Soil samples were collected from successive depths along the vadose zone, representing progressive stages of soil–water interaction during infiltration. DOM composition was characterized using excitation–emission matrix (EEM) fluorescence spectroscopy with inner-filter correction and Raman normalization. Fluorescence data were analysed using Coble peak integration and Parallel Factor Analysis (PARAFAC) to resolve independent fluorescent components and assess their depth-dependent behaviour.

The results reveal pronounced vertical stratification of DOM composition within the soil profile. Shallow soil layers are dominated by protein-like fluorescence associated with labile, wastewater-derived organic matter. With increasing depth, these protein-like signals show strong attenuation, while humic-like fluorescence becomes increasingly dominant. Coble peak analysis indicates preferential removal of tryptophan- and tyrosine-like peaks (B and T), whereas humic-like peaks (A, C, and M) persist at depth. PARAFAC modelling further identifies distinct fluorescent components exhibiting contrasting depth trends, with protein-like components rapidly decreasing in intensity and humic-like components remaining relatively stable or proportionally enriched.

These findings demonstrate that SAT acts as a selective biogeochemical filter within the soil profile, where biodegradation and sorption processes preferentially remove reactive DOM fractions in the upper vadose zone while more refractory humic material persists at depth. The combined use of EEM–PARAFAC provides mechanistic insight into DOM transformation pathways during soil aquifer treatment and highlights the importance of depth-resolved fluorescence analysis for improving process-based understanding of SAT performance.

How to cite: Adler‬‏, O.: Vertical transformation of fluorescent dissolved organic matter within the soil profile of a soil aquifer treatment basin, EGU General Assembly 2026, Vienna, Austria, 3–8 May 2026, EGU26-19818, https://doi.org/10.5194/egusphere-egu26-19818, 2026.

EGU26-20263 | ECS | Posters virtual | VPS8

Controls and Predictability of Large Floods in the Brahmaputra River Basin 

Gayathri Vangala and Vimal Mishra

The Brahmaputra River Basin is among the most flood-prone regions globally, experiencing recurrent large floods with severe socio-economic and ecological impacts. Despite extensive flood management interventions, forecasting skill remains limited due to the basin’s complex hydrology, strong monsoon variability, and pronounced land–atmosphere interactions. This study investigates the drivers and dynamics of large floods in the Brahmaputra Basin, with a particular emphasis on coupled land–atmosphere processes. We conduct a composite analysis of major flood events using reanalysis datasets, satellite observations, and hydrological records. Our results show that large floods are consistently associated with anomalously high atmospheric moisture content, extreme and spatially extensive precipitation, and elevated antecedent soil moisture that amplifies runoff generation. The concurrence of saturated catchments with persistent multiday monsoon rainfall leads to rapid escalation of flood magnitude and prolonged flood duration. In addition, enhanced moisture transport into the basin emerges as a critical contributor to the development of large flood events. By integrating these insights into coupled land–atmosphere modeling frameworks, we demonstrate that improved representation of soil moisture dynamics, rainfall persistence, and moisture transport pathways can substantially enhance flood predictability. This work advances the understanding of flood-generating mechanisms in monsoon-dominated river basins and provides actionable insights for improving early warning systems and adaptive flood risk management in the Brahmaputra Basin.

How to cite: Vangala, G. and Mishra, V.: Controls and Predictability of Large Floods in the Brahmaputra River Basin, EGU General Assembly 2026, Vienna, Austria, 3–8 May 2026, EGU26-20263, https://doi.org/10.5194/egusphere-egu26-20263, 2026.

EGU26-21596 | ECS | Posters virtual | VPS8

Comprehensive Evaluation of Baseflow Separation Methods for Peninsular India 

Paleru Samyuktha, Saket Dubey, and Swapnil Gautam

Reliable baseflow estimation plays a crucial role in water resource management across India's monsoon-dominated landscapes, where groundwater contributions sustain river flows through extended dry periods. This study addresses persistent data limitations in Central and Southern India by first compiling daily streamflow records from 4,862 basins sourced from the India Water Resources Information System (IWRIS), followed by rigorous pre-processing and quality control steps that yielded suitable data for analysis across hundreds of representative basins. A comprehensive evaluation of 12 baseflow separation methods was then conducted using Kling-Gupta Efficiency (KGE) against hydrologically verified baseflow benchmarks, revealing digital filter techniques, particularly the Eckhardt filter (median KGE of 0.88) as superior to conventional graphical methods across diverse hydrological regimes. These findings affirm digital filters' reliability for capturing baseflow variability in monsoon recharge areas and arid inland zones, laying a strong foundation for advanced hydrological modeling in data-constrained environments.

Keywords: Baseflow Separation, Digital Methods


How to cite: Samyuktha, P., Dubey, S., and Gautam, S.: Comprehensive Evaluation of Baseflow Separation Methods for Peninsular India, EGU General Assembly 2026, Vienna, Austria, 3–8 May 2026, EGU26-21596, https://doi.org/10.5194/egusphere-egu26-21596, 2026.

EGU26-1436 | Posters virtual | VPS9

Comparative Evaluation of the Newly Developed HIDROTURK-Phase II Hydrological Model in the North Marmara River Basin, Türkiye 

Meltem Kacikoc, Buket Mesta, Okan Fistikoglu, Huseyin Ozkaya, and Kubra Ozdemir-Calli

Abstract

Reliable hydrological modelling tools that can operate with the type and quality of data commonly available at the basin scale are essential for effective water resources planning. In recent years, the HIDROTURK model has been developed to support national hydrological assessments in Türkiye, especially in modelling tasks undertaken as part of river basin management planning processes. This study presents one of the first comprehensive evaluations of the newly updated HIDROTURK Phase II model and compares its performance with the AQUATOOL + EVALHID hydrological modelling system. The North Marmara River Basin was selected as the test region due to its complex hydrological structure and diverse sub-basin characteristics.

Hydrological simulations were carried out using long-term meteorological inputs derived from precipitation and evapotranspiration records for the period 1989–2014, enabling the examination of the models under a wide range of climatic conditions. Streamflow outputs were compared with observations at 14 calibration points, and model performance was assessed using the Nash–Sutcliffe Efficiency (NSE) and Percent Bias (PBIAS) indicators.

The results indicate that the meteorological inputs generated through HIDROTURK’s internal processing tools show a high level of agreement with data prepared using more traditional methods, and that both models produced comparable flow patterns under similar conditions. Overall, the findings demonstrate that HIDROTURK Phase II exhibits stable behavior even at this early stage of development and provides a practical and reliable alternative for hydrological simulations.

Keywords: Hydrological Modelling; Basin-Scale Simulation; Model Comparison; Model Performance Evaluation; Streamflow Calibration

ACKNOWLEDGEMENT: The authors would like to express their gratitude to the projects “Technical Assistance on Preparation of River Basin Management Plans for Six Basins (EuropeAid/140294/IH/SER/TR)” and “Development and Sustainability of the HIDROTURK Model Project” for their support. The authors also thank the Directorate General for Water Management, the State Hydraulic Works, and the General Directorate of Meteorology for providing essential data.

How to cite: Kacikoc, M., Mesta, B., Fistikoglu, O., Ozkaya, H., and Ozdemir-Calli, K.: Comparative Evaluation of the Newly Developed HIDROTURK-Phase II Hydrological Model in the North Marmara River Basin, Türkiye, EGU General Assembly 2026, Vienna, Austria, 3–8 May 2026, EGU26-1436, https://doi.org/10.5194/egusphere-egu26-1436, 2026.

EGU26-2612 | ECS | Posters virtual | VPS9

Evaluating a Long Short-Term Memory (LSTM) approach for Snow Water Equivalent (SWE) downscaling and hydrological modeling in mountainous terrain 

seyedeh hadis moghadam, Richard Arsenault, André St-Hilaire, and Frédéric Talbot

In the context of the global hydrological cycle, runoff generated from snowmelt plays a key role in water availability, particularly in cold and mountainous regions. In many parts of Canada and the western United States, mountain snowpacks act as natural reservoirs by storing precipitation during cold seasons and releasing it during spring and summer. Accurate estimation of snow water equivalent (SWE) is therefore essential for hydropower reservoir operation, snow-related hazard assessment, and hydrological modeling. However, the coarse spatial resolution of widely available SWE products in northern latitudes, combined with complex mountain topography, introduces substantial uncertainty in their direct application to hydrological models. High-resolution SWE mapping remains a major challenge in these environments. In this study, we propose a multifactor SWE downscaling framework based on a Long Short-Term Memory (LSTM) deep learning approach, applied to the Nechako River watershed in British Columbia, Canada. The framework uses ERA5-Land SWE at 10 km resolution as the target variable, with predictor variables including precipitation, minimum and maximum temperature, solar radiation, and 2-m dewpoint temperature, together with static physiographic information such as elevation and land cover. Daily data from 1981 to 2024 are considered. The model is trained and evaluated at the 10 km resolution before being applied to generate SWE at 5 km resolution, corresponding to the spatial resolution of the CEQUEAU hydrological model. The downscaled SWE fields are designed to retain the large-scale snow patterns provided by ERA5-Land, while adding more spatial detail based on local elevation and land cover. Current work focuses on incorporating these downscaled SWE estimates into the CEQUEAU hydrological model and comparing the resulting runoff simulations with those obtained using CEQUEAU’s internal SWE representation. Rather than aiming to demonstrate clear improvements at this stage, the goal is to better understand how different SWE inputs influence the simulated hydrological response. Preliminary results suggest that LSTM-based downscaling offers a flexible and promising way to generate intermediate-resolution SWE fields in mountainous regions. This approach shows potential as a practical link between coarse-resolution reanalysis products and distributed hydrological models used for water resources and hydropower studies.

How to cite: moghadam, S. H., Arsenault, R., St-Hilaire, A., and Talbot, F.: Evaluating a Long Short-Term Memory (LSTM) approach for Snow Water Equivalent (SWE) downscaling and hydrological modeling in mountainous terrain, EGU General Assembly 2026, Vienna, Austria, 3–8 May 2026, EGU26-2612, https://doi.org/10.5194/egusphere-egu26-2612, 2026.

EGU26-4141 | ECS | Posters virtual | VPS9

Geostatistical Interpolation Approach for Improving Flood Simulation Within a Data- Scarce Region in the Tibetan Plateau 

kanon guedet guede, Zhongbo Yu, and Florentin Hofmeister

The complex orography of the Tibetan plateau (TP) and the scarcity and uneven spatial distribution of meteorological stations 
present significant challenges in accurately estimating meteorological variables for hydrological simulations. This study aims 
to enhance the accuracy of daily precipitation and temperature interpolation for hydrological simulations in the Lhasa River 
Basin (LRB), particularly during flood events. We evaluate and compare the performance of deterministic Inverse Distance 
Weighting—IDW and geostatistical (Ordinary Kriging—OK and Kriging with External Drift—KED) interpolation methods for 
estimating precipitation and temperature patterns. Subsequently, we investigate the influence of different interpolation meth
ods on hydrological simulations by using the interpolated meteorological data as input for the Water Balance Simulation Model 
(WaSiM) to simulate daily discharge in the LRB. Our results revealed that geostatistical methods, specifically OK and KED, are 
more effective in capturing the spatial variability and anisotropy inherent in precipitation patterns influenced by the Indian 
summer monsoons. In addition, the KED method effectively captured the daily variation of the temperature lapse rate, indicating 
the inadequacy of using a constant lapse rate for hydrological modelling in high- elevation regions like the TP. The geostatistical 
technique outperformed the Deterministic method, with KED realising the best temperature and precipitation interpolation 
performance based on cross- validation results. However, although KED provides superior results based on cross- validation per
formance, applying its precipitation interpolation as input into WaSiM led to the poorest discharge simulation. The combination 
of OK for precipitation and KED for temperature produced the most accurate discharge simulations in the LRB, highlighting 
the importance of not solely relying on cross- validation results but also considering the practical implications of interpolation 
methods on hydrological model outputs. Our study offers a robust framework for improving flood simulations and water resource 
management in a data- scarce, high- elevation region like the TP.

How to cite: guede, K. G., Yu, Z., and Hofmeister, F.: Geostatistical Interpolation Approach for Improving Flood Simulation Within a Data- Scarce Region in the Tibetan Plateau, EGU General Assembly 2026, Vienna, Austria, 3–8 May 2026, EGU26-4141, https://doi.org/10.5194/egusphere-egu26-4141, 2026.

EGU26-5160 | ECS | Posters virtual | VPS9

Solute dispersion from continuous point sources in ice-covered turbulent flows with bed absorption 

Sandipan Paul and Koeli Ghoshal

A numerical investigation is conducted to study the steady-state concentration field
when a solute is released from multiple continuous line sources in an ice-covered
channel with an absorbing bed under turbulent flow conditions. The governing
equations are solved using the Crank-Nicolson scheme by adopting a two-power law
velocity and a quartic eddy diffusivity profile, which is influenced by the roughness of
the bed layer and the ice cover. Validation against earlier numerical results for a
specific case reveals strong consistency in the concentration profiles. The findings
highlight how the roughness of the boundaries affects the solute concentration. It
further demonstrates the effect of the bed absorption parameter in the early mixing
stages when solute is released near the bed. For zero bed absorption, the solute
concentration asymptotically attains a uniform far-field value of unity, while any non-
zero bed absorption leads to complete depletion of solute downstream.

How to cite: Paul, S. and Ghoshal, K.: Solute dispersion from continuous point sources in ice-covered turbulent flows with bed absorption, EGU General Assembly 2026, Vienna, Austria, 3–8 May 2026, EGU26-5160, https://doi.org/10.5194/egusphere-egu26-5160, 2026.

EGU26-5899 | Posters virtual | VPS9

High-performance task-based water balance modeling 

Octavio Castillo Reyes, Junjie Li, Ashkan Hassanzadeh, and Enric Vázquez-Suñé

Water balance modeling plays a pivotal role in sustainable water management, as it underpins the understanding of hydrological processes that govern resource distribution, ecosystem stability, and long-term environmental planning. Accurate and efficient computational tools are essential to capture the spatial and temporal dynamics of water balance, particularly in complex geological and urban environments. WaterpyBal is an innovative modeling framework specifically designed to construct spatial-temporal water balance models. It effectively integrates multiple stages of hydrological assessment-including data interpolation, evapotranspiration estimation, and infiltration computation-while accounting for soil heterogeneity and components of the urban water cycle. The tool demonstrates robust performance when applied to both synthetic and experimental datasets, providing reliable and scalable results.

In the context of the exascale era, where data-intensive environmental models demand unprecedented computational power, High-Performance Computing (HPC) frameworks are essential to ensure scalability and efficiency. To this end, WaterpyBal has been enhanced through its integration with PyCOMPSs, the Python binding of the COMPSs programming model. PyCOMPSs enables the transparent parallelization of Python applications by identifying task-level parallelism through annotated methods and dynamically constructing a task-dependency graph during runtime. This graph-driven execution model allows efficient scheduling and data management across distributed computing infrastructures such as clusters and cloud platforms.

The integration of WaterpyBal with PyCOMPSs significantly improves its computational performance, enabling the simulation of large-scale, high-resolution water balance models within feasible timeframes. This work demonstrates the potential of combining advanced hydrological modeling with state-of-the-art parallel computing frameworks to address emerging challenges in environmental modeling and resource management at scale.

How to cite: Castillo Reyes, O., Li, J., Hassanzadeh, A., and Vázquez-Suñé, E.: High-performance task-based water balance modeling, EGU General Assembly 2026, Vienna, Austria, 3–8 May 2026, EGU26-5899, https://doi.org/10.5194/egusphere-egu26-5899, 2026.

EGU26-6269 | ECS | Posters virtual | VPS9

Climate Driven Hydrological Intensification and Its Implications for Water Availability 

Tasneem Kosar, Akif Rahim, Muhammad Yaseen, Raheela Naz, Muhammad Mamoor, and Amina Akif

The intensification of hydrological cycle driven by global warming leads to an increase in extreme precipitation events, prolonged droughts and higher rates of evaporation. This global change has altered the global hydrological cycle and effect on the long term water availability in many watersheds worldwide. The impact of climate change is usually assessed by using ratio of stream flows and climate variables, which are formally defined as the climate elasticity of water availability This study examines how the hydrological cycle is intensifying over the Kabul Watershed and how this affects water availability using the water balance (P–E) approch.  Here, we used ERA5 land data of annual total precipitation (P) and total surface evaporation (E) from 1976 to 2024 to understand how the land and atmosphere interacted.  The climate elasticity of (P-E) to annual water availability is determined for 1976-2010 and validated for 2011-2024. The results reveal 0.8 °C rise in temperature, 12% decline in annual precipitation, and  7% increase in evaporation in the past 25 years. This caused 15% reduction in the P–E balance, which directly reduced the annual water availability. The climate elasticity factor of 0.55 has been determined to water availability in Kabul for the period of 1976-2010. By using this elastic factor, the average water availability of 19.54 MAF is predicted for the period of 2011-2024 whereas the observed water availability is 20.43 MAF. This finding reflects the sensitivity of a watershed to P-E alteration for water availability and underscore the urgent need of climate resilient water management strategies to mitigate the future impacts of climate change in the Kabul watershed.

How to cite: Kosar, T., Rahim, A., Yaseen, M., Naz, R., Mamoor, M., and Akif, A.: Climate Driven Hydrological Intensification and Its Implications for Water Availability, EGU General Assembly 2026, Vienna, Austria, 3–8 May 2026, EGU26-6269, https://doi.org/10.5194/egusphere-egu26-6269, 2026.

EGU26-7262 | ECS | Posters virtual | VPS9

CO2 Dynamics and Carbon Sources in the Critical Zone: An Isotopic Study in Aquifers of Southeastern Spain 

Enrique Echeverría-Martín, Ángel Fernández-Cortés, Enrique P. Sánchez-Cañete, Penélope Serrano-Ortiz, Cecilio Oyonarte, Arnau Riba Palou, Andrew S. Kowalski, and Francisco Domingo

The Critical Zone, extending from the land surface through the vadose zone to groundwater, can store and transfer substantial carbon as CO2 and dissolved inorganic carbon (DIC). Yet CO2 behavior below the first meters of soil remains poorly constrained, particularly where water-table fluctuations, gas-water exchange, and water-rock reactions interact. In these settings, deep vadose CO2 may exhibit atmospheric and soil-respiration signatures with contributions linked to groundwater degassing and carbonate-system reactions, potentially creating transient subsurface CO2 reservoirs that couple the aquifer and the atmosphere.

We present a repeated sampling design to characterize carbon cycling across the Critical Zone in semi-arid southeastern Spain. We sampled the air columns of 11 boreholes belonging to six groundwater bodies during four campaigns (spring 2022, autumn-winter 2022, spring-summer 2024, and spring-summer 2025). In borehole air, we measured CO2, H2O vapor, and its carbon isotopes composition (δ¹³C-CO2); air was stored in gas-tight bags and analyzed by cavity ring-down spectroscopy (Picarro G2508 and G2201-i). In parallel, groundwater was sampled at each site. In situ, we measured pH, temperature, oxidation–reduction potential (ORP), HCO3-, and electrical conductivity. In the laboratory we analyzed pH, alkalinity, major ions, total organic carbon and total nitrogen, carbon isotopes of dissolved inorganic carbon (δ¹³C-DIC), and water isotopes (δ²H, δ¹⁸O). Water-table position at the time of sampling was used to interpret gas-water contact.

Critical Zone CO2 concentrations in borehole air ranged from 614 to 128700 ppm (pCO2=0.000587-0.102287 atm). Groundwater CO2 was estimated with the PHREEQC software, yielding values between 2240 and 9550 ppm (pCO2=0.002240-0.009550 atm), allowing comparison between the air column and the saturated zone, and evaluation of disequilibrium and exchange potential as the water-table varies. Carbon isotopes signatures constrain sources and transformations: δ¹³C-CO2 ranged from -11.14 to -23.62‰, δ¹³C-DIC from -6.27 to -20.11‰, and host-rock δ¹³C from 2.37 to -7.12‰. All values (δ¹³C‰) are reported relative to VPDB (Vienna Pee Dee Belemnite). Joint interpretation across gas, DIC, and rock enabled discrimination among biogenic CO2 production, atmospheric mixing, carbonate dissolution/precipitation (based on the saturation indices of the main carbonate mineral phases), and CO2 transfer from the aquifer to the deep vadose zone. The multi-campaign design provided a basis for quantifying seasonal and interannual shifts in these boreholes and for identifying hydrogeochemical conditions (e.g., pH-alkalinity evolution and redox state) that promote storage/mineralization versus release of CO2.

Our experimental design characterizes subsurface CO2 storage and transport at the Critical Zone scale. It identifies when the deep vadose environments act as reservoirs, conduits, or sources linking groundwater and the atmosphere. This information is rarely available but critical for improving carbon budgets and models for the Critical Zone.

This work was supported by the Spanish Ministry of Science and Innovation (projects PID2024-158786NB-C21 and PID2024-158786NB-C22, NATURAL), the University of Granada (project PPJIB2024-53), and the Regional Ministry of University, Research and Innovation, the Spanish Government and the and European Union – NextGenerationEU (projects BIOD22_001 and PCBIO).

How to cite: Echeverría-Martín, E., Fernández-Cortés, Á., Sánchez-Cañete, E. P., Serrano-Ortiz, P., Oyonarte, C., Riba Palou, A., Kowalski, A. S., and Domingo, F.: CO2 Dynamics and Carbon Sources in the Critical Zone: An Isotopic Study in Aquifers of Southeastern Spain, EGU General Assembly 2026, Vienna, Austria, 3–8 May 2026, EGU26-7262, https://doi.org/10.5194/egusphere-egu26-7262, 2026.

EGU26-8393 | Posters virtual | VPS9

The role of High Temperature-Low Precipitation conditions in shaping heatwaves and droughts 

Devjit Sinha and Chandra Rajulapati

Hydroclimatic extremes have extensive social, economic and ecological impacts, thereby making it highly imperative to develop disaster assessment and mitigation strategies. The frequency of extreme events like heatwaves and droughts is  intricately linked with the rising temperature trends and the changing precipitation patterns worldwide. Moreover, lagged responses amongst such extremes can occur across temporal scales due to the existing large-scale climate linkages. However, the association between present-day occurrences of concurrent high temperature and low precipitation days (HTLPs) with the frequency of heatwaves and droughts of a subsequent period is not fully explored. In this global analysis, we estimate the frequency of heatwaves and droughts based on 1-year temporally lagged HTLPs. Our results reveal a significant rising trend in the average number of heatwaves with an increase in the number of HTLPs of the previous year, while no significant trend is observed for droughts. However, a high number of HTLPs (over 100 events) is associated with a slight reduction in the number of heatwaves (5.9 to 5.6) but a pronounced increase in the number of droughts (1.8 to 2.4). During a 10-year validation period, 81% of heatwaves and 85% of droughts globally remain consistent with the HTLP–conditioned behavior inferred from the 34-year training period of the model. Our findings thus demonstrate the applicability and effectiveness of HTLPs in predicting heatwaves and droughts. This study can be used to develop stochastic models to predict heatwaves and droughts with HTLP as a predictor, and hazard-specific probabilistic assessments that can support and improve resource allocation at regional and global scales.

How to cite: Sinha, D. and Rajulapati, C.: The role of High Temperature-Low Precipitation conditions in shaping heatwaves and droughts, EGU General Assembly 2026, Vienna, Austria, 3–8 May 2026, EGU26-8393, https://doi.org/10.5194/egusphere-egu26-8393, 2026.

EGU26-9421 | ECS | Posters virtual | VPS9

Asymmetric intensification of nighttime versus daytime precipitation extremes under warming 

Jingyi Meng and Haoming Xia

The intensification of the global hydrological cycle is a well-established consequence of anthropogenic climate change. However, how this intensification manifests across the diurnal cycle remains poorly understood, representing a critical blind spot in climate risk assessments. While daily-aggregated metrics consistently suggest a "wetter and more extreme" climate, they mask fundamentally different responses of daytime and nighttime precipitation to warming.Here we analyse high-resolution observational records from 2,399 stations across China spanning 1972–2024 and identify a distinct nighttime intensification regime that is increasingly dominant under warming. In regions experiencing active wetting, extreme precipitation (R95p) intensifies more rapidly at night than during the day, both in magnitude and spatial extent.This diurnal asymmetry reflects contrasting physical controls. Nighttime wetting is driven almost exclusively by increases in precipitation intensity (p < 0.001, Wilcoxon signed-rank test) and exhibits a tight thermodynamic scaling with background warming. By contrast, daytime precipitation changes arise from a heterogeneous combination of intensity and frequency adjustments, indicating a greater role for dynamical modulation.

These findings reveal a previously underappreciated amplification of nocturnal hydrometeorological hazards, including flash floods and landslides, that is systematically underestimated by daily-mean indicators. As global warming continues, the emerging dominance of nighttime precipitation extremes underscores the urgent need to incorporate diurnally resolved processes into climate risk assessment, infrastructure design and early-warning systems.

How to cite: Meng, J. and Xia, H.: Asymmetric intensification of nighttime versus daytime precipitation extremes under warming, EGU General Assembly 2026, Vienna, Austria, 3–8 May 2026, EGU26-9421, https://doi.org/10.5194/egusphere-egu26-9421, 2026.

Surface-groundwater interactions (SGI) plays a crucial role in maintaining stream thermal regime and ecological balance, keeping a check on this is logistically and financially challenging. This study utilises multi-temporal Landsat-8 Thermal Infrared Sensor (TIRS) data to compute Stream Surface Temperature (SST), its anomaly (SSTA), Robust Thermal Deviation Index (R-TDI) and further classifies groundwater influence on the Kharun River, a semi-arid urban catchment in India (approximately 4109 km²).

Due to changes in weather and season, surface water is subject to heating and cooling, but the water system beneath the land surface will be at a constant temperature. The stream reach, influenced by groundwater, will show a relatively stable thermal signature across all seasons. Stream Surface Temperature (SST) derived through radiometric calibration and emissivity-adjusted retrieval across pre-monsoon, monsoon, and post-monsoon periods. To isolate localized hydrological processes from regional climatic forcing, we computed Stream Surface Temperature Anomalies (SSTA) by subtracting reach-wise median SST from pixel-scale values. To account for the non-normal nature of SST, a Robust Thermal Deviation Index (R-TDI) framework was utilised which minimizes atmospheric noise and mixed-pixel interference, allowing for the isolation of persistent thermal signals.

Using statistically defined TDI thresholds, a classification approach was finalised putting stream stretches into high, moderate, and low groundwater influence zones. Results identify spatially consistent cold-water anomalies indicative of groundwater discharge primarily during pre-monsoon and warmer-water anomalies during post-monsoon seasons when thermal contrasts are most pronounced.  These zones coincide with structurally controlled segments and urbanized stretches, suggesting a complex interplay between hydrogeology and anthropogenic modifications. By leveraging open-access satellite data, this research provides a scalable tool for evidence-based river restoration and climate-resilient water management in rapidly urbanizing regions.


Key Words: Thermal remote sensing; Landsat-8 TIRS; Stream surface temperature; Thermal anomaly; Surface–groundwater interaction; Data-scarce catchments

How to cite: Chandel, R. and K. Singh, C.: Thermal Remote Sensing for Qualitative Analysis of Surface Water and Groundwater Interaction: A Case Study of the Kharun River, EGU General Assembly 2026, Vienna, Austria, 3–8 May 2026, EGU26-9498, https://doi.org/10.5194/egusphere-egu26-9498, 2026.

EGU26-9647 | Posters virtual | VPS9

Signature-Based Evaluation of Hydrological Processes Using the SWAT Model in the Bharathapuzha River Basin, India 

Gopika Krishnan Sreelatha, Anakha Anupama Rajith, Akshaya Sreekumar, Greeshma Girish, and Gowri Reghunath

Understanding catchment behaviour is essential for effective water resources planning and sustainable watershed management. Traditional model evaluation approaches based solely on time-series performance metrics often fail to capture the full spectrum of hydrological functioning. This study employs a hydrological signature–based evaluation framework to assess the capability of the Soil and Water Assessment Tool (SWAT) model in reproducing the dominant hydrological processes in the Bharathapuzha River Basin, a monsoon-dominated river system in southern India. The SWAT model was implemented using spatial datasets of topography, land use, and soil characteristics, together with long-term hydro-meteorological inputs, and calibrated and validated against observed daily streamflow. Beyond conventional performance indices, key hydrological signatures including flow duration curves, runoff ratio, baseflow index, seasonal flow patterns, and characteristics of low- and high-flow events were extracted from both observed and simulated datasets. Comparison of observed and simulated signatures provided a process-oriented evaluation of model behaviour, offering key insights into how well runoff generation, seasonal variability, and hydrological extremes are represented. These perspectives are not readily evident from traditional model performance metrics alone. This study demonstrates the value of hydrological signatures as diagnostic tools for enhancing model realism and improving confidence in hydrological simulations for climate impact assessment and water resources management in monsoon-driven catchments.

How to cite: Krishnan Sreelatha, G., Anupama Rajith, A., Sreekumar, A., Girish, G., and Reghunath, G.: Signature-Based Evaluation of Hydrological Processes Using the SWAT Model in the Bharathapuzha River Basin, India, EGU General Assembly 2026, Vienna, Austria, 3–8 May 2026, EGU26-9647, https://doi.org/10.5194/egusphere-egu26-9647, 2026.

EGU26-10986 | Posters virtual | VPS9

Stable isotopic fingerprinting of hydrological variability along the Yamuna river, India 

Muguli Tripti, Suhas D Khobragade, and Someshwar M Rao

Global water security can be achieved by the systematic assessment of available water resources in both large and small river basins. This study investigated the stable isotopic composition of river water in the Yamuna basin, India to fingerprint the major contributing sources of water and their spatial variability along the main river channel. The Yamuna river originates at an altitude of about 6300 m asl in Yamunotri glacier near Bandarpunch, Uttarakhand Himalayas and flows through several states of India like Haryana, Punjab, Madhya Pradesh, Rajasthan and Uttar Pradesh. In this study, the Yamuna river water samples have been collected along main channel from Yamunotri to its confluence with Ganga river during pre-monsoon and post-monsoon seasons of the year 2024. The measured stable isotope ratios of oxygen (δ18O) and hydrogen (δ2H) in river water are in the range of -2.7 – -11.2 ‰ and -23.4 – -75.2 ‰ respectively for the sampling period. This study reports for the first time that there is a significant spatial variability in the source water of Yamuna river as fingerprinted by the stable isotopic composition. The Yamuna river at upper reaches receives water from sources that are depleted in heavier isotopic content mainly from glacial melt. The higher amount of water diversion to canal networks at different stages as well as water mixing from industrial and urbanized regions have led to relative water degradation of Yamuna river in middle reaches. The downstream isotopic composition reflects possible interaction with groundwater, higher water influx from Peninsular tributaries, and evaporation effect. Seasonality in source water contribution to Yamuna river discharge along the entire stretch has also been traced using stable isotopic composition of water.

How to cite: Tripti, M., Khobragade, S. D., and Rao, S. M.: Stable isotopic fingerprinting of hydrological variability along the Yamuna river, India, EGU General Assembly 2026, Vienna, Austria, 3–8 May 2026, EGU26-10986, https://doi.org/10.5194/egusphere-egu26-10986, 2026.

Over the past decade, droughts have drawn increasing attention due to their substantial agricultural and economic consequences, particularly in the U.S. Great Plains area (e.g., the 2012 Central US event and the 2017 Northern Plains event). Although certain large-scale atmospheric and oceanic patterns are necessary for drought development, land- atmosphere interactions can play an important role in the intensification of drought conditions, especially for flash drought. This study aims to predict drought conditions over the U.S. Great Plains at 1-3-week lead times using a convolutional neural network (CNN) model. To forecast drought categories derived from the US Drought Monitor (USDM), the models are trained using multi-source atmospheric and land-surface variables, including 500 hPa geopotential height, precipitation, wind speed, surface radiation, humidity, and temperature from ERA5, soil moisture from Global Land Evaporation Amsterdam Model (GLEAM) and North American Land Data Assimilation System (NLDAS), and Normalized Difference Vegetation Index (NDVI) from satellite products. Model performance is evaluated to unravel the atmospheric and land-surface processes that drive droughts at different lead times and identify their relative contributions to drought development and intensification.

How to cite: Rippeteau, L. and Chen, L.: Drought prediction and understanding the drivers of drought development using a machine learning approach, EGU General Assembly 2026, Vienna, Austria, 3–8 May 2026, EGU26-12345, https://doi.org/10.5194/egusphere-egu26-12345, 2026.

EGU26-14233 | Posters virtual | VPS9

Flash Flood Events in the Northwestern Black Sea Region under Climate Change  

Valeriya Ovcharuk and Inna Khomenko

Extreme hydrological events have become increasingly frequent in Ukraine in recent decades due to climate change and structural weaknesses in water resources management. According to the Water Strategy of Ukraine up to 2050, inadequate governance practices remain a major source of anthropogenic pressure on water bodies, while climate change creates additional risks through prolonged droughts interrupted by intense rainfall events, leading to flooding. These challenges are particularly critical for southern Ukraine, where limited water resources require extensive hydrotechnical regulation and adaptive management.

Flash floods represent one of the most dangerous manifestations of hydrological extremes. Characterised by rapid water-level rise and high flow velocities, they pose severe risks to settlements, infrastructure, and agriculture due to their sudden onset.

The north-western part of the Black Sea region has experienced several severe flash flood events over the past decade. One of the most significant cases occurred in September 2013 in the Kogilnyk River basin., when anomalously high precipitation totals of 41 - 270 mm were recorded from 10 and 14 September. These extreme rainfall conditions were associated with a stationary cold atmospheric front linked to the Asia Minor depression, resulting in prolonged convective rainfall with thunderstorms, squalls and wind gusts of up to 22 m/s in the southern districts of the Odesa region.

The total volume of storm rainfall during this event is estimated at approximately 250 million cubic meters, which exceeded the mean annual runoff of the Kogilnyk River by a factor of 5.5. Precipitation affected an area of about 1,400 km², corresponding to 35% of the total river basin area. As a result, flash flooding impacted multiple settlements, located in the south-western part of Odesa Oblast as well as extensive agricultural lands in there.

Another notable episode occurred in early August 2019, when unstable atmospheric conditions and active cyclones caused intense rainfall across southern and eastern Ukraine. On 3 - 4 August, precipitation amounts reached 130–220% of the monthly norm in several locations. In the Odesa region, rainfall totals of up to 126 mm - equivalent to nearly three months of precipitation—met the criteria for hazardous meteorological phenomena and triggered debris flows and localized flash flooding, particularly in the village of Moloha (Bilhorod-Dnistrovskyi district).

More recently, in September 2025, an urban flash flood in Odesa highlighted the increasing vulnerability of urban areas to extreme rainfall. Prolonged heavy rains caused widespread flooding, significant damage, and human losses, prompting large-scale rescue operations..

The analysed events indicate a clear increase in flash flood intensity and impacts in the north-western Black Sea region. Under continued climate change, enhanced hydrological monitoring, early warning systems, climate-adaptive urban planning, and integrated water resources management are urgently required in southern Ukraine.


ACKNOWLEDGEMENTS

This contribution builds on the conceptual framework of the applied research project “Sustainable Development of Water Resources Management and Modelling in the North-Western Black Sea Region under Conditions of Increasing Climate Extremes and Anthropogenic Pressure”, approved for funding by the Ministry of Education and Science of Ukraine (Order No. 23, 9 January 2026, see https://surl.li/omqxph).

How to cite: Ovcharuk, V. and Khomenko, I.: Flash Flood Events in the Northwestern Black Sea Region under Climate Change , EGU General Assembly 2026, Vienna, Austria, 3–8 May 2026, EGU26-14233, https://doi.org/10.5194/egusphere-egu26-14233, 2026.

Although drought indices can be evaluated employing linear and non-linear algorithms, most contributions in the literature have not adequately quantified geospatial-temporal volatility, leading to Type II errors. This study addresses these gaps by comparing ten drought indices across the Colorado and Louisiana regions of the United States over 75 years, examining non-linear and spatio-temporal patterns to ensure a robust assessment of drought. High-resolution European Centre for Medium-Range Weather Forecasts (ECMWF) gridded monthly total precipitation data for 75 years (1950-2024) were used to evaluate the drought indices. The spatial clustering of precipitation patterns was quantified using the second-order semi-parametric eigen-decomposition geospatial autocorrelation to geolocate hot and cold spots of precipitation. We employed the Autoregressive Integrated Moving Average (ARIMA) model, coupled with the Generalized Autoregressive Conditional Heteroscedastic (GARCH) model, and compared five ARIMA-GARCH variants across nine error distributions to address non-asymptotic conditional volatility and temporal persistence in precipitation. Drought indices were examined across five temporal scales and contrasted with simulated parameters derived from the Community Earth System Model (CESM). The temporal lag relationship between meteorological and agricultural droughts was evaluated using the non-parametric Time-Varying Distance Cross-Correlation Function (TV-DCCF). The findings revealed that the ARIMA-eGARCH(1,1) model with a Student’s t distribution precisely detected the non-asymptotic conditional volatility in the precipitation time series. The Standardized Precipitation Index (SPI), China Z Index (CZI), and Z-Score Index (ZSI) were the most applicable indices for drought monitoring in both regions. TV-DCCF revealed that meteorological droughts significantly influenced agricultural droughts, with a lag of up to four months. CESM-derived drought indices were mainly within the ERA5-Land uncertainty range, except for CZI and aSPI, attributable to CESM’s lower spatial resolution and limited sensitivity to localized extreme events.

Keywords: Standardized Precipitation Index (SPI); Global Moran’s Index; Autoregressive Moving Integrated Average (ARIMA); Generalized Autoregressive Conditional Heteroscedastic Model (GARCH); ERA5-Land; Community Earth System Model (CESM).


How to cite: Choudhari, N., Elshorbany, Y., Jacob, B., and Collins, J.: Prognosticative De-Volatility Modeling for Empirically Quantifying CESM and ECMWF Space-Time Heterogeneity of Drought Indices Across Colorado and Louisiana Regions of the USA, EGU General Assembly 2026, Vienna, Austria, 3–8 May 2026, EGU26-14649, https://doi.org/10.5194/egusphere-egu26-14649, 2026.

EGU26-15165 | Posters virtual | VPS9

Tracing Groundwater-Surface Water Mixing Using Isotopes in a Semi-Arid Volcanic Lake Basin 

Lorena Ramírez González, Selene Olea Olea, Ricardo Sánchez Murillo, Ruth Esther Villanueva Estrada, Miguel A González Mejía, Luis González Hita, Eric Morales Casique, Olivia Zamora Martínez, Martha Gabriela Gómez Vasconcelos, Avellán Denis Ramón, and Nelly Ramírez Serrato

The application of isotopic tracers provides a powerful means to unravel complex hydrological systems, including groundwater (GW)-surface water (SW) connectivity. This study investigates the interacting hydrological and geochemical processes within a temperate volcanic lake basin in west-central Mexico, with the objective of assessing hydrogeological connectivity between groundwater and the lacustrine system. Spatially distributed sampling was conducted for major ions, nitrate, strontium, and stable water isotopes (δ¹⁸O and δ²H) across multiple water sources, including precipitation, rivers, lakes, wells, and springs.

Results indicate that direct infiltration of precipitation constitutes the dominant groundwater recharge mechanism in high-elevation, forested zones, where waters exhibit a Ca–Mg–HCO₃⁻ hydrochemical facies. Mixing with deeper groundwater components is also evident, as reflected by elevated temperatures and isotopic compositions indicative of enhanced water-rock interaction. Surface waters, particularly lakes, display pronounced evaporative enrichment, while elevated nitrate concentrations in shallow groundwater point to anthropogenic inputs associated with irrigation return flows and urban activities.

Although sampling was conducted during the dry season and therefore may not capture the full range of annual hydrological variability, the identification of local and regional recharge zones provides a robust framework for future investigations of precipitation-driven recharge and GW-SW interactions. Additionally, strontium concentrations proved effective for tracing subsurface flow paths and fluid exchange along fault-controlled structures, offering valuable insights into hydrogeological processes in tectonically active volcanic settings. The integrated use of hydrochemical and isotopic tracers highlights their critical role in supporting sustainable water-resource management and protecting groundwater quality in complex temperate, semi-arid lake systems increasingly impacted by anthropogenic pressures.

How to cite: Ramírez González, L., Olea Olea, S., Sánchez Murillo, R., Villanueva Estrada, R. E., González Mejía, M. A., González Hita, L., Morales Casique, E., Zamora Martínez, O., Gómez Vasconcelos, M. G., Denis Ramón, A., and Ramírez Serrato, N.: Tracing Groundwater-Surface Water Mixing Using Isotopes in a Semi-Arid Volcanic Lake Basin, EGU General Assembly 2026, Vienna, Austria, 3–8 May 2026, EGU26-15165, https://doi.org/10.5194/egusphere-egu26-15165, 2026.

EGU26-15655 | Posters virtual | VPS9

Assessing changes in flood inundation patterns using rainfall-controlled event analysis 

Mousumi Ghosh and Subhankar Karmakar

Flood hazard assessments are commonly based on rainfall magnitude and frequency; however, flood responses to similar rainfall intensities may change over time due to evolving land use, river morphology, and hydraulic controls. This study investigates temporal changes in flood inundation patterns between 2014 and 2024 over a highly flood prone urban coastal catchment in India under comparable rainfall forcing, with the objective of improving understanding of non-stationary flood behavior. Rainfall events were identified and grouped based on intensity and duration using long-term precipitation records. For each selected event, flood extents were mapped using satellite-based inundation detection implemented on cloud computing platforms, and, where appropriate, complemented by physically based hydraulic modeling. This combined rainfall–flood framework enables consistent inter-annual comparison of flood patterns under equivalent meteorological conditions. The methodological approach focuses on isolating the influence of landscape and hydraulic evolution on flood response by analyzing spatial characteristics of inundation independent of rainfall variability. By integrating remote sensing and hydraulic modeling within a long-term analysis, the study provides a transferable framework for assessing how flood behavior evolves in response to environmental and anthropogenic changes. This work is relevant to flood risk management and climate adaptation, particularly in rapidly changing river basins where traditional stationary assumptions may no longer be valid. The approach supports improved interpretation of historical floods and more robust planning under future uncertainty.

How to cite: Ghosh, M. and Karmakar, S.: Assessing changes in flood inundation patterns using rainfall-controlled event analysis, EGU General Assembly 2026, Vienna, Austria, 3–8 May 2026, EGU26-15655, https://doi.org/10.5194/egusphere-egu26-15655, 2026.

Understanding hydrological responses to high-intensity rainfall is critical for water resource management in humid tropical regions, where climate change is increasing the frequency and magnitude of extreme storm events. However, runoff generation mechanisms and flow pathway activation in small tropical catchments remain poorly understood. This study investigates hydrological connectivity, flow pathways, and streamflow source contributions in the Acono watershed, Trinidad and Tobago.

A multi-tracer approach combining stable isotopes (δ²H, δ¹⁸O), radioisotopes (³H, ²²²Rn), and major ion geochemistry (SO₄²⁻, Na⁺, Mg²⁺, Ca²⁺, Cl⁻) was applied to characterize water sources and residence times under contrasting hydrological conditions. Periodic sampling was conducted over a 22-month period, complemented by event-based sampling during a minimum of five high-intensity rainfall events. Samples were collected from rainfall, streams, springs, shallow soil water (10–80 cm), and deep groundwater, alongside continuous monitoring of rainfall, soil moisture, and water levels across the catchment. End-member mixing analysis was used to quantify source contributions to streamflow.

Preliminary results indicate that streamflow is predominantly sourced from pre-event (“old”) water under low flow and moderate wet-season conditions, with old water and spring inputs frequently accounting for 60–99% of flow. Direct rainfall contributions are generally limited (average ~7%) and rarely exceed ~30–37%, suggesting strong subsurface buffering and rapid mobilization of stored water rather than dominant overland flow. In contrast, the onset of wetter conditions in early 2025 triggered pronounced, non-linear shifts in source contributions, including sharp increases in deep groundwater and spring contributions (up to ~89% and ~80%, respectively), alongside elevated event water fractions. These patterns suggest threshold-controlled activation of deeper storage and fast-responding subsurface pathways during periods of sustained or intense rainfall.

Data collect is ongoing and additional analyses are expected to improve our understanding of the translation from rainfall to streamflow. This research provides a novel approach to understanding hydrological processes in small island developing states (SIDS).

How to cite: Ramjohn, P. and Farrick, K.: High Intensity Rainfall Event Contributions to Stormflow and Stream Residence Time in the Acono Watershed, Trinidad., EGU General Assembly 2026, Vienna, Austria, 3–8 May 2026, EGU26-15744, https://doi.org/10.5194/egusphere-egu26-15744, 2026.

EGU26-16235 | ECS | Posters virtual | VPS9

Hydrological Whiplashes Over India: Patterns, Drivers, and Recurrence 

Paras Sharma and Vimal Mishra

Climate change is driving a marked intensification of hydrological extremes, including both droughts and floods. When these opposing conditions occur in close succession, known as hydrological whiplash, they generate compounded impacts on ecosystems, infrastructure, and human livelihoods. We analyze hydrological whiplash across India using observed streamflow data and simulations from the validated H08-CaMa-Flood model. The results indicate that nearly 90% of streamflow stations experienced at least one whiplash event, with drought-to-flood transitions being both more common and more abrupt than flood-to-drought shifts. These events are concentrated primarily during the monsoon season, but their occurrence has increased in the non-monsoon months in recent decades, particularly in high-elevation regions. Moreover, we find that whiplash events are becoming more frequent and more intense, while the interval separating dry and wet extremes is shrinking, signaling an escalation of hydrological volatility across the country. Together, these patterns underscore the need for strengthened monitoring, early warning capabilities, and adaptive water management strategies to reduce the growing risks associated with rapid hydrological transitions under a warming climate.

How to cite: Sharma, P. and Mishra, V.: Hydrological Whiplashes Over India: Patterns, Drivers, and Recurrence, EGU General Assembly 2026, Vienna, Austria, 3–8 May 2026, EGU26-16235, https://doi.org/10.5194/egusphere-egu26-16235, 2026.

EGU26-16329 | ECS | Posters virtual | VPS9

Dynamics of Sectoral Water Demand and Future Water Stress Hotspots in Indian River Basins 

Anuj Prakash Kushwaha and Vimal Mishra

Terrestrial water availability in India is increasingly affected by both climate variability and human activities such as groundwater extraction, reservoir operations, and the expansion of irrigation. However, the observed trends in these factors and their future changes at the river basin level are still not well quantified, making it difficult to plan effective water management strategies. In this study, we assess the individual and combined impacts of climate change and human interventions on the water budgets of major Indian river basins using an ensemble framework that includes the Community Water Model (CWatM) hydrological models. We specifically analyze the changes in sectoral water demands, including agricultural, domestic, and industrial, analyzing their historical progression and projected changes from 1951 to 2100. Based on IMD datasets and CMIP6 scenarios, we identify key regions likely to face water stress in the future and estimate uncertainties in water availability. These findings support the development of sustainable water management plans in response to evolving sectoral trends and climate-related challenges across the Indian subcontinent.

How to cite: Kushwaha, A. P. and Mishra, V.: Dynamics of Sectoral Water Demand and Future Water Stress Hotspots in Indian River Basins, EGU General Assembly 2026, Vienna, Austria, 3–8 May 2026, EGU26-16329, https://doi.org/10.5194/egusphere-egu26-16329, 2026.

Agriculture poses severe impacts on water quality and health due to diffuse pollution via pesticide use. In this study, the impact of pesticide use on water quality in the Polatlı district—a region of intensive agriculture within the Ankara River Watershed—was assessed using the Grey Water Footprint (GWF) methodology. The study analyzed 34 active ingredients utilized in the 2023 production cycle of wheat, barley, onion, and sugar beet. District-level data on cultivated areas (ha) for each crop were obtained from the Turkish Statistical Institute (TURKSTAT) for 2023. For the GWF calculations, the natural background concentration was assumed to be zero, while the maximum allowable concentrations for each pesticide were retrieved from local regulations. A watershed-scale hydrological model, namely Soil and Water Assessment Tool (SWAT) were constructed for the study area and calibrated against observed streamflow data to ensure reliable simulation of pesticide transport. Pesticide applications were integrated into the model based on actual usage data. The pollutant loads transported from the Polatlı district to the Ankara River were calculated and subsequently utilized in the grey water footprint equation.

Our findings reveal that pesticide impacts vary significantly with respect to crop and active ingredient levels. For example, SWAT model simulation results for deltamethrin reveal a high environmental transport efficiency despite its low application rate (250 ml/ha) compared to other pesticides. This pesticide has an extremely high affinity for soil particles as clear from the organic carbon-water partition co-efficient value (Koc = 1,000,000 L/kg); it binds strongly to soil rather than dissolve in water. The transport of deltamethrin is entirely driven by soil erosion, leading to its accumulation in riverine sediments. Due to its extreme Koc value, the pesticide remains associated with suspended solids and bed sediments, posing a significant long-term threat to benthic organisms and aquatic biodiversity. This sediment-related pollution indicates that the GWF of the basin is not only a function of dissolved pollutants, but it can be heavily influenced by sediment quality. No leaching to groundwater or dissolved transport was observed, confirming its strong soil-binding behavior. This substantial variability in GWFs underscores the necessity for region-specific water quality standards to more accurately assess and manage the environmental impact of pesticide use. Our analysis addresses the complexities of mixed cropping systems typical of semi-arid regions, where water scarcity and intensive pesticide use converge to create critical water quality challenges. This study provides a framework for similar assessments in other agricultural regions, aiding in the development of more informed pesticide management strategies to enhance water resource sustainability. Our results highlight specific pesticides requiring priority attention: replacing or limiting high-GWF pesticides is essential for progress toward sustainable water management in the Ankara River basin.

How to cite: Dogan, F. N. and Capar, G.: Assessment of Pesticide-Related Water Pollution in the Ankara River Watershed: A Combined SWAT and Grey Water Footprint Approach, EGU General Assembly 2026, Vienna, Austria, 3–8 May 2026, EGU26-16687, https://doi.org/10.5194/egusphere-egu26-16687, 2026.

Chemical weathering of continental rocks plays a key role in regulating river water chemistry and global biogeochemical cycles. This study investigates the spatial and seasonal variability in major and trace element geochemistry of rivers in the Ganga basin to constrain dominant weathering processes and their downstream evolution. A total of 200 water samples and sediment samples were collected across different hydrological regimes and physiographic settings. The results indicate that dissolved loads are primarily controlled by the weathering of silicate and carbonate lithologies. In the Himalayan headwaters, river chemistry is dominated by carbonate and Ca²⁺–Mg²⁺-rich silicate weathering, with Ca²⁺ + Mg²⁺ and HCO₃⁻ contributing approximately 85% of total cations and anions. In contrast, downstream reaches exhibit a systematic decrease in Ca²⁺ + Mg²⁺ contributions and an increase in Na⁺ + K⁺ proportions (up to ~50%), suggesting enhanced influence of silicate weathering and/or alkaline soil inputs. Trace elements such as  Pb, Hg, Th, Sr, Rb, Mo, U, Ba, and V reveal spatially variable source contributions across different catchments. Sodium-normalized trace metal ratios and Ca/Na* relationships indicate additional contributions from carbonate or Ca²⁺–Mg²⁺-rich silicates, particularly during high-discharge periods. Strontium isotope ratios (87Sr/86Sr) of the Ganga River reflect chemical weathering and sediment sources in the Himalayan region. The river drains diverse lithologies of the Himalaya, causing spatial and seasonal isotopic variations. Higher 87Sr/86Sr values indicate silicate weathering of radiogenic continental crust, especially during monsoon periods. Lower ratios reflect inputs from carbonate rocks and recycled sediments. Sr isotopes highlight the role of Himalayan weathering in controlling riverine Sr flux.These observations highlight the combined influence of lithology, hydrology, and seasonal discharge on riverine geochemistry and provide new constraints on chemical weathering processes and trace element fluxes from the Ganga basin to the ocean.

How to cite: Parida, R. K. and Rai, S. K.: Chemical Weathering Dynamics and Riverine Geochemistry of the Ganga River Basin: Spatial and Seasonal Controls on Elemental Fluxes, EGU General Assembly 2026, Vienna, Austria, 3–8 May 2026, EGU26-16801, https://doi.org/10.5194/egusphere-egu26-16801, 2026.

EGU26-17766 | ECS | Posters virtual | VPS9

Hydrodynamic Changes of Estuarine Islands in the Meghna River under Future Climate Scenarios 

Salah Uddin Ahmed Dipu, Elwa Gemintang, Md. Aminul Haque Laskor, Faysal Bhuiyan, Md Asadullahil Galib Fardin, Md. Mahmudur Rahman, Yeamin Rabbany, and Saiful Islam Fahim

Hydrodynamic processes strongly influence coastal and estuarine landscapes, especially in low-lying deltaic regions like the Meghna Estuary. Islands in the lower Meghna and at the Padma-Meghna confluence face increased risk of submergence due to sea-level rise and intensified precipitation under future climate scenarios. This study analyzes the long-term hydrodynamic changes in the Meghna Estuary using Delft3D simulations for 2000, 2024, and 2050, focusing on islands such as Nijhum Dwip, Moulovi Char, Domar Char, Char Kukri Mukri, Rajrajeshwar, Hatiya, and Manipura. The model covers the area from Baruriya Transit to the sea, integrating tidal and riverine dynamics. Future discharge for 2050 was generated from MIROC6 climate projections under SSP2-4.5 and SSP5-8.5 scenarios, bias-corrected and simulated via HEC-HMS. HEC-HMS was calibrated using 2022 data and validated with 2023 discharge records from Bhairab Bazar, while Delft3D was calibrated and validated using observed water level data from Daulatkhan over the same period. Results show rising tidal amplitudes and water levels, with high tides near Char Kukri Mukri increasing by 30 to 35 cm by 2050. Tidal inundation is expected to expand during monsoons, increasing flood risk in low-lying areas. Islands like Char Kukri Mukri and Hatiya are losing relative elevation, heightening their vulnerability to flooding and storm surges. Hydrodynamic projections indicate an average increase in water depth of 0.5 to 0.8 m around Rajrajeshwar, Hatiya, and Manipura by 2050, suggesting enhanced tidal energy and flow velocities that are likely to accelerate shoreline erosion and land loss, particularly along their southern and eastern margins. These findings highlight the increasing vulnerability of the Meghna Estuary’s islands to climate change–driven hydrodynamic shifts, emphasizing the urgent need for targeted adaptive management, improved flood risk mitigation, and resilience-building measures to protect the region’s communities and ecosystems from future inundation and erosion risks.

How to cite: Ahmed Dipu, S. U., Gemintang, E., Haque Laskor, Md. A., Bhuiyan, F., Galib Fardin, M. A., Rahman, Md. M., Rabbany, Y., and Islam Fahim, S.: Hydrodynamic Changes of Estuarine Islands in the Meghna River under Future Climate Scenarios, EGU General Assembly 2026, Vienna, Austria, 3–8 May 2026, EGU26-17766, https://doi.org/10.5194/egusphere-egu26-17766, 2026.

Wetlands play a vital role in the hydrologic cycle since they impact stream flow, add to water storage capacity, provide habitat for many species, and provide resiliency in ecosystems. Ondiri Swamp, which is a peatland located in Kenya with approximately an area of 33 hectares and is the headwaters of Nairobi River has very little hydrological understanding, especially regarding subsurface and groundwater contributions since there have not been any continuous in-situ data measurements. This study aims to quantify water storage and investigate potential groundwater presence using an embedded, multi-sensor dataset.
To overcome the limitation of only using traditional optical index methods for surface water detection under dense vegetation, water occurrence data (Global Surface Water), Sentinel-1 SAR and Sentinel-2 multitemporal optical images, DEM images (Copernicus DEM), and NDVI derived vegetation index data will be combined. Measurements of swamp depth and peat thickness will be collected from short-term field campaigns for calibration of volume estimates and provide preliminary data for a preliminary water balance. The precipitation data (CHIRPS) and ET data (FAO WaPOR) will be combined with inflow and outflow estimates to create a preliminary water balance. Surface storage will be estimated, and potential groundwater contributions will be inferred without long-term observatory data sources. The methods used for the quantitative and qualitative assessment of wetland water resources will generate probabilistic wetland water maps using a multi-temporal remote sensing-based classification of existing datasets, as well as using terrestrial calibrations from field data. 
The study will be able to quantify total wetland water storage, determine the degree to which groundwater may influence wetlands, and identify the seasonal dynamics of wetland hydrology. Through a combination of remote sensing, existing datasets, and terrestrial calibrations from field studies, the study provides a strong, scalable framework for conducting wetland hydrology research, managing wetland ecosystems and planning wetland water resources in areas where very few, if any, hydrological observations are available.

How to cite: Ouedraogo, A.: Estimating Surface and Subsurface Water in Ondiri Swamp, Kenya, Using Multi-Sensor Embedded Data and Preliminary Water Balance, EGU General Assembly 2026, Vienna, Austria, 3–8 May 2026, EGU26-19536, https://doi.org/10.5194/egusphere-egu26-19536, 2026.

EGU26-21040 | ECS | Posters virtual | VPS9

Identifying Scale-Dependent Snow patterns from learned fusion of Multi-modal, Multi-resolution satellite observations 

Getnet Demil, Muhammad Farhan Humayun, Tomi Westerlund, Jukka Heikkonen, and Mourad Oussalah

Snow accumulation and melt dynamics govern water availability and flood timing across high-latitude catchments, yet observational gaps constrain understanding of scale-dependent hydrologic processes. Traditional snow monitoring relies on sparse gauge networks or coarse satellite products, preventing observation of sub-catchment patterns critical for hydrologic connectivity. Recent advances in Sentinel-1 SAR (10m, all-weather) and Sentinel-2 optical (10m, 20m, 60m) constellations offer transformative observational capabilities, yet systematically exploiting their complementary information for continuous fine-resolution snow monitoring across cloud-prone regions remains an operational challenge.

We present an innovative all-weather snow monitoring system that fuses Sentinel-1 SAR backscatter (sensitive to snow wetness and surface properties) with Sentinel-2 optical imagery (discriminating snow from clouds and bare ground) to deliver 10m resolution fractional snow cover estimates across boreal Finland. This fusion approach explicitly addresses the fundamental limitation of optical-only monitoring: persistent cloud contamination prevents observations during critical winter periods in high-latitude regions. Our methodology incorporates quality-aware atmospheric corrections (cloud masks, aerosol optical thickness, water vapor) to extract reliable snow information despite challenging atmospheric conditions.

A data-driven multi-resolution framework bridges the critical scale gap between fine-resolution satellite observations (10m) and operational hydrologic models requiring catchment-aggregated snow states. The system learns scale-dependent aggregation and disaggregation functions directly from observations, preserving fine-scale spatial patterns essential for understanding snow redistribution by wind, sublimation, and terrain-driven processes. This approach captures heterogeneity at forest-canopy scales while remaining compatible with distributed hydrologic model architectures.

Operational validation demonstrates that the system achieves physically realistic snow patterns with spatially coherent uncertainty estimates that appropriately elevate at snow-land boundaries where hydrologic transitions occur. These calibrated uncertainty bounds are critical for risk-informed water management and probabilistic flood forecasting, enabling downstream hydrologic models to appropriately weight observational constraints.

Key scientific innovations: (1) Demonstrated feasibility of all-weather snow monitoring by effectively combining complementary SAR and optical signatures, overcoming the cloud-cover limitation that constrains optical-only approaches during 60-80\% of winter days in boreal regions. (2) Developed a principled multi-scale learning framework that explicitly captures scale-dependent aggregation and disaggregation properties, bridging satellite observations and hydrologic model requirements. (3) Resolved sub-catchment snow heterogeneity previously masked in operational products (MODIS: 500m, VIIRS: 375m), enabling new insights into snow redistribution and hydrologic connectivity across fragmented landscapes. (4) Quantified spatial structure in prediction uncertainty, enabling probabilistic hydrologic forecasting that appropriately reflects observational constraints.

This next-generation observational capability addresses critical scientific and operational data gaps: calibrating distributed snow models at relevant scales, improving melt timing predictions through continuous all-weather depletion monitoring, validating snow-pack simulations in data-sparse headwater regions, and quantifying snow-climate feedbacks across heterogeneous landscapes. The framework's transferability to pan-Arctic and mountain regions demonstrates how integrating complementary space-based observations through data-driven fusion unlocks fine-scale process understanding previously limited by observational constraints, advancing our capacity for water security assessment and climate adaptation planning in snow-dependent regions.

How to cite: Demil, G., Humayun, M. F., Westerlund, T., Heikkonen, J., and Oussalah, M.: Identifying Scale-Dependent Snow patterns from learned fusion of Multi-modal, Multi-resolution satellite observations, EGU General Assembly 2026, Vienna, Austria, 3–8 May 2026, EGU26-21040, https://doi.org/10.5194/egusphere-egu26-21040, 2026.

EGU26-21606 | ECS | Posters virtual | VPS9

The Role of Reservoirs in a Glacierized Basin Under Climate Change: An Analysis Using the WEAP Model 

Umaima Abdul Jalil, Brecht D'Haeyer, Sreya Prakash, and Jingshui Huang


The Syr Darya River Basin is a highly glacierized transboundary system where future water availability is strongly influenced by climate change, reservoir operations, and population growth. This study investigates the role of reservoirs in regulating water supply under future climate scenarios using the Water Evaluation and Planning (WEAP) model. Climate projections from the ISIMIP framework under Shared Socioeconomic Pathways SSP1-2.6, SSP3-7.0, and SSP5-8.5 are used to drive hydrological inputs, including streamflow, precipitation, and temperature, while population growth projections represent evolving water demands.

 Results indicate a strong increase in summer unmet demand by 2050, intensifying further by 2090, with peak deficits occurring in July–August. Reservoir refilling remains seasonal across all scenarios but becomes more variable and less reliable by 2090, with deeper drawdowns and reduced buffering capacity under higher-emission pathways.

How to cite: Abdul Jalil, U., D'Haeyer, B., Prakash, S., and Huang, J.: The Role of Reservoirs in a Glacierized Basin Under Climate Change: An Analysis Using the WEAP Model, EGU General Assembly 2026, Vienna, Austria, 3–8 May 2026, EGU26-21606, https://doi.org/10.5194/egusphere-egu26-21606, 2026.

EGU26-22432 | Posters virtual | VPS9

Benchmarking flexible modelling framework Shyft across mainland Norway 

Olga Silantyeva, Shaochun Huang, and Chong-Yu Xu

Developing hydrological models, which are process-aware and reliably transferable across diverse environments remains a challenge. We benchmark Shyft – an open-source, fully FAIR (findable, accessible, interoperable and reusable) flexible modeling framework, across 109 catchments in mainland Norway to evaluate how model structure, forcing uncertainty and calibration objective jointly shape streamflow simulation performance. We adopt large sample hydrology perspective to probe five models “stacks”, providing alternative process choices, such as evapotranspiration (Penman-Monteith vs Priestley-Taylor), snowmelt (temperature-index vs semiphysical) and runoff response (Kirchner vs HBV tank and soil) with multiple goal functions drawn from KlingGupta Efficiency (KGE) and Nash-Sutcliffe Efficiency (NSE), with and without catchment specific precipitation correction. We use a suite of evaluation metrics targeting bias, hydrograph dynamics, low flows and interannual variability. We move beyond crude mean-flow benchmarks toward simple climatological benchmarks, providing an objective context for model skill evaluation, given the seasonal nature of Norwegian catchments.


The evaluation revealed that configurations containing temperature-index snow simulation and Kirchner runoff offer the greatest robustness and generality across all hydrological regimes. In terms of objective functions, KGEbased targets outperform NSE-based targets, with metric combining KGE and box-cox transformed KGE (KGE_bcKGE) identified as a promising generalist objective, which performs well across diverse metrics, including low-flow targeted (KGE(1/Q)) and interannual NSE. Furthermore, precipitation correction was found to be essential for improving performance in Mountain and Inland regimes, suggesting snow undercatch as a primary source of precipitation uncertainty. Among simple benchmarks, daily mean was found to be best predictor setting model expectations for future model intercomparisons in the region. Our results demonstrate the need for balance of structural adequacy, forcing uncertainty and equifinality.


This project is supported by Norwegian Research Council NFR project 336621.

How to cite: Silantyeva, O., Huang, S., and Xu, C.-Y.: Benchmarking flexible modelling framework Shyft across mainland Norway, EGU General Assembly 2026, Vienna, Austria, 3–8 May 2026, EGU26-22432, https://doi.org/10.5194/egusphere-egu26-22432, 2026.

The climate-related risks in South Africa’s Raymond Mhlaba Municipality and similar rural regions include erratic rainfall, recurring droughts, heatwaves, and shifting seasons. These directly threaten agricultural productivity, leading to frequent crop losses and food insecurity. Vulnerability is heightened by reliance on rain-fed small-scale farming, minimal irrigation infrastructure to buffer against climatic shocks, and the use of old farming methods.

The government uses radio, television, newspapers, and flyers to communicate climate change, and universities are trying to produce more extension officers to assist farmers, but the challenge remains unaddressed.  The root causes of this vulnerability are multi-layered: weak data dissemination systems, socio-economic marginalization, land tenure insecurity, infrastructure deficits, and regulatory and governance gaps. Consequently, farmers make key agricultural decisions such as when and what to plant without critical zone science knowledge, leading to frequent crop losses, wasted inputs, and heightened poverty.

As such, having a Climate-Adapt-Farm-Wise-AI (CAFW-AI) which can inform the farmer about the climate change and provide customised suggestions to a farmer to a) use conservation agriculture, drought-tolerant crop varieties, and precision irrigation to enhance productivity and climate resilience b) integrate adaptation and mitigation strategies across the entire food value chain to ensure sustainable food production and reduce greenhouse gas emissions c) employ Sustainable Agricultural Practices (SAPs) such as agroforestry and millet resilience to improve soil health and enhance food security in climate-vulnerable regions, based on their geographical area.

These techniques are crucial for fostering innovation and resilience in agricultural economies, especially in the face of climate change. By integrating these innovations, farmers can enhance productivity, reduce environmental impact, and ensure food security.

The proposed solution to the problem 

The initiative introduces an AI-enabled, open-source mobile platform that delivers localized, real-time agricultural advisories to rural small-scale farmers in climate-vulnerable regions such as the Eastern Cape. Its strategies are threefold:

  • Localized Climate-Smart Decision Support:

By integrating real-time weather data from IoT sensors (local weather stations), information, and Indigenous Knowledge Systems (IKS), the AI model generates tailored recommendations on crop selection, planting times, and resource use. This ensures that decisions are data-driven, context-specific, and actionable for farmers with limited resources.

  • Accessible Communication Channels: The platform disseminates advisories via SMS/USSD in local languages (e.g., isiXhosa), bridging the digital divide for communities with limited or no smartphone access.
  • Feedback-Driven Learning: Farmers contribute local observations (e.g., rainfall, soil moisture, pest outbreaks) into the system. AI processes these inputs alongside satellite and meteorological data, enabling continuous model refinement and ensuring the system evolves with changing conditions.

What sets this initiative apart is the role of real-time weather data from IoT sensors (local weather stations), AI in combining heterogeneous data sources (real-time weather, soil characteristics, and farmer inputs) to generate hyper-local insights that would not be possible through traditional extension methods. Previously, climate advisories were generalized, delayed, and fragmented; now, AI enables predictive analytics and personalized recommendations at scale, even in remote areas.

How to cite: Vambe, W. T.: Climate-Adapt-Farm-Wise-AI (CAFW-AI): Utilizing IoT, AI, and Machine Learning to Enhance Decision-Making and Protect Crops More Effectively Against Climate Change, EGU General Assembly 2026, Vienna, Austria, 3–8 May 2026, EGU26-23177, https://doi.org/10.5194/egusphere-egu26-23177, 2026.

EGU26-245 | ECS | Posters virtual | VPS10

Surface Water Dynamics under Changing Climate: Integrating Multi-Sensor Satellite Observations (1999–2025) across the Falkland Islands 

Nyein Thandar Ko, Alastair Baylis, G.Matt Davies, Deborah Barlow, and Christopher Evans

A major threat to Falkland Islands (FI) biodiversity and livelihoods is a drying climate. As warming continues, FI water security is a growing concern, but we lack baseline data to inform mitigation and adaptation. This study applies an innovative remote sensing approach to monitor long-term surface water variability across the Falkland Islands, aiming to support climate-resilient water management. Using the Google Earth Engine (GEE) platform, historical dynamics from 1999–2021 were derived from the Global Surface Water (GSW) Explorer dataset, while recent trends (2021–2025) were assessed using Harmonized Sentinel-2 MSI Level-2A imagery. Together, these enable the first continuous, multi-decadal assessment of pond, wetland, and lake dynamics across East Falkland, West Falkland, and Lafonia. Preliminary results show a relative decline in surface water extent across East Falkland, West Falkland, and Lafonia from 1999 to 2021. More recent Sentinel-2 observations reveal regionally distinct trends from 2021 to 2025: East Falkland remains relatively stable, West Falkland shows a modest increase, and Lafonia exhibits a pronounced rise with strong seasonal variability. These results align with limited ground observations from the water level monitoring site, where satellite-derived surface water area strongly correlates with recorded maximum water levels, confirming the hydrological consistency of the satellite data. Despite limited ground validation, this proof-of-concept highlights the capability of cloud-based remote sensing tools to monitor hydrological variability at regional scale. This approach illustrates how open-access Earth observation data and hydroinformatics tools can aid early detection of climate-driven water changes and strengthen water management in data-scarce areas. It also establishes a basis for future studies linking satellite data with peatland hydrology and ecosystem resilience.

Keywords: Climate Change Impacts, Surface Water Variability, Remote Sensing, Sentinel-2, Google Earth Engine

How to cite: Ko, N. T., Baylis, A., Davies, G. M., Barlow, D., and Evans, C.: Surface Water Dynamics under Changing Climate: Integrating Multi-Sensor Satellite Observations (1999–2025) across the Falkland Islands, EGU General Assembly 2026, Vienna, Austria, 3–8 May 2026, EGU26-245, https://doi.org/10.5194/egusphere-egu26-245, 2026.

EGU26-1031 | ECS | Posters virtual | VPS10

Mass Conserving LSTM with Dual States for Improved Streamflow Prediction through Quickflow and Slow Storage Separation 

Saurabh Toraskar, M Niranjan Naik, Abhilash Singh, and Kumar Gaurav

Long-Short Term Memory (LSTM) shows exceptional performance for rainfall-runoff modelling, but lacks physical realism. Efforts to integrate mass conserving into the model architecture didn’t translate to significant improvement in predictive accuracy. We build on the Mass-Conserving LSTM (MC-LSTM) by proposing a novel architecture that incorporates two complementary cell states to represent distinct fast and slow hydrologic memory components while maintaining strict mass balance. We introduce a new partition gate for segregating the mass input for long- and short-term memory, and made required architectural changes to incorporate additional cell state. We benchmarked our model against LSTM and MC-LSTM on CAMELS-IND (158 basins) and CAMELS-US (531 basins) using NSE, KGE, Pearson-r, FHV, FLV, and peak timing/magnitude. For the Indian dataset, MC-LSTM-DS surpasses both LSTM and MC-LSTM across all metrics except Pearson-r and FLV, where it exceeds the performance of LSTM but falls short of MC-LSTM. In the low flow regime (FLV), our model decreases the overestimation of LSTM significantly, while MC-LSTM shows severe underestimation. Analysis of the spatial distribution revealed it to be aligned with hydroclimate, where all the models performed better in humid/tropical climates, while performance lacked in arid regions. Investigation of the cell states revealed that the added cell state represents the long-term processes effectively, while the original cell state captures short-term processes. The change in their relative contributions according to the climate characteristic is observed, thus confirming our hypothesis and also providing an interpretable decomposition of the simulated flows. On the CAMELS-US dataset, MC-LSTM-DS demonstrates equal performance as MC-LSTM and LSTM on NSE, and outperforms all the models in KGE, FHV, and Pearson-r. In FLV, it outperforms all the mass-conserving models by a huge margin and is just short of LSTM. This study proposes a novel mass-conserving model that provides an interpretable prediction. We claim MC-LSTM-DS to be the current state-of-the-art for large sample rainfall runoff modelling, as it showed superior performance across two diverse regions. To the best of our knowledge, this study is the first to investigate the effects of strict mass conservation on the diverse Indian region.

How to cite: Toraskar, S., Naik, M. N., Singh, A., and Gaurav, K.: Mass Conserving LSTM with Dual States for Improved Streamflow Prediction through Quickflow and Slow Storage Separation, EGU General Assembly 2026, Vienna, Austria, 3–8 May 2026, EGU26-1031, https://doi.org/10.5194/egusphere-egu26-1031, 2026.

EGU26-2054 | ECS | Posters virtual | VPS10

Real-Time UAV-Deep Learning System for Citrus Orchard Structure and Yield Assessment 

Khaoula Bakas, Amine Saddik, Azzedine Dliou, Mohammed Hssaisoune, Said El Hachemy, Hamza Ait Ichou, Fatima Hmache, Mohammed El Hafyani, Adnane Labbaci, and Lhoussaine Bouchaou

Arid and semi-arid regions are facing more frequent and severe droughts, with annual rainfall often below 200 mm. Large-scale, intensive irrigation further strains these limited water resources. Under these conditions, growers need practical tools to estimate yield and monitor tree health at high spatial detail so they can better manage irrigation and inputs. This work develops and tests an automated, data-driven pipeline for estimating citrus yield at the individual-tree level using UAV imagery and Deep Learning. The pipeline comprises three main components. First, individual trees and orchard rows are segmented using a lightweight Tiny U‑Net model. Second, a CNN-based model predicts tree-level yield from vegetation indices and field measurements. Third, these predictions are validated through detailed fruit sampling.

The study was conducted in a commercial citrus orchard in a semi-arid region under climate and water stress. High‑resolution UAV imagery was processed into orthomosaics and vegetation index maps, and the Tiny U‑Net was optimized for fast, near real‑time semantic segmentation, enabling precise tree crown delineation and accurate tree and row counts. For yield prediction, the CNN model exploited spatial features from vegetation indices combined with in‑situ data. The validation relied on direct comparison between UAV‑based yield estimates and yields obtained from field sampling and laboratory weighing. Both mean and median yields per tree were computed to capture tree‑level variability. The final dataset, consisting of 34 trees and approximately 340 fruit samples, provided a robust basis for assessing model performance. The Tiny U‑Net segmentation model reached high accuracy, with precision and recall of 94.74% and 94.88%, and an inference time of 12.55 ms per image tile. This shows the model is suitable for real‑time or on‑board use and can reliably map orchard structure at large scale. Tree and row counts derived from the segmentation achieved an R² greater than 0.99, confirming the robustness of the approach. For yield estimation, the CNN model outperformed other machine learning methods, achieving an R² of 0.88 at tree level. Field validation confirmed the practical usefulness of the pipeline, UAV‑predicted yields closely matched ground‑truth values, with both indicating an average yield of roughly 50 kg per tree. Most trees fell between 40 and 70 kg, and the model’s output histogram mean 50.9 kg, and median 51.4 kg aligned well with these field observations.

This robust agreement between model outputs and independent field validation data underscores the system's reliability and operational readiness for accurate, tree-level yield mapping. By integrating precise tree segmentation, high-resolution vegetation indices, and rigorously collected ground truth measurements, this study demonstrates that automated yield maps can be produced with sufficient accuracy to support operational decisions in orchards. This offers a cost-effective and scalable tool for precision agriculture, enabling optimized resource allocation, improved harvest planning, and adaptive management under increasing climate stress.

How to cite: Bakas, K., Saddik, A., Dliou, A., Hssaisoune, M., El Hachemy, S., Ait Ichou, H., Hmache, F., El Hafyani, M., Labbaci, A., and Bouchaou, L.: Real-Time UAV-Deep Learning System for Citrus Orchard Structure and Yield Assessment, EGU General Assembly 2026, Vienna, Austria, 3–8 May 2026, EGU26-2054, https://doi.org/10.5194/egusphere-egu26-2054, 2026.

EGU26-2155 | ECS | Posters virtual | VPS10

A combined approach of UAV data and machine learning algorithms in weeds detection  

Mohammed El Hafyani, Abdelwahed Chaaou, Amine Sadik, Adnane Labbaci, Mohammed Hssaisoune, Abdellaali Tairi, Fatima Abdelfadel, Soufiane Taia, Hamza Ait-Ichou, Ilham Elhaid, and Lhoussaine Bouchaou

The Souss-Massa region is known as the most important agricultural area in Morocco, and one of the most affected regions by climate change and over-exploitation. This situation has required the intervention of new tools to improve water resource management. In this context, the Unmanned Aerial Vehicles (UAVs) images data were used for weeds detection in a Citrus orchard farm. Two sites were considered, the first one planted with 12-years-old and 1.5 years-old clementine trees. After a panoply of image processing from the data collection, following by the georeferencing, the creation of the digital elevation model, the digital surface model, and the elaboration of the orthomosaic image, the machine learning algorithms (MLA) such as Maximum Likelihood Classification, Minimum Distance Classification, Support Vector Machine, were applied for weeds detection and mapping. For both sites, all MLA showed a Cohen’s kappa coefficient higher than 0.6 and an overall accuracy higher than 60%. This study demonstrates how this emerging technology offers farmers opportunities to enhance production while optimizing water usage.

How to cite: El Hafyani, M., Chaaou, A., Sadik, A., Labbaci, A., Hssaisoune, M., Tairi, A., Abdelfadel, F., Taia, S., Ait-Ichou, H., Elhaid, I., and Bouchaou, L.: A combined approach of UAV data and machine learning algorithms in weeds detection , EGU General Assembly 2026, Vienna, Austria, 3–8 May 2026, EGU26-2155, https://doi.org/10.5194/egusphere-egu26-2155, 2026.

Coastal wetlands, characterized by their geomorphological sensitivity and tidal dependence, exhibit pronounced vulnerability under global warming. While the persistent threat of sea-level rise to coastal wetlands has been extensively documented at the macroscale, there remains a lack of systematic quantitative frameworks for mapping these trends to the microscale dynamics of wetland evolution. To address this gap, this paper proposes WetFramework, a novel approach for joint modeling of spatial structure and temporal variation in wetlands. (1) In the encoder, Transformer and Mamba modules are integrated to enhance multiscale feature representation through the synergy of global attention and implicit sequence modeling, with a Token-Driven Attention Mechanism (TDAM) designed to facilitate deep interactions between features. (2) In the decoder, a Wavelet-Enhanced Reconstruction Module (WERM) is introduced to improve spatial structure modeling via wavelet transforms, thereby optimizing boundary delineation and fine detail representation for precise mapping of coastal wetland extents. (3) To capture periodic inundation characteristics, a Fourier-Based Inundation Estimation Module (FBIEM) is further proposed, incorporating tidal-height observations to enable unsupervised modeling of pixel-level hydrological responses and quantitative expression of inundation rhythms. Extensive experiments conducted in four representative coastal regions—Yancheng and Dongying (China), Mont-Saint-Michel Bay (France), and San Francisco Bay (USA)—demonstrate that the proposed framework outperforms state-of-the-art models across multiple evaluation metrics and exhibits robust cross-regional generalization and dynamic modeling capabilities. This study provides an effective paradigm for intelligent remote sensing-based wetland identification and long-term hydrological modeling, and offers key hydrological information to support inundation-dynamics monitoring and management decision-making.

How to cite: Liang, J.: WetFramework: A Deep Learning Framework for Coastal Wetland Boundary Extraction and Inundation Frequency Estimation, EGU General Assembly 2026, Vienna, Austria, 3–8 May 2026, EGU26-2567, https://doi.org/10.5194/egusphere-egu26-2567, 2026.

EGU26-3158 | Posters virtual | VPS10

Revisiting a riparian invasive shrub and its biocontrol in the western United States: Measured Changes in Water Use 

Pamela Nagler, Emily Palmquist, Keirith Snyder, Eduardo Jimenez-Hernandez, and Kevin Hultine

In 2001, the tamarisk leaf beetle (Diorhabda spp.) was released as a biological control agent for invasive tamarisk (Tamarix spp.), which dominates many floodplains in the western United States (US) and substantially alters riparian ecosystem structure and function. Since its release, the beetle has expanded across thousands of river kilometers, repeatedly defoliating tamarisk far beyond original release sites. Although biological control offers an alternative to mechanical or chemical removal, its ecological benefits and tradeoffs remain uncertain. Here, we synthesize current understanding of one of the most extensive biological control programs implemented in North America, evaluating impacts on riparian evapotranspiration (ET) and riverine hydrology. We assess ongoing challenges and opportunities associated with tamarisk biocontrol and consider how western US riparian forests may evolve under reduced tamarisk dominance.

Early management efforts were driven by the assumption that tamarisk consumed exceptionally large volumes of water, motivating legislative and large-scale removal programs. Subsequent studies, however, demonstrated that tamarisk water use is highly variable and comparable to native riparian vegetation such as cottonwood (Populus spp.) and willow (Salix spp.), as well as mixed shrub communities. Reported tamarisk ET since 2000 ranges widely (109–1456 mm yr⁻¹), with mean values near 850 mm yr⁻¹, depending on stand age, density, health, groundwater depth, soil properties, and salinity.

Defoliation by Diorhabda spp. was expected to enhance streamflow by reducing riparian ET, yet observed hydrologic responses have been inconsistent. In past research ET declines exceed 40% relative to healthy tamarisk at some locations, whereas at other sites, reductions are modest or absent, particularly where baseline ET is low. In this current study, we reassess post-defoliation dynamics by analyzing ET across 27 riparian sites from 2014–2023 using Landsat-derived Nagler ET(EVI2) estimates and gridded climate data. Approximately half of the sites exhibited sustained ET reductions averaging a loss of 18% (−142 mm yr⁻¹), while the remainder showed negligible change or increases in ET of 9% (+54 mm yr⁻¹), likely reflecting tamarisk regrowth or replacement by other vegetation. Across all sites, net water savings were modest, averaging a loss of 7% (−48 mm yr⁻¹), consistent with earlier estimates.

These findings reinforce that hydrologic benefits from tamarisk biocontrol are site-specific, often transient, and frequently offset by vegetation recovery or compositional shifts. Consequently, biological control alone is unlikely to yield substantial or reliable increases in water availability for agricultural or municipal use. Predicting future structure and function of western US riparian forests under tamarisk biocontrol requires explicit consideration of ecosystem complexity, spatial heterogeneity, and interacting drivers that will shape whether alternative states favor native vegetation recovery or secondary invasions.

How to cite: Nagler, P., Palmquist, E., Snyder, K., Jimenez-Hernandez, E., and Hultine, K.: Revisiting a riparian invasive shrub and its biocontrol in the western United States: Measured Changes in Water Use, EGU General Assembly 2026, Vienna, Austria, 3–8 May 2026, EGU26-3158, https://doi.org/10.5194/egusphere-egu26-3158, 2026.

EGU26-6937 | Posters virtual | VPS10

Integrating deep learning and hydrological modelling to assess farm roadway runoff risk to inform targeted mitigation in grassland systems 

Lungile Senteni Sifundza, John G. Murnane, Karen Daly, Russell Adams, Patrick Tuohy, and Owen Fenton

Farm roadway networks are an important infrastructure in grassland farms providing access between the farmyard and grazing fields. However, during livestock movement, excreta is deposited on the roadways, especially on bends, T-junctions and at corners where their movement is impeded. Nutrient-enriched soiled runoff generated on these roadways can contribute significantly to water quality degradation if connected to waters (including man-made open drainage ditches). Quantifying the risk associated with farm roadway runoff delivery to waters includes mapping the roadway and drainage networks and identifying sections which contain high pollutant loads and have the potential of generating, mobilising and delivering surface runoff to the drainage channels. In this study, a deep learning (DL) approach was employed to automatically identify internal farm roadway networks and open drainage channels in 5 grassland farms. Aerial imagery and LiDAR-derived digital terrain models were used to train the DL models for identifying farm roadways and open drainage ditches, respectively. The flow direction and flow accumulation were determined using digital elevation models to map farm roadway sections that have the potential to generate and deliver runoff to the drainage network.

Across the 5 farms, a total of 16.7 km of roadway and 13.5 km of drainage channels were identified by the DL models, achieving precisions of 79 % and 64 %, and accuracies of 90 % and 96 %, respectively. Flow accumulation maps were established for each farm to assess delivery pathways and the potential of roadway runoff connectivity to waters. Flow pathways through roadway junctions and at corners were considered critical outranking those on straight roadway sections. Breaking the runoff pathway at these locations will help prevent delivery to waters. The findings of this study indicate that mapping of open drainage channels and internal farm roadways in grassland farms can be automated by using deep learning models. Integrating the automated mapping and hydrological modelling enables more precise identification of critical roadway sections, supporting targeted mitigation to reduce soiled runoff from entering waters and thus enhance water quality protection in grassland farming systems.

How to cite: Sifundza, L. S., Murnane, J. G., Daly, K., Adams, R., Tuohy, P., and Fenton, O.: Integrating deep learning and hydrological modelling to assess farm roadway runoff risk to inform targeted mitigation in grassland systems, EGU General Assembly 2026, Vienna, Austria, 3–8 May 2026, EGU26-6937, https://doi.org/10.5194/egusphere-egu26-6937, 2026.

Abstract: 

In this work, we develop a hydrological model designed to simulate the water balance and runoff processes at the catchment-scale. Instead of using a rectangular grid discretization, the model represents the catchment using a non-homogeneous two-dimensional triangular mesh framework (similar to a triangular mesh in the Finite Element method). This discretization fits a more flexible representation of complex topography and land boundaries. The model is implemented in the Fortran programming language. It depends on the Digital Elevation Model (DEM) to extract the flow pathways starting from upstream and reaching downstream. That guarantees a physically consistent and explicit flow-routing structure across the triangular mesh.

Evapotranspiration is calculated using the Penman–Monteith equation, as the parameters are considered to suit coastal climate conditions. The model utilizes temperature, solar radiation, wind speed, and vapor pressure as atmospheric inputs. The SCS Curve Number method is used to estimate the surface runoff, considering slope, land cover, and soil properties. Meteorological data measurements, including precipitation, temperature, humidity, as well as inflow and outflow discharges, are integrated into the simulations.

Due to its efficient numerical structure, the model supports simulations with numerous spatial elements and long time series while maintaining the computational cost at its lowest limits. This makes it well-suited for large-scale watershed applications and provides a strong basis for future high-performance computing developments.


Keywords: hydrological modeling, watershed triangulation, flow routing, numerical simulation

How to cite: Dali, N.: Hydrological Modelling Framework for Large-Scale Catchments using triangular nonhomogeneous spatial discretization, EGU General Assembly 2026, Vienna, Austria, 3–8 May 2026, EGU26-8171, https://doi.org/10.5194/egusphere-egu26-8171, 2026.

EGU26-8394 | ECS | Posters virtual | VPS10

Uncertainty Evaluation of Hydraulic Jumps in Open-Surface Flows 

Simon Cuny, Panayiotis Dimitriadis, Demetris Koutsoyiannis, G.-Fivos Sargentis, and Theano Iliopoulou

The hydraulic jump is considered to have one of the largest energy losses in the field of Hydraulics. These losses are caused during transition from super-critical to sub-critical flow conditions in the case of open-surface flows. In this study, we focus on a laboratory-scale hydraulic jump combining both experimental measurements and model simulations using theoretical arguments. The main objective is to identify, quantify, and interpret the uncertainty in both cases through key parameters, such as the (sub/super) critical depths and channel geometry, for various flow conditions, with emphasis on energy dissipation, turbulence, mixing, regime transitions, and flow stability characteristics .

How to cite: Cuny, S., Dimitriadis, P., Koutsoyiannis, D., Sargentis, G.-F., and Iliopoulou, T.: Uncertainty Evaluation of Hydraulic Jumps in Open-Surface Flows, EGU General Assembly 2026, Vienna, Austria, 3–8 May 2026, EGU26-8394, https://doi.org/10.5194/egusphere-egu26-8394, 2026.

EGU26-8717 | Posters virtual | VPS10

Analysis of Heavy Precipitation and its Typical Weather Patterns over the Upper Reaches of the Yellow River 

Changrong Tan, Yaoming Ma, Xuelong Chen, Weimo Li, and Qiang Zhang

The frequency of disasters induced by heavy precipitation (HP) in the upper reaches of the Yellow River Basin (URYR) has increased notably. This study had further elucidated the structure and interactions of synoptic systems across different pressure levels and quantitatively characterized the anomalous driving factors. Four weather types had been identified: Xinjiang Trough (Type1, constituting 35% of HP), Mongolian Trough (Type2, 14%), Westward–Extension Western Pacific Subtropical High (WPSH) (Type3, 43%), and Cut–Off Cyclone (Type4, 8%). Influenced by the troughs, the moisture anomalies are transported by the southwesterly jet originating from Bay of Bengal low-pressure systems. In Type3, the WPSH and South Asian High demonstrate the greatest zonal expansion and central intensity (reaching 12610 gpm); this type distinguished by maximal moisture and energy, exhibits the most pronounced extreme properties. The most notable characteristic of Type4 is its stability and persistence presented the most favorable dynamic conditions, despite occurring with the lowest frequency. Due to the anomalous evolution of atmospheric circulation, the anomalies in potential vorticity, column-integrated precipitable water, and convective available potential energy increase; negative anomalies in vertical velocity and moisture flux divergence decline dramatically within 12 to 6 hours preceding HP, signaling anomalous moisture convergence coupled with ascending motion. Low-level moisture is impeded and diverted by the TP topography, generating northerly flow along its eastern flank and forming a distinct “moisture corridor”. Orographic uplift introduces pronounced vertical component to the moisture flux vectors and intensifies local circulations, thereby promoting the initiation and organization of mesoscale systems. The vertical moisture advection serves as dominant mechanism driving HP, while zonal or meridional moist enthalpy predominantly contributes to the physical processes driving the ascending motion under different patterns. These findings may offer a scientific basis for the prediction of HP events in the region. 

How to cite: Tan, C., Ma, Y., Chen, X., Li, W., and Zhang, Q.: Analysis of Heavy Precipitation and its Typical Weather Patterns over the Upper Reaches of the Yellow River, EGU General Assembly 2026, Vienna, Austria, 3–8 May 2026, EGU26-8717, https://doi.org/10.5194/egusphere-egu26-8717, 2026.

EGU26-8732 | Posters virtual | VPS10

Tracking The GER Dam Impoundment Stages Using SWOT and Other Radar Altimetry Products 

Mahir Tazwar, Roelof Rietbroek, Ben H.P. Maathuis, and Amin Shakya

Monitoring of inland water bodies is considered crucial for effective water resource management. In this study, a combination of satellite imagery and altimetry products was utilized to monitor changes in water level and surface extent during the different operational filling phases of the Grand Ethiopian Renaissance (GER) Dam. The primary objective was to utilize diverse remote sensing products to provide an accurate estimation of water volume changes over time. Sentinel-1 data were processed using an unsupervised edge Otsu algorithm to map reservoir extents. These output maps were validated against Planet and Sentinel-2 water masks, and a high level of agreement was observed, with overall accuracy values ranging from 0.97 to 0.99. Furthermore, various Surface Water and Ocean Topography (SWOT) satellite products were evaluated for the estimation of reservoir extents. It was found that the SWOT Lake Single Product performed poorly, with an Intersection over Union (IOU) value of approximately 0.33 being recorded. In contrast, moderate agreement with validation sets was demonstrated by the SWOT water mask raster and pixel cloud products, with overall accuracy values ranging from 0.78 to 0.89 being observed. Volume variation across different dam operational phases was estimated through the application of satellite-based observations and a DEM contouring method. Although a high correlation (R2 value of 0.98) was exhibited by both methods, significant differences in absolute values were identified (RMSE value of 2736.35 km3). These discrepancies are attributed to a potential scaling error and the inherent water slope present within the GER Dam reservoir.

How to cite: Tazwar, M., Rietbroek, R., Maathuis, B. H. P., and Shakya, A.: Tracking The GER Dam Impoundment Stages Using SWOT and Other Radar Altimetry Products, EGU General Assembly 2026, Vienna, Austria, 3–8 May 2026, EGU26-8732, https://doi.org/10.5194/egusphere-egu26-8732, 2026.

EGU26-10090 | Posters virtual | VPS10

Characterizing Baseflow in Indian River Basins Using SWOT Discharge Observations 

Rucha Sanjay Deshpande, Vidushi Vidushi, and Tajdarul Hassan Syed

Baseflow is a crucial component of streamflow, essentially driven by changes in groundwater storage, and is vital for sustaining flows during dry periods. Traditional techniques for baseflow quantification using graphical analysis or digital filters require long-term river discharge observations, which are often limited in their spatial extent. However, with the launch of the Surface Water and Ocean Topography (SWOT) mission, global estimates of river discharge are now available over a period of two years, offering a high-resolution dataset with at least one observation every 21 days. Despite its relatively coarse temporal resolution, prior studies have demonstrated SWOT’s ability to accurately estimate average baseflow even at one observation per cycle, based on synthetic SWOT discharge estimates. The high spatial resolution provided by ‘SWOT discharge’ can be utilized to estimate baseflow at a reach-scale and gain new insights into groundwater-surface water interactions in water-stressed river basins.

In this study, we will utilize SWOT’s discharge products over Indian river basins to characterize baseflow dynamics at reach-scale resolution and examine the effects of climate variability and land-use changes on baseflow. By accurately estimating the baseflow recession parameter (k), this study will be able to identify the gaining-to-losing transition in a basin. Furthermore, the research will explore SWOT’s ability to detect temporal shifts in the baseflow recession parameter (k) during the pre-monsoon period and evaluate the effects of anthropogenic extractions on the groundwater table. Finally, these estimates will be integrated into a mass-balance model, baseflow will be converted into upstream groundwater storage (GWS) changes and validated against independent GWS anomalies derived from the Gravity Recovery and Climate Experiment (GRACE) satellites. This study will demonstrate the capability of SWOT to bridge the gap between reach-scale hydraulics and basin-scale storage, providing a vital tool for sustainable water resource management in water-stressed regions.

How to cite: Deshpande, R. S., Vidushi, V., and Syed, T. H.: Characterizing Baseflow in Indian River Basins Using SWOT Discharge Observations, EGU General Assembly 2026, Vienna, Austria, 3–8 May 2026, EGU26-10090, https://doi.org/10.5194/egusphere-egu26-10090, 2026.

EGU26-10560 | ECS | Posters virtual | VPS10

Uncertainty Evaluation of Hydraulic Losses in Closed Pipes 

Marine Bourbon, G-Fivos Sargentis, Theano Iliopoulou, Demetris Koutsoyiannis, and Panayiotis Dimitriadis

In a context where energy efficiency is a major concern, studying linear and local head-losses in hydraulic networks is essential. These losses are mainly caused by internal fluid friction and network singularities (such as bends, section changes, valves, etc.), have a direct impact on water transport efficiency and management. In this study, we focus on a laboratory-scale hydraulic network combining both experimental measurements and model simulations using theoretical arguments and the EPANET software. The main objective is to identify, quantify, and interpret the uncertainty in both linear and typical local head-losses through key parameters, such as the friction factor and the local-loss coefficient, for various flow conditions.

How to cite: Bourbon, M., Sargentis, G.-F., Iliopoulou, T., Koutsoyiannis, D., and Dimitriadis, P.: Uncertainty Evaluation of Hydraulic Losses in Closed Pipes, EGU General Assembly 2026, Vienna, Austria, 3–8 May 2026, EGU26-10560, https://doi.org/10.5194/egusphere-egu26-10560, 2026.

EGU26-10679 | Posters virtual | VPS10

Contribution of Remote Sensing to the Analysis of the Drying Process of Lake Tanma under Strong Climate Variability 

Mame Diarra Bousso Ndeye, Serigne Mansour Diene, Saidou Ndao, Sabou Sarr, Awa Guèye, and Séni Tamba

Climate variability represents one of the most severe threats to lacustrine ecosystems worldwide, leading to water loss in nearly half of the world’s lakes and reservoirs. On the one hand, this variability is associated with drought conditions, manifested by a decline in precipitation. On the other hand, it is linked to rising temperatures, which enhance evaporation rates at lake surfaces.

In Senegal, a Sahelian country, the prolonged drought period of the 1970s led to the desiccation of several water bodies, including Lake Tanma. In this context, the present study contributes to a better understanding of the drying process of Lake Tanma under climate variability conditions, using remote sensing techniques. Lake Tanma is located in Thiès region, approximately 70 km from Dakar.

To achieve this objective, Landsat Earth observation products were used at the beginning and end of each decade between 1984 and 2024. The time series consists of multispectral images acquired in October, corresponding to the end of the rainy season in Senegal. This choice ensures the capture of the lake’s maximum water extent, thereby minimizing seasonal fluctuations. All data were acquired and processed using the Google Earth Engine platform. The Modified Normalized Difference Water Index (MNDWI) was computed for the entire time series to accurately delineate and characterize water-covered surfaces.

The results reveal a highly variable evolution of the inundated surface area of Lake Tanma, with a variation coefficient of 57.8%. The largest flooded area was observed in 1984, covering 969.33 ha, while the smallest extent was recorded in 2024, with only 76.18 ha. Analysis of intra-decadal variations shows a slight decrease (7%) in the flooded surface, between 1984 and 1989. In contrast, subsequent decades exhibit a marked and progressive regression of the lake’s water surface, reaching 21% during the 2000–2009 decade, 61% during 2010–2019, and up to 89% over the 2020–2024 period.

These decrease trends highlight the influence of hydro-climatic parameters, particularly precipitation and evaporation, which constitute the primary drivers of lake recharge and desiccation. Consequently, further investigation, of hydro-climatic factors, namely rainfall and temperature, is required, to better understand the drying process of Lake Tanma and to assess the impacts of hydro-climatic variability on its long-term dynamics.

How to cite: Ndeye, M. D. B., Diene, S. M., Ndao, S., Sarr, S., Guèye, A., and Tamba, S.: Contribution of Remote Sensing to the Analysis of the Drying Process of Lake Tanma under Strong Climate Variability, EGU General Assembly 2026, Vienna, Austria, 3–8 May 2026, EGU26-10679, https://doi.org/10.5194/egusphere-egu26-10679, 2026.

EGU26-12323 | ECS | Posters virtual | VPS10

Estimation of Crops Water Consumption by Remote Sensing: SEBAL Model Calculations Versus Ground Observation In The Irrigated Area of Lakhmess (Siliana, Northern Tunisia) 

Amani Belhaj Kilani, Alice Alonso, Anis Bousselmi, Slaheddine Khlifi, and Marnik Vanclooster

Tunisian agriculture remains a crucial component of the country’s economic development and faces considerable constraints related to increasing water demand and reducing water resources’ availability. Improving the assessment of irrigation water use is a prerequisite for sustainable water management. The present study aims to evaluate the quality of water consumption estimates in the Public Irrigated Area of Lakhmess using open-source data. High-resolution (10 m) Sentinel 2 images, combined with ERA5-land meterological data, were used to assess monthly and seasonal actual evapotranspiration (ET) and water use through the implementation of the Surface Energy Balance Algorithm for Land (SEBAL) in the Google Earth Engine (GEE) environment. The calculated water uses were combined with the seasonal supplied water to the PIA Lakhmess, collected at plot level.

This study was conducted over eight agricultural campaigns from 2015-2016 to 2022-2023. The method is validated for three sectors Sidi Jaber, Gantra and Gabel, comparing the seasonal water use estimates to water meter observations. Correlation analysis between estimated water use from open-access data and  in-situ measurement yielded correlation coefficients of 0.76, 0.75 and 0.73, with corresponding RMSE values of 0.461, 0.425, and 0,391 mm/day, respectively. In addition, SEBAL-derived evapotranspiration estimates were evaluated through comparison with reference evapotranspiration computed using the FAO-56 Penman-Monteith, resulting in an R²  of 0,68 and an RMSE of 0.315 mm/day. Overall, the methods were deemed satisfactory, as they facilitated the monitoring of excessive water usage by identifying areas where water losses occurred.

Key words: Evapotranspiration, Irrigation, water use, Remote sensing, GEE, SEBAL.

How to cite: Belhaj Kilani, A., Alonso, A., Bousselmi, A., Khlifi, S., and Vanclooster, M.: Estimation of Crops Water Consumption by Remote Sensing: SEBAL Model Calculations Versus Ground Observation In The Irrigated Area of Lakhmess (Siliana, Northern Tunisia), EGU General Assembly 2026, Vienna, Austria, 3–8 May 2026, EGU26-12323, https://doi.org/10.5194/egusphere-egu26-12323, 2026.

EGU26-15829 | ECS | Posters virtual | VPS10

Uncertainty-Aware Flood Prediction Using Deep Neural Networks Across Multiple Watersheds 

Mostafa Saberian, Vidya Samadi, Thorsten Wagener, and Ioana Popescu

Effectively characterizing uncertainty and error in flood prediction is essential for informed decision-making. This study combines advanced deep neural network architectures, i.e., Neural Hierarchical Interpolation for Time Series Forecasting (N-HiTS), and Long Short-Term Memory (LSTM), with multiple uncertainty quantification frameworks to evaluate flood forecasts across several watersheds in the southeastern United States. Bayesian inference, Monte Carlo–based methods, and quantile regression are applied to estimate predictive uncertainty. The comparative analysis examines how different uncertainty approaches perform across a range of flood magnitudes, highlighting their respective advantages and limitations at multiple scales. Results indicate that N-HiTS generally yields narrower and more reliable uncertainty bounds than LSTM. The findings further demonstrate that prior specification in MCMC sampling strongly influences uncertainty estimates and requires careful calibration. While Monte Carlo dropout, which is an approximate Bayesian technique, primarily captures uncertainty near flood peaks, MCMC offers a more complete characterization across the full hydrograph. In addition, this study investigates multi-site training to evaluate model adaptability under diverse hydrological regimes. Collectively, these results advance the integration of deep neural networks and uncertainty quantification to enhance flood modeling capabilities and risk management.

How to cite: Saberian, M., Samadi, V., Wagener, T., and Popescu, I.: Uncertainty-Aware Flood Prediction Using Deep Neural Networks Across Multiple Watersheds, EGU General Assembly 2026, Vienna, Austria, 3–8 May 2026, EGU26-15829, https://doi.org/10.5194/egusphere-egu26-15829, 2026.

EGU26-15872 | ECS | Posters virtual | VPS10

High-resolution operational Flood monitoring in India 

Hiren Solanki and Vimal Mishra

Flood is a recurrent natural disaster, causing socio-economic losses and affecting millions of people every year. High-resolution and near-real time monitoring of flood disasters is critical for a densely populated and hydro-climatically diverse country like India. Existing operational frameworks in India largely rely on coarse-resolution hydrological models and hydrodynamic models, biased meteorological forecasts, limited gauge networks, missing observed data for model setup, static land use, and deterministic forecasts, which constrain their ability to capture basin heterogeneity, reservoir regulation, agriculture expansion, urban influences, and short-term extremes. Here, we present a high-resolution, integrated operational flood monitoring framework using hydrological, hydrodynamic, and data-driven models to provide 5-day ahead forecasts of streamflow, water level, and flood inundation at more than 350 stations across India. We first evaluate meteorological forecasts from UKMO, KMA, ECMWF, and GEFS products to quantify their spatio-temporal skill and estimated systematic biases across hydro-climatic regimes. Consequently, we apply a knowledge distillation–based bias correction approach trained on observed rainfall and temperature data from the India Meteorological Department (IMD), enabling the physically consistent correction of meteorological inputs. These corrected forecasts are then integrated with a process-based hydrological model and a sequential long short-term memory network augmented with a multi-headed attention mechanism, which explicitly learns temporal dependencies, upstream connectivity, and the dynamic relevance of predictors. The forecasted streamflow is then fed into the large-scale hydrodynamic model to forecast water level and flood inundation maps. The proposed stochastic framework aims to achieve substantial improvements in short-lead flood prediction skill, enhanced representation of peak flows and water levels, and more realistic flood inundation dynamics compared to existing operational systems. By combining machine learning-based forecast correction, high-resolution modelling, and advanced deep learning, this study provides a scalable pathway for next-generation flood early warning systems in India, offering direct benefits for evacuation and rescue operations, reservoir operation, agriculture management, and disaster risk reduction at both national and sub-basin scales.

How to cite: Solanki, H. and Mishra, V.: High-resolution operational Flood monitoring in India, EGU General Assembly 2026, Vienna, Austria, 3–8 May 2026, EGU26-15872, https://doi.org/10.5194/egusphere-egu26-15872, 2026.

EGU26-16435 | Posters virtual | VPS10

Ecohydrological and multitemporal analysis of Andean wetlands under climate variabilitiy 

Stefano Sansoni-Koga, Jair Laurente-Torres, Merly Ccaico-Atoccsa, Summy Flores-Quispe, Gabriel Meza-Fajardo, and María Cárdenas-Gaudry

Bofedales are high-altitude wetlands whose functioning is closely linked to surface water availability, playing a key role in hydrological regulation and ecosystem resilience in the Andes. Despite their importance, spatially explicit information on their surface water dynamics remains limited, particularly in data-scarce mountain regions. This study investigates the ecohydrological dynamics of bofedales in the Alto Pampas sub-basin (Huancavelica, Peru) over the 2015–2024 period using a multitemporal remote sensing approach combined with climatic information. Seasonal patterns of bofedal extent and surface water presence were mapped from Landsat 8 imagery using vegetation and moisture indices (NDVI and NDII), together with topographic variables. Bofedales were identified through a Random Forest classification framework and subsequently categorized as permanent or seasonal based on the temporal persistence of hydric signals. Changes in surface water extent and bofedal productivity were quantified, and temporal trends were assessed using the Mann–Kendall test. In addition, generalized additive models were applied to examine potentially nonlinear relationships between climatic drivers and key ecohydrological indicators. The results reveal contrasting surface water trajectories among bofedales, reflecting heterogeneous sensitivity to climate variability within the sub-basin. These findings demonstrate the value of satellite-based monitoring for assessing surface water dynamics in high-Andean wetlands and provide relevant insights for water resources management and climate change adaptation in data-poor mountainous regions.

How to cite: Sansoni-Koga, S., Laurente-Torres, J., Ccaico-Atoccsa, M., Flores-Quispe, S., Meza-Fajardo, G., and Cárdenas-Gaudry, M.: Ecohydrological and multitemporal analysis of Andean wetlands under climate variabilitiy, EGU General Assembly 2026, Vienna, Austria, 3–8 May 2026, EGU26-16435, https://doi.org/10.5194/egusphere-egu26-16435, 2026.

EGU26-19676 | ECS | Posters virtual | VPS10

Modeling Flood Risk in Kalaa Sraghna Region in Morocco Using Explainable Artificial Intelligence Techniques 

Hamza Legsabi, Soufiane Tiai, Sidi Mohamed Boussabou, Nora Najaoui, Bouabid El Mansouri, and Lamia Erraioui

Abstract. Predicting flood risk is a complex phenomenon. Several factors influence flood behavior generation and intensity such as intricate interactions between hydrological dynamics, meteorological variability, the overarching influence of climate change and land-use changes. This study explores flood risk within the watershed of Tassaout River located in the central region of Morocco. Three advanced machine learning algorithms were chosen to evaluate flood risk. These algorithms are Multi-Layer Perceptron Artificial Neural Networks (MLP-ANN), Random Forest (RF) and Support Vector Machine (SVM). The models are trained based on 11 different factors derived from remote sensing data. From ALOS digital elevation model, 8 factors are developed: Elevation, Slope, Aspect, Plan Curvature, Profile Curvature, Stream Power Index (SPI), Topographical Wetness Index (TWI), and Surface Roughness. In addition, from Landsat 9 imagery, three flood susceptibility factors are extracted: Normalized Difference Vegetation Index (NDVI), Normalized Difference Water Index (NDWI) and Land Surface Temperature (LST). The predictive performance of each model was assessed using standard classification metrics: accuracy, recall, and F1-score. Results indicate that the RF model performed the best with an accuracy of 100%, SVM algorithm achieved good performance, attaining 68% in accuracy and more than 80% in f1-score. However, the ANN model underperformed compared to the other algorithms, with an accuracy of only 59% in accuracy and 70% in f1-score highlighting its limitations in capturing the decision boundaries within the current data configuration. Furthermore, the Shapley Additive exPlanations model (SHAP) was used to enhance the transparency and interpretability of the modelling results.

How to cite: Legsabi, H., Tiai, S., Boussabou, S. M., Najaoui, N., El Mansouri, B., and Erraioui, L.: Modeling Flood Risk in Kalaa Sraghna Region in Morocco Using Explainable Artificial Intelligence Techniques, EGU General Assembly 2026, Vienna, Austria, 3–8 May 2026, EGU26-19676, https://doi.org/10.5194/egusphere-egu26-19676, 2026.

EGU26-20408 | Posters virtual | VPS10

Centralizing in-situ Hydrological measurements for satellite altimetry validation: the INSIGHT platform  

Marine Dechamp-Guillaume, Valentin Fouqueau, Jérémy Hahn, Péïo Gil, Estelle Grenier, Jean-Christophe Poisson, Eva Le Merle, Mahmoud El Hajj, Marco Restano, and Filomena Catapano

Reliable validation of satellite altimetry over inland waters relies on long-term, high-quality in-situ water height measurements over different types of waterbodies. The strategy implemented in the St3TART Follow-On (FO) project relies on controlled super sites to produce high quality Fiducial Reference Measurements (FRMs) and on a high number of data provided by public national hydrological networks considered as opportunity sites.

However, these measurements from national hydrological networks remain highly heterogeneous in terms of formats, units, and metadata description, limiting their direct large-scale use for Cal/Val activities. The first step of data uniformization has been performed by vorteX-io team during St3TART-FO project. As an adaptation of the validation strategy for Sentinel-3 is considered for CRISTAL inland waters products, this uniformization work should be extended to cover more virtual stations for other altimetry missions.

This contribution presents the hydrological component of the Hydro-Cryo in-situ platform, INSIGHT, an ESA-funded project, extension of CRISTAL IN-PROVA project, aiming at the centralization and harmonization of publicly available in-situ water surface height data across Europe. This work participates in the preparation for the Cal/Val phase of the future CRISTAL mission and in support of ongoing Sentinel-3 validation activities, with support from the European Environment Agency (EEA) as coordinator of the Copernicus In-Situ component.

In this first phase, the platform will integrate data from twelve national hydrological networks covering France, Switzerland, Belgium (Wallonia), Ireland, Portugal, Norway, Poland, Italy, Slovenia, Croatia, the Netherlands and Germany. The data from fixed in-situ sensors deployed on Cal/Val super sites for Sentinel-3 will also be integrated in the platform. The back-end architecture is designed to easily integrate additional networks in Europe and all over the world. Native temporal resolutions provided by in situ sensors are preserved without aggregation or resampling, and up to ten years of historical observations are considered when available.

The harmonized hydrological datasets will be disseminated on a dedicated Data Hub developed by NOVELTIS together with reference Cryosphere data for satellite altimetry validation. This open-access platform is designed to serve the Cal/Val community by providing a unified entry point for inland water and cryosphere reference measurements relevant to multiple altimetry missions.

The core objective of the hydrological processing chain is the harmonization of in-situ water height measurements by standardizing measurement units and metadata across heterogeneous national public datasets. Attention is given to the consistency of the altimetric reference of the in-situ sensors. This harmonization is essential for the use of in situ stations as FRMs for the validation of both Sentinel-3 and CRISTAL, as well as for others satellite altimetry missions.

Beyond the altimetry community, this platform addresses the broader hydrological community by providing access to a standardized water height dataset from public national networks. By lowering technical barriers to data use, the infrastructure supports cross-border hydrological studies and contributes to the reuse of public hydrological observations.

This project, currently under development, establishes the data infrastructure for the needs of inland water altimetry validation, while simultaneously enabling wider scientific exploitation of harmonized in-situ water level observations at the European scale.


How to cite: Dechamp-Guillaume, M., Fouqueau, V., Hahn, J., Gil, P., Grenier, E., Poisson, J.-C., Le Merle, E., El Hajj, M., Restano, M., and Catapano, F.: Centralizing in-situ Hydrological measurements for satellite altimetry validation: the INSIGHT platform , EGU General Assembly 2026, Vienna, Austria, 3–8 May 2026, EGU26-20408, https://doi.org/10.5194/egusphere-egu26-20408, 2026.

EGU26-22246 | ECS | Posters virtual | VPS10

Man-Made or Natural: Deciphering the Complex Factors Behind the 2023 Derna FloodDisaster 

Vivek Agarwal and Manish Kumar

On September 10, 2023, the city of Derna in northeastern Libya experienced one of the deadliest flood disasters in Mediterranean and African history. Storm Daniel delivered unprecedented rainfall, with Al-Bayda recording 414 mm and Derna receiving over 100 mm within 24 hours, approximately 270 times the region's typical September average of 1.5 mm. This study employs Synthetic Aperture Radar (SAR) from Sentinel and high-resolution Planet imagery to provide a comprehensive analysis of the flood's spatial extent, infrastructure damage, and the interplay between natural and anthropogenic factors that amplified this disaster.

Our flood extent mapping reveals catastrophic impacts on urban infrastructure. The river channel expanded dramatically from 50 meters to approximately 500 meters in width, while the maximum inundated area extended 1.2 km² from the collapsed dams to the Mediterranean Sea over a distance of 2.5 km. The analysis identifies critical damage to infrastructure including the collapse of two upstream dams, destruction of five road flyovers, and significant damage to ports, bridges, and residential areas.

The disaster's severity was substantially amplified by anthropogenic factors. Historical urban development had rerouted the river through artificial canals, with roads and settlements subsequently constructed on the natural riverbed. The two dams, built in the 1970s and unmaintained since 2002, catastrophically failed, releasing an estimated 30 million cubic meters of water. Mann-Kendall trend analysis of 122-year climatic records reveals a statistically significant warming trend (p ≈ 0, Sen's slope = 0.00798) alongside decreasing overall precipitation (p = 0.027, Sen's slope = -0.0389), suggesting a paradoxical pattern where less frequent but more intense rainfall events are becoming more likely.

The socio-economic impacts were devastating, with nearly 4,000 confirmed fatalities in Derna alone, over 10,000 missing, and economic losses estimated at $80 million. Our findings underscore the critical vulnerability created when urban expansion encroaches upon natural floodplains without adequate infrastructure resilience.

This study demonstrates the power of multi-source satellite remote sensing for rapid disaster assessment and highlights the urgent need for integrated flood risk management that considers both climatic extremes and anthropogenic modifications to natural water systems. The lessons from Derna have profound implications for urban planning, dam safety protocols, and climate adaptation strategies in vulnerable Mediterranean regions facing increasingly extreme weather events.

How to cite: Agarwal, V. and Kumar, M.: Man-Made or Natural: Deciphering the Complex Factors Behind the 2023 Derna FloodDisaster, EGU General Assembly 2026, Vienna, Austria, 3–8 May 2026, EGU26-22246, https://doi.org/10.5194/egusphere-egu26-22246, 2026.

EGU26-22992 | Posters virtual | VPS10

Comparison of Irrigation Scenarios in the Ebro Basin Using the SASER Modelling Chain 

Anaïs Barella-Ortiz, Pere Quintana-Seguí, Judith Cid-Giménez, Roger Clavera-Gispert, Victor Altés-Gaspar, Josep Maria Villar, Simon Munier, Pierre Laluet, Luis Enrique Olivera-Guerra, and Olivier Merlin
Water is a key resource for agricultural production and sustainable water resources management, particularly in Mediterranean regions where water availability is highly variable. Improving irrigation management is, therefore, essential to enhance water-use efficiency. In this context, land surface models provide a valuable tool to simulate irrigation practices and assess their impacts at regional scale. This study presents a comparison of irrigation scenarios simulated with the SASER modelling chain over the agricultural irrigated areas located within the Ebro basin (northeastern Spain).
 
SASER is a physically based and distributed hydrological modelling chain that couples SAFRAN meteorological forcing with the SURFEX modelling platform, which includes an irrigation scheme. Drainage and runoff outputs are then provided to the RAPID scheme via the Eaudyssée platform to estimate streamflow. Three irrigation scenarios were defined: default, optimal, and realistic. The default scenario uses the standard irrigation parameters of the SURFEX irrigation scheme. The optimal and realistic scenarios share irrigation parameters derived from a farmer survey conducted in the Algerri-Balaguer region (eastern part of the Ebro basin). The main difference between both lies in the irrigation threshold: the optimal scenario considers the FAO-recommended threshold, while the realistic scenario is derived from in-situ data from the survey region, reflecting local conditions and more realistic irrigation behaviour.  
 
Overall, comparing the optimal and realistic scenarios, results show an average difference of about 20% in irrigation amounts, while differences in evaporation remain below 5%, and drainage differences range between 20% and 30%. Flood irrigation zones located along the Ebro riverbed and in the delta exhibit smaller differences between scenarios. In contrast, drip irrigation areas at the confluence of the Cinca and Segre rivers show the largest discrepancies. Overall, the study demonstrates how scenario-based modelling can support water management strategies and promote sustainable irrigation in the region.

How to cite: Barella-Ortiz, A., Quintana-Seguí, P., Cid-Giménez, J., Clavera-Gispert, R., Altés-Gaspar, V., Villar, J. M., Munier, S., Laluet, P., Olivera-Guerra, L. E., and Merlin, O.: Comparison of Irrigation Scenarios in the Ebro Basin Using the SASER Modelling Chain, EGU General Assembly 2026, Vienna, Austria, 3–8 May 2026, EGU26-22992, https://doi.org/10.5194/egusphere-egu26-22992, 2026.

EGU26-1322 | ECS | Posters virtual | VPS11

From Contamination to Forecast: Linking Anthropogenic Hydrological Change to Ecological Risk in Poyang Lake 

Areej Sabir, Wang Hua, Abdul Hanan, Yanqing Deng, and Xiaomao Wu

Anthropogenic activities including industrial and agricultural discharges, sand mining, and water regulation have drastically altered the hydrological regime and water quality of Poyang Lake, China’s largest freshwater lake. These modifications lead to non-stationary inputs of heavy metals (e.g., As, Hg, Cr, Se) and nutrients, driving eutrophication and posing significant risks to aquatic ecosystems.

This study analyses multi-year (2018–2020) water quality data from key inflow sites to quantify human impacts on contaminant regimes. Results reveal strong seasonal patterns: heavy metal concentrations (As, Hg) peak during low-flow periods, whereas nutrient loads and algal blooms intensify following high-flow events linked to agricultural runoff. This dynamic hydrological contamination directly threatens the endangered Yangtze finless porpoise (Neophocaena asiaeorientalis), with tissue analyses showing high bioaccumulation of Hg and Cu in the liver, indicating significant ecological risk.

Building on these findings, we highlight the urgent need for forecasting frameworks tailored to human-influenced catchments. We propose integrating process-based hydrological models with water quality modules and machine learning techniques to simulate contaminant transport under non-stationary climatic and anthropogenic drivers. Furthermore, we demonstrate how remote sensing and continuous sensor data can improve the monitoring of pollutant sources and algal blooms. Finally, we outline a pathway towards ecological risk forecasting by coupling hydrological-water quality predictions with bioaccumulation models for vulnerable species.

This work underscores the critical gap in forecasting tools for heavily modified systems and provides a case for developing coupled human-natural models to support early warning systems and adaptive management strategies for biodiversity conservation.


How to cite: Sabir, A., Hua, W., Hanan, A., Deng, Y., and Wu, X.: From Contamination to Forecast: Linking Anthropogenic Hydrological Change to Ecological Risk in Poyang Lake, EGU General Assembly 2026, Vienna, Austria, 3–8 May 2026, EGU26-1322, https://doi.org/10.5194/egusphere-egu26-1322, 2026.

EGU26-1658 | ECS | Posters virtual | VPS11

Integrating Intensity–Duration and Antecedent Rainfall Thresholds for Shallow Landslide Prediction in the Eastern Himalaya, India 

swagat kar, Pratik Chaturvedi, and Harendra Singh Negi
  • Rainfall-induced shallow landslides pose a persistent hazard in the Eastern Himalaya, particularly along the strategically important Balipara–Charduar–Tawang (BCT) corridor in western Arunachal Pradesh, India. This study develops a region-specific rainfall threshold framework by integrating long-term rainfall trend analysis with empirical landslide-triggering thresholds to enhance early warning capabilities in this data-scarce, high-relief terrain. Daily gridded rainfall data from the India Meteorological Department (2000–2020) and an inventory of 236 landslide events recorded between 2008 and 2015 were analyzed. Trend analysis reveals a statistically significant decline in annual rainfall (–81.05 mm yr⁻¹), accompanied by pronounced inter-annual variability and persistent monsoonal dominance. Empirical analysis indicates that short-term antecedent rainfall plays a critical role in slope failure initiation, with 3-day and 5-day cumulative rainfall showing the strongest correlation with landslide occurrence (R² = 0.508 and 0.480, respectively). Corresponding 80th percentile thresholds of ≥89.24 mm (3-day) and ≥118.80 mm (5-day) are proposed as practical triggering criteria. In addition, an intensity–duration (I–D) threshold derived from 95 rainfall-induced landslides follows a negative power-law relationship (I = 17.26·D⁻⁰·¹⁰), capturing the influence of short-duration, high-intensity rainfall events. The combined use of antecedent rainfall and I–D thresholds effectively represents both progressive soil saturation and rapid-onset rainfall triggers. This integrated threshold framework provides a robust and scalable basis for landslide early warning system development along the BCT corridor and offers broader applicability to similar monsoon-dominated Himalayan regions.

How to cite: kar, S., Chaturvedi, P., and Negi, H. S.: Integrating Intensity–Duration and Antecedent Rainfall Thresholds for Shallow Landslide Prediction in the Eastern Himalaya, India, EGU General Assembly 2026, Vienna, Austria, 3–8 May 2026, EGU26-1658, https://doi.org/10.5194/egusphere-egu26-1658, 2026.

EGU26-3205 | ECS | Posters virtual | VPS11

Implementation and Evaluation of the WRF-Hydro Model for Hydrometeorological Forecasting in the Piura River Basin, Peru 

Juan Carlos Tufino, Adrian Huerta, Waldo Lavado-Casimiro, Gustavo De la Cruz, Danny Saavedra, and Alexis Ibañez

Extreme hydro-meteorological events associated with the Coastal El Niño phenomenon represent a critical threat to the socioeconomic stability of the northern coast of Peru. In particular, the Piura River basin, characterized by its complex topography and short concentration times, requires precise monitoring and modeling to address these episodes. Currently, the National Meteorology and Hydrology Service of Peru (SENAMHI) employs a semi-distributed system (ARNO/VIC coupled with RAPID) for the operational assessment of flood risk. However, the increasing intensity and frequency of recent events highlights the need for tools that explicitly represent physical processes at higher resolution. This research proposes the implementation of the fully distributed WRF-Hydro model, focusing the methodology on the reconstruction and analysis of the main extreme flood events within the period covered by the PISCOp_h product, a gridded hourly precipitation observational dataset developed by SENAMHI for 2015–2020. The methodological strategy is based on generating a hybrid meteorological forcing to feed the hydrological model. For this purpose, an atmospheric simulation is carried out with WRF, forced by initial and boundary conditions from the GFS, obtaining high-resolution distributed atmospheric fields. Given the uncertainty of the modeled precipitation, the rainfall field generated by WRF is replaced by the hourly gridded observations from PISCOp_h, ensuring controlled and realistic forcing. With this configuration, model calibration and validation are performed. Calibration prioritizes the highest-magnitude events, highlighting the 2017 Coastal El Niño episode for the adjustment of physical parameters, while validation considers a set of floods recorded between 2015 and 2020, evaluating the robustness of the system. It is expected to demonstrate that this combination of atmospheric dynamics and observational accuracy constitutes a physically consistent and operationally viable tool for predicting intense floods, strengthening flood risk management in Peru.

How to cite: Tufino, J. C., Huerta, A., Lavado-Casimiro, W., De la Cruz, G., Saavedra, D., and Ibañez, A.: Implementation and Evaluation of the WRF-Hydro Model for Hydrometeorological Forecasting in the Piura River Basin, Peru, EGU General Assembly 2026, Vienna, Austria, 3–8 May 2026, EGU26-3205, https://doi.org/10.5194/egusphere-egu26-3205, 2026.

EGU26-3693 | Posters virtual | VPS11

Designing efficient rain-gauge networks for improved flood forecasting in a large river basin 

Sanjaykumar Yadav and Ayushi Panchal

Accurate runoff estimation is fundamental to improving streamflow forecasting, particularly in large river basins with sparse or uneven rain-gauge coverage. This study investigates the identification of representative rain gauges from a densely but randomly distributed network to support reliable runoff simulation in data-limited regions. The Middle Tapi Basin (MTB), comprising 26 operational rain gauges and extensive ungauged areas, is used as a case study. Four approaches—Hall’s method, K-means clustering, hierarchical clustering (HC), and self-organizing maps (SOM)—are applied to identify key rain gauges that effectively capture the spatial variability of basin-scale rainfall. Hall’s method selected 15 representative stations, whereas the clustering-based approaches identified nine stations each. The performance of the resulting rain-gauge networks is evaluated by simulating basin runoff using a lumped hydrological model. Results indicate that the rain-gauge network derived from Hall’s method consistently produces superior runoff simulations compared to the clustering-based networks, demonstrating improved representation of rainfall inputs at the basin scale. Based on these findings, the use of 15 key rain gauges identified through Hall’s method is recommended for runoff prediction in the Middle Tapi Basin. The proposed framework is transferable and can be applied to other large basins with heterogeneous rainfall patterns and limited monitoring infrastructure, offering a practical approach for optimizing rain-gauge networks to enhance hydrological modelling and flood forecasting.

How to cite: Yadav, S. and Panchal, A.: Designing efficient rain-gauge networks for improved flood forecasting in a large river basin, EGU General Assembly 2026, Vienna, Austria, 3–8 May 2026, EGU26-3693, https://doi.org/10.5194/egusphere-egu26-3693, 2026.

EGU26-4740 | ECS | Posters virtual | VPS11

Implementing Environmental Flows in Transboundary Rivers under Climate Change 

Karishma Bhatnagar Malhotra and Arvind Kumar Nema

Rapid dam construction, rising water demand, climate change, and increasing pollution are exposing critical weaknesses in the governance of freshwater systems worldwide, particularly in shared river basins. Although environmental flows (e-flows) are widely recognised as essential for sustaining riverine ecosystems and long-term water security, their integration in transboundary water governance has remained largely symbolic, weakly enforced, and poorly adapted to climatic uncertainty. Even durable agreements in several regions prioritise volumetric allocation and procedural cooperation, offering limited mechanisms to safeguard e-flow regimes, as illustrated by treaties such as the Indus Water Treaty and the Ganga Water Sharing Treaty. This study argues that the persistent failure to operationalise transboundary e-flows in national and transboundary river basin governance frameworks reflects a deeper and systematic governance implementation gap that has not been adequately addressed in existing literature. Much of the literature examines legal provisions, economic instruments, and monitoring systems as separate domains rather than as interdependent components of operational governance. As a result, many transboundary river agreements pair legal allocation rules with flow monitoring but fail to link these to enforceable e-flow obligations or adaptive responses. To investigate this gap, the study undertook a structured comparative analysis of ten major international treaties and river basin agreements across Asia, Africa, Europe, and North America, covering both bilateral and multilateral transboundary river systems. Existing treaties were assessed to identify why most fail to deliver implementable e-flow solutions, while arrangements where elements of effective implementation exist were examined to extract transferable best practices for future transboundary water agreements. Based on the findings, the study proposes a three-tier governance framework to operationalise transboundary e-flows under climate uncertainty. The framework integrates climate-adaptive legal obligations, economic and financial mechanisms, and monitoring, reporting, and verification systems supported by remote sensing and GIS. By reframing e-flows as an implementable component of cooperative water security, this study makes both a conceptual and practical contribution to transboundary water governance, with implications for ecological resilience, conflict reduction, and long-term regional stability.

Keywords : Water demand, Climate change, River basin treaties, Ecological resilience

How to cite: Malhotra, K. B. and Nema, A. K.: Implementing Environmental Flows in Transboundary Rivers under Climate Change, EGU General Assembly 2026, Vienna, Austria, 3–8 May 2026, EGU26-4740, https://doi.org/10.5194/egusphere-egu26-4740, 2026.

EGU26-8119 | ECS | Posters virtual | VPS11

Knowledge Distillation of PlanetScope Imagery for Metre-Scale Lake Water-Quality Mapping 

Ying Deng, Daiwei Pan, Simon Yang, and Bahram Gharabaghi

Effective management of eutrophication in inland lakes requires spatially continuous information on key water-quality variables at management-relevant scales. However, metre-scale mapping of total phosphorus (reported as “Phosphorus, Total”, PPUT; µg/L) remains difficult to achieve using conventional in-situ sampling, and nearshore gradients and tributary plumes are often poorly resolved by medium-resolution satellite sensors. In this study, we exploit multi-generation PlanetScope imagery (Dove Classic, Dove-R, and SuperDove; 3–5 m, near-daily revisit) to develop a hybrid, physics-informed AI framework for PPUT retrieval in Lake Simcoe, Ontario, Canada. PlanetScope surface reflectance is combined with short-term meteorological descriptors (3–7-day aggregates of air temperature, wind speed, precipitation, and sea-level pressure) and in-situ Secchi depth (SSD) to train five ensemble-learning models (HistGradientBoosting, CatBoost, RandomForest, ExtraTrees, and GradientBoosting) across eight feature-group regimes. Inclusion of SSD yields a substantial performance gain, with mean R² increasing from ~0.67 (SSD-free) to ~0.94 (SSD-aware), confirming that vertically integrated optical clarity is the dominant constraint on phosphorus retrieval and cannot be reconstructed from surface reflectance alone. To enable scalable SSD-free monitoring, we implement a teacher–student knowledge-distillation scheme in which an SSD-aware teacher transfers its representation to a student using only satellite and meteorological inputs. The optimal student, based on a compact subset of 40 predictors, achieves R² = 0.83, RMSE = 9.82 µg/L, and MAE = 5.41 µg/L on unseen monitoring stations, and is applied to 2020–2025 PlanetScope scenes to generate metre-scale PPUT maps. A 26 July 2024 case demonstrates that >97% of the lake surface remains below 10 µg/L, while rare (<1%) but spatially coherent hotspots >20 µg/L coincide with tributary mouths and narrow channels, highlighting priority areas for management intervention. Although demonstrated here for phosphorus, the PlanetScope–KD framework is model-agnostic with respect to the target variable and can be retrained for other water-quality parameters with optical or hydro-meteorological controls, such as chlorophyll-a, dissolved oxygen, and surface water temperature. This opens a pathway toward unified, high-resolution, multi-parameter lake water-quality prediction to support adaptive monitoring and lake-basin management.

How to cite: Deng, Y., Pan, D., Yang, S., and Gharabaghi, B.: Knowledge Distillation of PlanetScope Imagery for Metre-Scale Lake Water-Quality Mapping, EGU General Assembly 2026, Vienna, Austria, 3–8 May 2026, EGU26-8119, https://doi.org/10.5194/egusphere-egu26-8119, 2026.

EGU26-8693 | ECS | Posters virtual | VPS11

Is blue-green infrastructure effective in reducing urban flood depth and area? 

Pui Kwan Cheung
Cities are prone to pluvial flooding because they are dominated by impervious surfaces. Urban pluvial flooding can cause substantial damages to properties and life. Upgrading existing grey stormwater drainage network is a costly solution. Cities are increasingly turning to blue-green infrastructure to manage stormwater because it provides multiple socio-ecological benefits to cities such as cooling and habitat provision. The volume and peak flow rate of stormwater run-off are commonly used metrics to assess the flood reduction benefits of blue-green infrastructure. However, they do not indicate the severity and extent of flooding. Instead, flood depth and flood area are direct indicators of the severity and extent of flooding. This study aimed to review studies that assessed the effectiveness of blue-green infrastructure in reducing flood depth and flood area on the catchment scale. Five types of blue-green infrastructure were included: stormwater harvesting systems, bioretention systems, urban trees, green roofs, and urban parks. We identified 14 catchment-scale modelling studies that reported the impacts of one of these five types of blue-green infrastructure on flood depth or flood area. Overall, our review found that the median reduction in flood depth across all five types of blue-green infrastructure was 13% (n=11) with urban trees being the least effective (1%) and stormwater harvesting systems the most effective (15%). The median reduction in total flood area was 8%  (n=10) with urban trees being the least effective (0%) and green roofs the most effective (38%). We also found that blue-green infrastructure cannot substantially reduce flood depth or area in large rainfall events. However, there is emerging evidence that long-term economic benefits lie in reducing flood in small and medium rainfall events because they occur far more frequently than large ones. Future studies should prioritise assessing the long-term economic benefits of blue-green infrastructure rather than focusing solely on its effectiveness in flood mitigation in discrete rainfall events.

How to cite: Cheung, P. K.: Is blue-green infrastructure effective in reducing urban flood depth and area?, EGU General Assembly 2026, Vienna, Austria, 3–8 May 2026, EGU26-8693, https://doi.org/10.5194/egusphere-egu26-8693, 2026.

EGU26-8965 | ECS | Posters virtual | VPS11

Impact of Organoclay Content on Hydraulic Performance of Filter Strips to Treat Urban Runoff 

Yaren Ozturk and Derya Ayral Cınar

Impact of Organoclay Content on Hydraulic Performance of Filter Strips to Treat Urban Runoff


Yaren Ozturk 1, Derya Ayral Cınar 2 

1 Marmara University, Istanbul, Turkiye

2 Gebze Technical University, Kocaeli, Turkiye  

Abstract. 

Due to urbanization and climate change, it has become common for urban runoff to carry pollutants to surface water bodies, wastewater treatment plants, infrastructure systems and groundwater. Pollutants transported include heavy metals, solids, nutrients, pathogens and various organic substances such as pesticides and polycyclic aromatic hydrocarbons (PAH). It is proposed to manage this pollutant load at source before it reaches receiving environments.  Nature-based solutions such as filter ditches, infiltration ponds or rain gardens are considered more efficient to manage urban runoff. Among these methods, filter ditches have the highest potential to treat pollutants. It is thought that the use of organoclays, synthesized by the integration of surfactants into the clay mineral structure, as filter material may increase a common contaminant in urban runoff -PAH- removal compared to conventional clay minerals. In addition to treatment efficiency, another important parameter in designing filter ditches is the hydraulic permeability of the filter material. It is desirable that the infiltration rate of the surface flow is slow enough to allow time for pollutant removal and fast enough to prevent ponding on the filter. This study investigated how organoclays, which are proposed to enhance PAH removal from urban runoff, affect the hydraulic permeability of the filter material. Organoclay synthesized by Ca-montmorillonite and HDTMA is used at different percentages in the filter material mixture and hydraulic permeability was determined. Hydraulic conductivity of sand was 4.5x10⁻⁴ cm/s and it dropped to 2.4x10⁻⁵ cm/s and 2.3x10⁻⁵ cm/s when 10% and 20% clay was used, respectively. On the contrary, organoclay at 10% and 20% did not decrease the hydraulic conductivity significantly (to 1.5x10⁻⁴ cm/s and 1.4x10⁻⁴ cm/s, respectively). As hydraulic conductivity is suggested to be 0.3-1.4 x 10⁻⁴ cm/s for surface runoff treatment systems, it appeared that using 20% organoclay is promising to treat emerging pollutants such as PAHs without comprimising the hydraulic performance of the filter system.


Keywords: Nature based solutions, urban runoff, climate change, filter strips, organoclay

How to cite: Ozturk, Y. and Ayral Cınar, D.: Impact of Organoclay Content on Hydraulic Performance of Filter Strips to Treat Urban Runoff, EGU General Assembly 2026, Vienna, Austria, 3–8 May 2026, EGU26-8965, https://doi.org/10.5194/egusphere-egu26-8965, 2026.

To address climate change and population growth, Central Asia must urgently adopt a holistic water resource management strategy, moving beyond traditional sectoral approaches to embrace a water-energy-food-ecosystems (WEFE) nexus approach.  The WEAP model, a key research tool, integrates hydrological data and socioeconomic factors to create scenarios considering glacier melt, irrigation expansion, and energy generation. WEAP, unlike hydrological models, highlights unmet demand, demonstrating the sectoral impacts of water scarcity for decision-makers. The Nexus approach uses the WEAP model to optimize the Vakhsh hydropower cascade (Nurek and Rogun plants), balancing energy security, environmental flows, and predictable agricultural water supply. The WEAP model assesses innovative irrigation technologies in the Zarafshon basin to enhance food security and cross-border cooperation between Tajikistan and Uzbekistan. The scenario analysis shows that modernizing irrigation systems reduces the burden on the ecosystem and ensures stable harvests even in dry years. Integrating climate forecasts into WEAP allows for water availability scenarios, enabling adaptation measures like optimized cropping and expanded runoff management. WEAP modeling in the Vakhsh and Zarafshon basins highlights the importance of cross-sectoral considerations for water resource management in Tajikistan, providing a basis for sustainable water system decisions.

How to cite: Niyazov, J.: A Nexus-Based Approach to Water Resources Assessment: Practical Application of the WEAP Model in Tajikistan, EGU General Assembly 2026, Vienna, Austria, 3–8 May 2026, EGU26-9585, https://doi.org/10.5194/egusphere-egu26-9585, 2026.

The primary goal of hydrological modeling is to generate reliable forecasts of future changes in water resources. In the arid conditions of Central Asia, where irrigated agriculture demands significant water resources during summer, early forecasting is crucial for planning water allocation between upstream and downstream regions.

The WEAP model offers a flexible and user-friendly framework for addressing various water resource management challenges. It supports decision-makers and experts in constructing and selecting optimal solutions for water management. Accurate hydrological forecasts of water availability during the growing season are essential for effective water resource planning. National hydrometeorological services in Central Asia are adopting and adapting modern, effective methods for hydrological forecasting. The primary goal of developing a methodology for forecasting river water content in the Kyrgyz Republic, using the WEAP model, is to create a calculation algorithm, simulate a water management model, and implement this methodology into the practices of the Kyrgyz Republic's National Hydrometeorological Services. This approach will be applied to forecast water availability in the Naryn River during the growing season, monitor changes in the Toktogul Reservoir's water volumes, support hydroelectric power production, and facilitate agricultural irrigation. Advanced forecasts of low water availability during the growing season are vital for implementing preventive measures to ensure efficient water use by water and energy management organizations.

The WEAP model allows for the use of various scenarios, such as climatic ones, with a focus on the national level, while introducing various innovative technologies for irrigation and energy conservation in the upcoming years. This is significant for long-term planning in water management activities and the energy strategy of both the country and the region.

How to cite: Kalashnikova, O.: Predictive WEAP modeling for NEXUS management in the Naryn River basin (Kyrgyzstan), EGU General Assembly 2026, Vienna, Austria, 3–8 May 2026, EGU26-9627, https://doi.org/10.5194/egusphere-egu26-9627, 2026.

EGU26-11912 | ECS | Posters virtual | VPS11

Mapping Inter-State Rice Virtual Water Trade in India Using Complex Network Analysis 

Aditya Badoni and Manne Janga Reddy

Inter-state agricultural trade plays a critical role in redistributing water resources across India, particularly for water-intensive crops such as rice. This study examines the structure of inter-state rice virtual water trade in India using a directed, weighted complex network approach. Physical inter-state rice trade data covering all Indian states were obtained from the Directorate General of Commercial Intelligence and Statistics (DGCIS) and transformed into virtual water flows using crop-specific virtual water content coefficient for rice (m³/ ton), assumed to be uniform across states. This transformation enables an assessment of trade relationships in terms of embodied water transfers rather than physical commodity volumes. States are represented as nodes and directed edges denote rice virtual water flows from exporting to importing states, weighted by total virtual water volumes (m³). Network properties were analysed using strength-based measures to quantify import and export intensities, betweenness centrality to identify states functioning as key intermediaries in trade pathways, and PageRank to assess systemic importance within the national virtual water trade system. These metrics jointly allow differentiation between dominant exporting states, import-dependent states, and structurally central states influencing the overall redistribution of water through trade. The analysis reveals a highly centralized rice virtual water trade network, characterised by a small group of states accounting for a disproportionate share of total virtual water exports. States such as Punjab, Haryana, Andhra Pradesh, Chhattisgarh, Uttar Pradesh, Odisha, and Madhya Pradesh emerge as major exporters, while several other states rely predominantly on inter-state imports to meet rice demand. The concentration of virtual water exports among a limited number of producing regions indicates strong structural dependencies within the national trade network. Several major exporting states like Punjab are also subject to increasing pressure on water resources, the observed trade patterns raise concerns regarding the sustainability of current production-trade configurations. By integrating crop-specific virtual water accounting with complex network analysis, this study provides a quantitative framework for identifying key contributors, dependencies, and structural vulnerabilities in India’s inter-state agricultural water redistribution system. The methodology is transferable to other crops, years, and regional contexts and offers a basis for informing discussions on sustainable agricultural trade and water resource management.

How to cite: Badoni, A. and Reddy, M. J.: Mapping Inter-State Rice Virtual Water Trade in India Using Complex Network Analysis, EGU General Assembly 2026, Vienna, Austria, 3–8 May 2026, EGU26-11912, https://doi.org/10.5194/egusphere-egu26-11912, 2026.

EGU26-12410 | ECS | Posters virtual | VPS11

Multi-Timescale SPEI Drought Forecasting Using Random Forest Regression over Maharashtra, India 

Gaurav Ganjir, Manne Janga Reddy, and Subhankar Karmakar

Accurate drought forecasting is crucial for effective agricultural risk management in semi-arid regions, particularly in drought-prone regions of Maharashtra, India, where the majority of the population relies on farming. This study develops a one-month-ahead drought forecasting using random forest regression, an ensemble tree-based machine-learning algorithm, using the Standardized Precipitation Evapotranspiration Index (SPEI) at multiple temporal scales. Random Forest regression models were trained to forecast SPEI-3, SPEI-6, and SPEI-12, incorporating rainfall, temperature, and derived hydro-climatic predictors. Model performance exhibits clear timescale-dependent predictability, with skill increasing for longer accumulation periods: SPEI-3 (R² = 0.55, RMSE = 0.81), SPEI-6 (R² = 0.65, RMSE = 0.69), and SPEI-12 (R² = 0.87, RMSE = 0.38). Corresponding generalization ratios of 62.4%, 71.8%, and 90.5% indicate improved robustness and reduced overfitting at short (SPEI-3) to long (SPEI-12) timescales. Feature importance analysis consistently highlights the current SPEI state, contributing approximately 35–40% of the total importance, followed by the precipitation minus potential evapotranspiration (PPET) balance and other hydro-climatic variables, reflecting the dominant role of drought persistence and climatic memory in one-month-ahead forecasting. The models successfully capture spatial drought patterns, though reduced accuracy is observed for extreme drought magnitudes at shorter timescales, likely due to inherent climate non-stationarity and rapidly evolving predictor relationships. Overall, this study demonstrates the effectiveness of machine-learning-driven, one-month-ahead drought forecasting across multiple SPEI time scales, enabling near-real-time monitoring and early warning depending on the selected accumulation period. The proposed framework provides a scalable foundation for operational drought early-warning systems in Maharashtra and other drought-prone hydro-climatic regions worldwide.

Keywords: SPEI, Drought forecasting, Random Forest

How to cite: Ganjir, G., Reddy, M. J., and Karmakar, S.: Multi-Timescale SPEI Drought Forecasting Using Random Forest Regression over Maharashtra, India, EGU General Assembly 2026, Vienna, Austria, 3–8 May 2026, EGU26-12410, https://doi.org/10.5194/egusphere-egu26-12410, 2026.

Water scarcity across the Mediterranean is increasingly forcing economies that are deeply integrated into global markets to balance export performance with long-term water sustainability. Research on “virtual water” and trade-related water footprints has grown rapidly, yet it remains fragmented: studies rely on diverse frameworks (physical accounting, MRIO, life-cycle assessment, and hybrids), use non-uniform scarcity metrics, and often treat climate projections and adaptation only implicitly. This review asks: which methods are currently used to estimate the water footprint of trade under climate constraints, what limits their comparability, and what methodological protocol is needed for a robust, policy-relevant application to Morocco? By framing trade-related water footprints as part of coupled human–water systems, the review highlights how economic structures, trade choices, and climate-driven water scarcity interact and generate feedbacks relevant for water governance and policy design.

We follow a PRISMA-type workflow based on systematic searches in Scopus and Web of Science, with explicit inclusion/exclusion criteria and standardized data extraction. Studies are coded along five dimensions: (i) data type (monetary vs. physical); (ii) modelling approach (IO/MRIO, LCA, hybrid); (iii) treatment of scarcity (stress factors, availability indicators, scarcity-adjusted footprints); (iv) integration of climate change (scenarios, downscaling, hydrological modelling); and (v) potential to inform policy (efficiency improvements, reallocation options, abstraction caps, and economic or trade-related instruments). Institutional sources are used in a complementary way to document indicator frameworks and datasets, without replacing the peer-reviewed evidence base.

The review delivers (1) an operational typology of methods used to quantify trade-related water footprints under climate stress; (2) a diagnosis of key comparability barriers (spatial resolution, upstream embodied water through inputs, and the limited use of dynamic approaches); and (3) a practical empirical agenda linking hydrological projections, water-extended input–output frameworks, and decision-relevant scarcity metrics. Outputs will be shared through a reusable coding grid and an analytical framework diagram to support country studies and comparative work across the Mediterranean.

How to cite: Tasra, F. and Mafamane, D.: How Much Water Is Embedded in Trade? A Systematic Review and Research Roadmap for Morocco under Climate Change, EGU General Assembly 2026, Vienna, Austria, 3–8 May 2026, EGU26-14286, https://doi.org/10.5194/egusphere-egu26-14286, 2026.

EGU26-14773 | ECS | Posters virtual | VPS11

Event-Based Calibration of a Physically-Based Hydrological Model for Flood Simulation in the Arno River Basin Tuscany Region 

Hafiz Kamran Jalil Abbasi, Fabio Castelli, and Matteo Masi

Accurate flood forecasting in complex river basins depends on the effective use of high-resolution hydro-meteorological information, physically based hydrological models, and appropriate calibration procedures. This work describes the development of an event-based flood modelling framework for the Arno River basin (Italy), designed to enhance the simulation of flood hydrographs and support operational flood forecasting activities.

Spatially distributed rainfall data were obtained from raster-based precipitation products and transformed into event-specific time series suitable for use within the distributed hydrological model MOBIDIC. Observed discharge records from several gauging stations were retrieved from raw monitoring archives and reorganized into event-based datasets, allowing a coherent and consistent comparison between simulated and observed hydrographs. A unified processing workflow was established to ensure proper temporal synchronization among rainfall inputs, model outputs, and discharge observations.

The proposed framework was tested on major flood events that occurred in November 2023. Model performance was assessed using standard evaluation metrics, including the Nash–Sutcliffe Efficiency (NSE), Root Mean Square Error (RMSE), correlation measures, and time-lag analysis. Results from the initial simulations show that the model is able to capture flood timing satisfactorily, while differences in peak discharge magnitude and recession dynamics indicate the necessity for targeted parameter calibration.

A preliminary manual sensitivity analysis was carried out to identify key soil and hydraulic parameters influencing runoff generation and channel routing processes. Building on these results, an automated calibration approach based on PEST++ is currently being developed to systematically optimize the most sensitive parameters and improve model performance across multiple flood events.

Overall, the presented framework offers a reproducible and scalable methodology for event-based flood modelling and calibration in complex catchments. It provides a solid basis for multi-event analyses, automated calibration, and the future incorporation of data assimilation and artificial intelligence techniques into operational flood forecasting systems.

How to cite: Abbasi, H. K. J., Castelli, F., and Masi, M.: Event-Based Calibration of a Physically-Based Hydrological Model for Flood Simulation in the Arno River Basin Tuscany Region, EGU General Assembly 2026, Vienna, Austria, 3–8 May 2026, EGU26-14773, https://doi.org/10.5194/egusphere-egu26-14773, 2026.

EGU26-15359 | ECS | Posters virtual | VPS11

Applicability of distributed thermal sensing for identifying illicit sewage connections in urban drainage networks under tropical climates 

elias de lima neto, Luis Eduardo Bertotto, and Edson Cezar Wendland

Urban water pollution remains a major challenge for sanitation management in Brazil and other tropical regions. In areas served by separate sewer systems, illicit domestic sewage connections to stormwater drainage networks represent a significant source of contamination of urban runoff and receiving water bodies. Conventional inspection techniques for identifying such contributions are often operationally complex, spatially limited, and therefore rarely applied. Distributed temperature sensing techniques have been successfully used in temperate regions to detect sewage inputs based on thermal contrasts; however, their applicability under tropical conditions remains poorly explored.

This study investigates the thermal signature of domestic sewage in a tropical urban environment and evaluates the detectability of illicit sewage discharges in stormwater systems using a simplified thermal mixing model. Sewage temperature was monitored using thermocouples connected to a data logger with 1-minute temporal resolution in a sewer interceptor located at the São Carlos School of Engineering, University of São Paulo, Brazil, in an area characterized by student housing and food service facilities. Two monitoring campaigns were conducted. Mean sewage temperatures of 27.45 ± 0.45 °C (November 2024–April 2025) and 24.21 ± 0.54 °C (September–November 2025) were observed. A moderate Pearson correlation between sewage temperature and local air temperature (r = 0.58, p < 0.05, n = 140) indicates that atmospheric conditions partially influence sewage thermal variability.

Based on the monitored sewage temperatures (T₂) and stormwater temperature data (T₁) from the literature, a preliminary theoretical model was developed using an instantaneous energy balance approach. The model relates the detectable temperature variation (ΔT) to the sewage fraction (f), defined as the ratio between sewage discharge (Q₂) and stormwater flow (Q₁). Results indicate an exponential relationship between f and ΔT for different thermal contrasts (T₂ − T₁). The minimum detectable sewage discharge was found to be highly sensitive to ΔT, associated with the thermal resolution of the sensing system, while showing direct proportionality to stormwater flow and inverse proportionality to the thermal contrast between sewage and runoff. Future work will focus on model validation under field conditions and its extension to non-stationary flow regimes.

How to cite: de lima neto, E., Bertotto, L. E., and Wendland, E. C.: Applicability of distributed thermal sensing for identifying illicit sewage connections in urban drainage networks under tropical climates, EGU General Assembly 2026, Vienna, Austria, 3–8 May 2026, EGU26-15359, https://doi.org/10.5194/egusphere-egu26-15359, 2026.

EGU26-15614 | ECS | Posters virtual | VPS11

Assessing the Water-Energy-Food Nexus under Climate and Socio-economic Change in Vu Gia – Thu Bon River Basin, Vietnam 

Lieu Hoang, Asaad Y. Shamseldin, Theunis F. P. Henning, Kilisimasi Latu, Conrad Zorn, and Sihui Dong

The Vu Gia – Thu Bon River Basin (VGTBRB), Central Vietnam’s largest river basin (about 10,350 km2), flows through Quang Nam Province and Da Nang City. It supplies water for multiple purposes, including hydropower generation (with around 20 operational upstream hydropower plants), irrigation, and domestic use (accounting for almost 70% of domestic use for Da Nang). While this multifunctional role supports the regional socio-economic development, the basin is increasingly challenged by intensifying water, energy, and food (WEF) demands driven by population growth, urban expansion, tourism development, and salinity intrusion, highlighting the need for an integrated Water-Energy-Food nexus approach.

Despite growing global research on the WEF nexus, no comprehensive statistical WEF nexus models have been developed for the VGTBRB. Previous studies in the region have largely focused on individual sectors, overlooking the role of salinity intrusion and its implications for water demand, food production, and tourism-related resource use. This study addresses this gap by employing a WEF nexus framework combined with System Dynamics Modelling (SDM) to capture sectoral interactions, feedback mechanisms, and trade-offs in water allocation under future climate and socio-economic scenarios. The analysis incorporates historical data from 2010 to 2024 for model calibration and validation, and projections for 2025–2050 aligned with climate change scenarios and the regional Master Plan for 2021–2030 with a vision to 2050.

Results indicate pronounced seasonal variability in water demand, critical feedback between temperature and domestic water use, and interactions between rainfall and water use that influence the risks of salinity intrusion at downstream water supply intakes. In addition, a positive relationship is identified between tourism growth and water demand, particularly during dry seasons, which exacerbates water stress.

By explicitly integrating salinity and tourism dynamics, this study pioneers a WEF nexus-based modelling approach for the VGTBRB. The findings provide policy-relevant insights to enhance water system resilience under climate and socio-economic change, support progress towards the Sustainable Development Goals, and inform integrated resource governance in a tourism-dependent, salinity-affected river basin.

How to cite: Hoang, L., Shamseldin, A. Y., Henning, T. F. P., Latu, K., Zorn, C., and Dong, S.: Assessing the Water-Energy-Food Nexus under Climate and Socio-economic Change in Vu Gia – Thu Bon River Basin, Vietnam, EGU General Assembly 2026, Vienna, Austria, 3–8 May 2026, EGU26-15614, https://doi.org/10.5194/egusphere-egu26-15614, 2026.

EGU26-16119 | ECS | Posters virtual | VPS11

Differentiable, Learnable MILC: Balancing Predictive Skill and Physical Interpretability 

Vidushi Sharma, Siddik Barbhuiya, and Vivek Gupta

Deep learning models, particularly LSTMs, have transformed large-sample hydrology by achieving high streamflow predictive performance, yet they remain largely black-box approaches with limited physical interpretability and no explicit representation of multiphysical hydrological processes. Differentiable, learnable process-based models (or δ-models) overcome these limitations by embedding neural networks within differentiable physics frameworks. While existing benchmarks like HBV-δ have proven this concept across 671 US basins, they rely on conceptual foundations (e.g., empirical beta-functions) that approximate, rather than resolve, underlying soil physics. This study introduces MILC-δ (Modular Differentiable Physic-Informed Learning), designed to bridge this gap. The MILC model utilizes continuous soil water retention curves and physically derived drainage laws, which can aid in more accurate hydrological flux simulation. Thus, we developed a MILC-δ - a hydrologic model embedded with neural networks and trained in a differentiable programming framework. Consequently, MILC-δ is anticipated to match or exceed HBV-δ by leveraging neural networks to map static catchment attributes directly to physically measurable properties (e.g., pore size distribution, hydraulic conductivity) rather than abstract calibration parameters. Initial testing of the developed model shows that the model performs at par in some basins and better than HBV-δ in other basins. This approach gives LSTM-level accuracy and generalizability as well as the clear physical story stakeholders actually need to explain the decline in baseflow, threats to the groundwater recharge, etc.

How to cite: Sharma, V., Barbhuiya, S., and Gupta, V.: Differentiable, Learnable MILC: Balancing Predictive Skill and Physical Interpretability, EGU General Assembly 2026, Vienna, Austria, 3–8 May 2026, EGU26-16119, https://doi.org/10.5194/egusphere-egu26-16119, 2026.

EGU26-16207 | ECS | Posters virtual | VPS11

Data-Driven LSTM Architectures for Reservoir Inflow Forecasting 

Devesh Mani and Vimal Mishra

Accurate forecasting of reservoir inflow is crucial for managing water resources, maintaining a balance between water supply and demand, preventing floods, supporting hydropower production, and planning irrigation. India, ranking third globally, with more than 5,000 dams, faces challenges in reservoir operations due to hydrological variability caused by the monsoon. While ensuring demand, supply, and flood security requires high water levels, the reservoir also needs to maintain a certain amount of free storage to accommodate high inflows. While Long-Short Term Memory (LSTM) models have been widely used for inflow forecasting, traditional LSTM models often limit their ability to capture sudden hydrological extremes and accurately represent peak timings. Therefore, a comparative evaluation of various advanced LSTM variants is necessary to identify architectures that are more reliable for modelling nonlinear inflow dynamics. Our study introduces a specialised type of recurrent neural network, specifically the LSTM framework, for forecasting daily reservoir inflow. Our methodology uses a structured feature engineering strategy that integrates hydrometeorological forcings, hydrological state variables, and outputs from the CaMa-Flood hydrodynamics model. A permutation-based feature importance analysis, in terms of the increase in mean absolute error, highlights that antecedent precipitation and lagged upstream reservoir outflow are the main influencing factors for the inflow forecast within a multivariate sequence-to-one LSTM framework. Overall, this framework provides a strong, scalable, and practical solution for inflow forecasting. By supporting timely operational decisions for water release, flood preparedness and storage optimisation, the framework serves as an effective tool for managing reservoirs.

How to cite: Mani, D. and Mishra, V.: Data-Driven LSTM Architectures for Reservoir Inflow Forecasting, EGU General Assembly 2026, Vienna, Austria, 3–8 May 2026, EGU26-16207, https://doi.org/10.5194/egusphere-egu26-16207, 2026.

EGU26-16490 | ECS | Posters virtual | VPS11

Estimation of Ecological Flow for Major Indian River Basins under Changing Climate 

Sahil Sahil and Vimal Mishra

Streamflow provides critical support for the biodiversity of aquatic and riparian ecosystems, sediment transport, and nutrient cycling. Therefore, a minimum streamflow in rivers is crucial for sustaining the proper functioning of aquatic habitats. However, lean or low-flow regimes have been significantly altered by various human activities, such as dam construction, flow diversion for irrigation purposes, industrialisation, and urbanisation. Moreover, changing climate is causing erratic monsoons, increased temperatures, and more prolonged droughts, thereby maintaining ecological flow has become increasingly challenging and urgent to preserve the riverine ecosystems. Our aim is to develop a robust, data-driven framework for estimating environmental flows (E-flows) across 55 stations in major Indian river basins. The primary objective is to assess the quantity and timing of streamflow required to sustain the various river ecosystems, utilising hydrological indicators and long-term datasets, such as temperature and precipitation from the Indian Meteorological Department (IMD). Changes in streamflow characteristics are assessed by comparing observed and machine learning-based naturalised flows, enabling the isolation of reservoir-induced impacts on the streamflow regime, magnitude, duration, and seasonal timing. The study hypothesises that, with the use of observed streamflow data, naturalised streamflow reconstruction and a multi-indicator hydrologic approach, integrating Indicators of Hydrological Alteration (IHA), the Range of Variability Approach (RVA), and Flow Duration Curve (FDC) analysis, can provide reliable E-Flow estimates at regional and national scales. By comparing indicator-based benchmarks derived from observed and naturalised streamflow, the stations are classified according to the degree of hydrologic alteration, thereby supporting scientifically informed river management and policy decisions. 

How to cite: Sahil, S. and Mishra, V.: Estimation of Ecological Flow for Major Indian River Basins under Changing Climate, EGU General Assembly 2026, Vienna, Austria, 3–8 May 2026, EGU26-16490, https://doi.org/10.5194/egusphere-egu26-16490, 2026.

EGU26-17089 | Posters virtual | VPS11

Remote Sensing–Based Monitoring of Lake Sarikamish Water Level Dynamics 

Gulomjon Umirzakov, Salauat Kalabaev, Akmal Gafurov, and Daniyar Turgunov

Lakes and associated hydrological processes are sensitive indicators of environmental change and climate variability. Variations in lake water level and storage reflect the combined effects of atmospheric forcing (precipitation, evaporation, and temperature regime) and anthropogenic interventions, including irrigation, drainage, and hydraulic infrastructure development. Continuous monitoring of lake level dynamics is therefore essential for water resources management, evaluation of regional climate impacts, and assessment of environmental risks in arid and semi-arid regions.

Central Asia has experienced pronounced hydrological transformations over recent decades as a result of climate warming, altered precipitation patterns, and intensified human water use. These changes are manifested in contrasting lake responses, ranging from the dramatic desiccation of the Aral Sea to the expansion of endorheic water bodies receiving anthropogenic inflows. Lake Sarikamish, one of the largest lowland lakes in the region, is located along the Uzbekistan–Turkmenistan border near the escarpment of the Ustyurt Plateau and represents a key example of such coupled natural–human system dynamics.

This study investigates water level variability of Lake Sarikamish over the period 2001–2024 using satellite altimetry observations from the Global Reservoirs and Lakes Monitor (G-REALM) database. The dataset, provided at a 10-day temporal resolution in NetCDF format, was processed to construct a continuous long-term time series. Short data gaps were filled using linear interpolation, a method previously shown to yield robust performance for altimetric lake level records. Descriptive statistics and trend analyses were applied to quantify intra-annual variability, interannual fluctuations, and long-term tendencies.

The minimum lake level during the observation period was recorded in February 2002 (4.23 m), while the maximum level occurred in April 2018 (8.84 m). The time series exhibits substantial interannual variability, with a standard deviation of 0.91 m. Four distinct phases of lake level evolution were identified: (i) a rapid increase during 2001–2007 at a rate of +0.56 m yr⁻¹, (ii) a short-term decline in 2008–2009 (−0.60 m yr⁻¹), (iii) a prolonged period of moderate increase during 2010–2020 (+0.15 m yr⁻¹), and (iv) a renewed decrease during 2021–2024 (−0.36 m yr⁻¹). Despite the recent downward trend, the overall period is characterized by a net positive trend of +0.16 m yr⁻¹.

The observed post-2020 decline suggests an increasing influence of regional climate change, particularly rising air temperatures and reduced effective precipitation. Continued water level lowering may have negative consequences for local ecosystems, biodiversity, and environmental stability. The results highlight the value of satellite altimetry for long-term lake monitoring and emphasize the need for integrated assessments of climatic and anthropogenic drivers of lake hydrological change in Central Asia.

How to cite: Umirzakov, G., Kalabaev, S., Gafurov, A., and Turgunov, D.: Remote Sensing–Based Monitoring of Lake Sarikamish Water Level Dynamics, EGU General Assembly 2026, Vienna, Austria, 3–8 May 2026, EGU26-17089, https://doi.org/10.5194/egusphere-egu26-17089, 2026.

EGU26-18311 | ECS | Posters virtual | VPS11

 Laboratory testing and in-situ monitoring of the hydrological response of a resin gravel permeable pavement and a bioswale 

Martina Ferro, Enrico Chinchella, Arianna Cauteruccio, and Luca G. Lanza

The present study investigates the hydrological performance of two Nature Based Solutions (NBS) realised within the urban requalification project of the former military area “Caserma Gavoglio” (now public park), in one of the most heavily urbanized districts of the city of Genoa (Italy). The rapid expansion of urbanization has led to an increase in impervious surfaces and a consequent increase in runoff generation, flood volume and flood peak. Since the required expansion of the stormwater drainage capacity is neither economically nor environmentally sustainable, innovative stormwater management strategies are required. In this context, NBSs represent effective solutions to mitigate runoff generation and peak flows and restore natural infiltration processes.

A resin gravel permeable pavement (PP) was used for the paving of about 40% of the park surfaces while a bioswale was realised alongside the sport field to manage stormwater excess.  

The PP was preliminarily tested in the laboratory by monitoring the outflow from a standardized test bed under various rainfall input and slope conditions. The results of the tests were interpreted mathematically using the analogy of the step response function of first- and second-order dynamic systems. This allows to transfer the laboratory results for comparison with field conditions, even if these were not precisely reproduced in the laboratory tests.

Both NBSs were monitored in the field with the objective to measure the outflow rate, representing the inflow to the urban drainage system, and to compare it with the corresponding rainfall input.

Two hydrometric measurement stations and one rain gauge station were installed. Since the stormwater drainage system was already in place, water stage probes were housed inside existing manholes equipped with suitable “V-shaped” weirs. Due to non-standard operational conditions, the measurement stations were preliminarily tested in the laboratory to verify their accuracy prior to field installation.

From the monitored rainfall events, direct comparisons between the measured precipitation and the outflow hydrographs were performed. These analyses enabled the quantification of the retention and detention effects due to the NBSs and their improvement relative to typical impervious paving solutions. The following performance indicators were derived for each significant precipitation event that exceeded the retention capacity of the NBS: (i) the outflow coefficient, defined as the ratio between total outflow and rainfall volumes, (ii) the peak reduction coefficient, i.e. the ratio between peak discharge and peak rainfall intensity and (iii) the system response delay, i.e. the time lag between the centre of mass of the flow hydrograph and that of the rainfall.

Acknowledgements

This work was conducted in the framework of the Urban Nature LABs (UNALAB) project, under the “HORIZON 2020” programme, Smart and sustainable Cities-SCC-02-2016-2017, as a collaboration between the University of Genova (DICCA) and the Municipality of Genova (project partner).

How to cite: Ferro, M., Chinchella, E., Cauteruccio, A., and Lanza, L. G.:  Laboratory testing and in-situ monitoring of the hydrological response of a resin gravel permeable pavement and a bioswale, EGU General Assembly 2026, Vienna, Austria, 3–8 May 2026, EGU26-18311, https://doi.org/10.5194/egusphere-egu26-18311, 2026.

EGU26-18956 | Posters virtual | VPS11

Assessing Groundwater Storage Changes in Data-Scarce Basins of Afghanistan: A Machine-Learning Based Downscaling of GRACE(-FO) Data 

Abdul Haseeb Azizi, Fazlullah Akhtar, Christian Borgemeister, and Bernhard Tischbein

Climate change, rising water demand, and ecosystem stress are intensifying the reliance on groundwater while limiting the capacity of many basins to effectively monitor and manage subsurface water resources. In data-scarce and conflict-affected regions where monitoring networks are sparse, decision-makers increasingly require reliable, high-resolution information to support drought preparedness, climate adaptation, and sustainable groundwater governance. The present study proposes an evidence-based machine-learning framework for the purpose of enhancing the monitoring of groundwater storage anomaly (GWSA) through the process of downscaling GRACE and GRACE-FO observations from ~3° to 0.1°. The reconstruction of monthly GRACE/GRACE-FO gaps was performed using a Seasonal-Trend Decomposition based on Loess (STL), and a Random Forest model was trained with hydroclimatic and land-surface predictors, including soil moisture, snow water equivalent, evapotranspiration, precipitation, land-surface temperature, and the normalized difference vegetation index (NDVI). The performance of the model was evaluated by comparing the model's results with the existing in-situ groundwater-level observations in the Kabul River Basin. The results indicate that satellite-inferred groundwater losses in Afghanistan are persistent, with a rate of −0.71 cm yr-1, ranging from basin-scale depletion of −0.77 cm yr-1 in the Helmand River Basin to −0.40 cm yr-1 in the Northern River Basin. Recent conditions indicate intensified depletion during 2018–2022, with year-sum GWSA declines reaching ~145 cm in the Harirod–Murghab River Basin, while the Northern River Basin shows comparatively lower losses (~80 cm). The 0.1° downscaled product improves agreement with observations (root mean square error (RMSE) reductions up to 77.8%) and reveals spatially heterogeneous hotspots that are not detectable at coarse GRACE resolution. Generally, the proposed framework translates coarse satellite gravimetry into actionable, basin-relevant information for climate-resilient groundwater management, while underscoring the necessity for uncertainty-aware, multi-source monitoring under increasing hydroclimatic extremes. The approach enables the early detection of emerging depletion hotspots, thereby supporting proactive planning for future water security. This includes targeted demand management, drought response, and adaptation investments in groundwater-dependent regions.

How to cite: Azizi, A. H., Akhtar, F., Borgemeister, C., and Tischbein, B.: Assessing Groundwater Storage Changes in Data-Scarce Basins of Afghanistan: A Machine-Learning Based Downscaling of GRACE(-FO) Data, EGU General Assembly 2026, Vienna, Austria, 3–8 May 2026, EGU26-18956, https://doi.org/10.5194/egusphere-egu26-18956, 2026.

EGU26-905 | Posters virtual | VPS12

Reconstructing rupture dynamics of historical Alpine–Marlborough Fault earthquakes, Aotearoa–New Zealand 

Aisling OKane, Jamie Howarth, Sean Fitzsimons, Adelaine Moody, and Kate Clark

Forecasting seismic hazard on complex fault systems remains a global challenge, particularly where ruptures can cascade across structural transitions. Aotearoa–New Zealand’s (A–NZ) central transition zone exemplifies this, where the Alpine Fault (AF) and Marlborough Fault System (MFS) connect the Puysegur and Hikurangi subduction zones and pose a major seismic risk to A–NZ communities. The Alpine Fault is late in its interseismic cycle, with a 75% probability of rupture on its central segment within the next 50 years, and a high likelihood of this cascading into a Mw>8 multi-fault rupture onto the MFS. Understanding the behaviour of past earthquake sequences in this region is therefore a national priority to better estimate the extent and dynamics of future shaking. Instrumental records only span a fraction of an earthquake cycle, leaving critical gaps in recurrence patterns and rupture behaviour, which paleo-seismic archives can help to resolve.

We address this gap by integrating lake-sediment paleo-shaking records with calibrated ground-motion modelling and empirical source inversion. Using South Island lakes as binary seismometers, we reconstruct rupture scenarios for historical earthquakes in the central A–NZ transition zone. For each event, we define the probable fault planes and forward-model potential peak ground velocities at each lake site using a suite of ground-motion models that have been extensively tested and adopted in the New Zealand National Seismic Hazard Model. These modelled ground motions are then compared with age-dated mass-transport deposits, which record earthquake-induced shaking and allow calibration of the sequence and timing of events at each site. Finally, a source-inversion technique is used to identify rupture extents and magnitudes that satisfy both rupture-scaling constraints and the binary shaking evidence preserved in the sedimentary record.

In this presentation, we will demonstrate how our integrated approach constrains the magnitudes, rupture locations, and recurrence histories of eight historical earthquakes in central Aotearoa–New Zealand at unprecedented spatial and temporal resolution. The methodology reduces epistemic uncertainty associated with conventional intensity-based methods and is transferable to other complex fault systems, including subduction zones. Crucially, our research provides essential empirical inputs for time-dependent seismic hazard models in Aotearoa–New Zealand.

How to cite: OKane, A., Howarth, J., Fitzsimons, S., Moody, A., and Clark, K.: Reconstructing rupture dynamics of historical Alpine–Marlborough Fault earthquakes, Aotearoa–New Zealand, EGU General Assembly 2026, Vienna, Austria, 3–8 May 2026, EGU26-905, https://doi.org/10.5194/egusphere-egu26-905, 2026.

A remote sensing index is often used to identify meteorological and agricultural droughts. Google Earth Engine analyzes CHIRPS data from 2015 to 2024 and Landsat-8/Sentinel-2 data from 2020 to 2024. The Vegetation Condition Index (VCI), Temperature Condition Index (TCI), composite Vegetation Health Index (VHI), and Standardized Precipitation Index (SPI) were calculated for four seasons using NDVI, EVI, LST, and CHIRPS precipitation data to explain specific spatiotemporal trends. Meteorological and agricultural droughts include precipitation deficits and vegetation stress. From the study, pre-monsoon analysis reveals significant intra-seasonal correlations between VCI and VHI (0.84) and TCI and VHI (0.75), indicating that moisture reserves and thermal stress influence vegetation health during arid periods. The VCI-VHI correlation (0.91) predominates during the monsoon season, indicating plant growth amidst substantial precipitation. As the season nears peak aridity, the correlations between post-monsoon and winter TCI-VHI increase (0.81 and 0.83), signifying thermal stress. A weak correlation (≤ 0.50) between SPI and vegetation indices across the seasons indicates that current precipitation does not succeed in reliably predicting vegetation stress, since vegetation depends on accumulated soil moisture rather than instantaneous rainfall. Vegetation indices exhibit substantial temporal persistence: Pre-monsoon VCI conditions are strong predictors of winter VCI (0.98), VHI forecasts winter VHI (0.92), and TCI predicts winter TCI (0.87), thereby enabling nine-month drought forecasting. The findings demonstrate that vegetation indices serve as drought indicators for seasonal water resource planning and agricultural vulnerability assessment in monsoon-affected nations.

How to cite: Thounaojam, L. and Oinam, B.: Spatio-temporal dynamics of meteorological and agricultural droughts: A multi-seasonal analysis of Vegetation Health and Climate Indices Using Google Earth Engine, EGU General Assembly 2026, Vienna, Austria, 3–8 May 2026, EGU26-2205, https://doi.org/10.5194/egusphere-egu26-2205, 2026.

EGU26-2262 | ECS | Posters virtual | VPS12

Machine learning based prediction of long-term drought persistence over the Arabian Peninsula 

Fayma Mushtaq and Luai Muhammad Alhems

The Arabian Peninsula is among the most water-stressed regions globally, where limited precipitation, high evapotranspiration and rapid socio-economic development exacerbate vulnerability to drought. Emerging evidence indicates a significant intensification of drought conditions in recent decades, driven by climate variability and long-term warming trends posing serious challenges to water security, ecosystem stability and socio-economic resilience. Therefore, understanding historical drought dynamics, together with reliable drought prediction, is essential for strengthening drought monitoring and mitigation strategies in arid environments and for reducing drought-related risks. However, accurate drought prediction at fine resolution scale remains challenging due to the sparse distribution of meteorological stations. This study investigates the performance of the Standardized Precipitation Index (SPI) and the Standardized Precipitation Evapotranspiration Index (SPEI) at 3-, 6- and 12-month timescales using precipitation data from the Climate Hazards Group InfraRed Precipitation with Station data (CHIRPS) and potential evapotranspiration derived from the TerraClimate dataset, respectively, for pixel-level drought assessment over the period 1992-2024. The historical dynamics were studied using Mann-Kendall trend, Sen’s slope and hotspot analysis. Random Forest (RF) was employed to assess its applicability for drought prediction in arid environments using satellite data, owing to its widespread adoption in global drought-prediction studies. The analysis demonstrates that the RF model exhibits high predictive performance under the studied conditions, with robust performance for SPEI-6 (R² = 0.92, RMSE = 0.12, NSE = 0.92) and satisfactory results for SPEI-12 (R² = 0.77, RMSE = 0.22, NSE = 0.77). These findings confirm enhanced predictability of seasonal to long-term drought variability across the Arabian Peninsula using a satellite-driven RF framework. The results showed the dominance of antecedent SPEI variables (>90%) indicating that cumulative moisture deficits and rising atmospheric evaporative demand primarily govern seasonal to long-term drought evolution over the Arabian Peninsula. In contrast, the consistently low contribution of SPI based indices (<3%) underscores the limited standalone role of precipitation variability in sustaining drought conditions in this arid region. Consistent with these predictive results, spatial trend analysis reveals pronounced heterogeneity in drought evolution across the Arabian Peninsula, with SPI exhibiting mixed and weak precipitation-driven signals, whereas SPEI shows widespread and statistically significant drying, particularly at 6- and 12-month timescales. This divergence further confirms that increasing evaporative demand and regional warming are the primary drivers of long-term drought intensification, reinforcing the dominant role of evapotranspiration processes identified by the machine-learning models. Therefore, the integration of satellite-derived pixel-level datasets with the RF model provides an effective framework for drought prediction across the Arabian Peninsula, offering valuable insights for water resource managers and policymakers to support the development of robust early warning systems and targeted mitigation strategies.

How to cite: Mushtaq, F. and Alhems, L. M.: Machine learning based prediction of long-term drought persistence over the Arabian Peninsula, EGU General Assembly 2026, Vienna, Austria, 3–8 May 2026, EGU26-2262, https://doi.org/10.5194/egusphere-egu26-2262, 2026.

EGU26-3065 | Posters virtual | VPS12

Experimentation with the use of EGMS and IRIDE satellite data 

Andrea Motti and Norman Natali

The objectives of the experiment were the following:

  • Evaluation of continuous ground motion from satellite data (European Ground Motion Service for the period 2019-2023 and IRIDE for 2024);
  • Analysis of different types of landslides (active landslides, dormant landslides, landslide-prone areas, subsidence);
  • Identification of elements for the Emergency Limit Condition (CLE) analysis near areas affected by specific ground motions derived from satellite data in the period 2019-2024
  • Identification of buildings in the municipality of Perugia near areas affected by specific ground motions derived from satellite data in the period 2019-2024
  • Submission of the results to all regional offices that authorize, evaluate, design, or schedule interventions on the territory and to the regional civil protection agency.

QGIS version 3.42 software was used for the experiment.

The following databases were imported into QGIS:

  • European Ground Motion Service satellite data.
  • IRIDE satellite data – Cross Monitoring of Ground Motion and "Hot Spots" of Cover Change.
  • PAI geomorphological landslide hazard maps.
  • Local Seismic Hazard Map of the Umbria Region.
  • Umbria Region Emergency Limit Condition Analysis (CLE) maps.
  • Geological Map of the Umbria Region.
  • Building database of the Umbria Region's land registry system for the Municipality of Perugia.
  • Administrative Boundaries of the Umbria Region and base maps such as the Regional Technical Map and Google Satellite.

Spatial analyses were performed using the GIS on the collected data to homogenize and select specific information useful for subsequent processing.

Multiple analyses werw performed for 2 specific case studies.

All objectives were achieved: assessment of continuous ground motion from satellite data (two different databases: IRIDE for 2024 and EGMS 2019-2023); subsequent analysis using different types of landslides (active landslides, dormant landslides, landslide-prone areas, subsidence); subsequent assessment using the CLE (Emergency Limit Condition) elements; subsequent assessment using buildings in the Municipality of Perugia.

How to cite: Motti, A. and Natali, N.: Experimentation with the use of EGMS and IRIDE satellite data, EGU General Assembly 2026, Vienna, Austria, 3–8 May 2026, EGU26-3065, https://doi.org/10.5194/egusphere-egu26-3065, 2026.

EGU26-4745 | ECS | Posters virtual | VPS12

A New Statistical Method to distinguish Different Earthquake Cluster Types 

Yuxuan Fan and Feng Hu

Earthquake clusters can be broadly classified into two types: swarm-like sequences and mainshock–aftershock sequences. The spatial organization of the two types provides important insights into underlying tectonic processes and fluid migration in earthquake source regions. In this study, we apply the nearest-neighbor distance approach on the Southern California focal-mechanism earthquake catalog (the CNN_SoCal catalog) and introduce two new statistical indicators-skewness and kurtosis to distinguish between these two classes of earthquake clusters. We find that the square root of kurtosis and skewness provide effective and interpretable indicators for clusters classification. In the kurtosis–skewness diagram, swarm-like sequences and mainshock–aftershock sequences tend to occupy distinct regions, enabling a practical distinction between the two sequence types without relying on subjective inspection of individual clusters. Overall, the proposed approach offers an efficient way to differentiate swarm-like and mainshock–aftershock seismicity in large catalogs. The method is computationally light, easy to implement, and suitable for rapid screening of earthquake sequence types in high-resolution regional datasets.

How to cite: Fan, Y. and Hu, F.: A New Statistical Method to distinguish Different Earthquake Cluster Types, EGU General Assembly 2026, Vienna, Austria, 3–8 May 2026, EGU26-4745, https://doi.org/10.5194/egusphere-egu26-4745, 2026.

EGU26-6783 | Posters virtual | VPS12

AI-Powered Digital Twin Framework for Windstorm Emergency Management in Interconnected Critical Infrastructures 

Balaji Venkateswaran Venkatasubramanian, Christos Laoudias, and Mathaios Panteli

Extreme windstorms pose significant risks to interconnected critical infrastructures such as power, transportation, and telecommunication systems. Wind-induced damage to physical assets, including overhead lines and roadside vegetation, can trigger cascading failures across interdependent networks, leading to widespread service disruptions and societal impacts. Anticipating these cascading effects under uncertain and evolving windstorm conditions remains a major challenge for emergency and crisis management.

An AI-powered Digital Twin (DT) framework for windstorm emergency management is introduced in this presentation, focusing on interconnected critical infrastructures exposed to extreme wind hazards. The framework integrates physics-based windstorm simulation with cascading impact analysis within a unified digital environment, enabling systematic assessment of the interconnected infrastructure performance across a wide range of plausible windstorm scenarios. Rather than relying solely on historical events, physically informed models are used to generate synthetic windstorm scenarios that support preparedness planning and stress-testing under future extreme conditions.

Building on ensembles of simulated windstorm scenarios, the framework can incorporate Generative AI (GenAI) techniques as a post-simulation analytical layer for vulnerability and risk analysis. GenAI operates on the outputs of physics-based simulations, learning asset-level and system-level operational behaviors and vulnerability patterns from simulated impacts, rather than replacing the underlying hazard or infrastructure models. In this role, GenAI captures complex and nonlinear relationships between wind event characteristics and cascading infrastructure failures, enabling efficient synthesis and generalization across large scenario ensembles. This hybrid physics–AI approach supports rapid and accurate identification of vulnerable assets across interconnected infrastructures, spatial hotspots of risk, and conditions that may lead to cascading disruptions under future windstorm scenarios, while preserving the physical consistency of the Digital Twin.

The applicability of the proposed framework is demonstrated through representative case studies involving national-scale interconnected power, telecommunication, and transportation infrastructures in Cyprus, serving as an example implementation. The results illustrate how the AI-powered Digital Twin can support emergency and crisis management at a national level by enabling stress-testing of infrastructure systems, identification of highly vulnerable and critical assets in the Cyprus interconnected infrastructure, improving situational awareness on critical wind-induced cascading risks, and informing response and recovery strategies under severe windstorm conditions.

Overall, this work highlights the potential of hybrid physics-based and AI-enhanced Digital Twins as decision-support tools for windstorm emergency management in interconnected critical infrastructures, providing a flexible and extensible foundation for improving resilience to climate-driven hazards.

How to cite: Venkatasubramanian, B. V., Laoudias, C., and Panteli, M.: AI-Powered Digital Twin Framework for Windstorm Emergency Management in Interconnected Critical Infrastructures, EGU General Assembly 2026, Vienna, Austria, 3–8 May 2026, EGU26-6783, https://doi.org/10.5194/egusphere-egu26-6783, 2026.

EGU26-7810 | Posters virtual | VPS12

Coupling Hydrodynamic Modeling with Machine Learning for Flood Risk Assessment in the Himalayan River Basin 

Sunil Duwal, Prachand Man Pradhan, Dedi Liu, and Yogesh Bhattarai

The Himalayan river Basins frequently experience devastating floods. These river basins require accurate predictions and timely warnings to support effective flood risk management. While accurate prediction is crucial for saving lives, disaster managers often face a difficult trade-off between computational cost and warning lead time. High-fidelity physics-based models are precise but are computationally expensive for rapid decision-making, whereas low-fidelity geo-spatial models often lack accuracy in data-scarce regions. Our proposal is a framework to improve the flood inundation prediction in the Himalayan basin by combining the reliability of hydrodynamic modeling with the speed of machine learning.

In this study, we developed a 2D HEC-RAS model using a Rain-on-Grid approach to simulate the historical floods. We utilize the developed hydrodynamic model to generate a dataset of flood inundations that captures the basin's flow dynamics. These datasets will serve as the foundation for training advanced machine learning algorithms, including a Random Forest Regressor (RF) and a Convolutional Neural Network (CNN), to identify and predict flood patterns. Our model will integrate critical landscape features, including elevation, slope, land-use characteristics, the Normalized Difference Vegetation Index (NDVI), and satellite-derived rainfall data, to approximate the complex physical processes embedded in the hydrodynamic model. This allows the machine learning approach to achieve comparable predictive accuracy while reducing computational time. Through comprehensive validation against established benchmarks and real-world flood events, our research aims to deliver a scalable, computationally efficient, and highly accurate flood prediction tool. This framework has the potential to transform disaster preparedness and response capabilities in the Himalayan region by enabling timely, data-driven policy planning and proactive risk mitigation strategies.

How to cite: Duwal, S., Pradhan, P. M., Liu, D., and Bhattarai, Y.: Coupling Hydrodynamic Modeling with Machine Learning for Flood Risk Assessment in the Himalayan River Basin, EGU General Assembly 2026, Vienna, Austria, 3–8 May 2026, EGU26-7810, https://doi.org/10.5194/egusphere-egu26-7810, 2026.

EGU26-16372 | ECS | Posters virtual | VPS12

Monitoring Heat Extremes over India Using Earth Observations and Data Driven Approaches 

Alka Remesh Ancy and Subhasis Mitra

Remote sensing enables spatially continuous and timely monitoring of hydro-climatological extremes by capturing key land–atmosphere variables across large regions, including for data-scarce areas. The rising frequency of heat extremes across India in recent decades underscores the need for effective monitoring, especially in data-scarce regions. This study evaluates the potential of monitoring heat extremes over the Indian sub-continent using satellite based observations and data driven approaches. For this, MODIS land surface temperature (LST) along with NDVI, land use/land cover and elevation information is used with traditional machine learning models namely Random Forest (RF) and XGBoost. Subsequently, the performance of the two ML models in estimating maximum temperatures across the Indian subcontinent was evaluated and validated using in situ temperature observations from the Indian Meteorological Department. Heat extremes were identified using both absolute temperature percentile thresholds and Standardized Temperature Index based heat stress categories. The performance of ML models was evaluated using station‑wise categorical verification metrics such as hit rate, false alarm ratio, and critical success index. Results show that the ML models exhibit higher accuracy in predicting mean temperatures compared to extremes, and XGBoost outperforms the RF model with lower RMSE and higher R². The results further reveals that ML model prediction skill exhibits considerable geographic variability across the sub-continent, with reduced performance over mountainous areas. This study demonstrates that integrating satellite-based data with machine learning provides an effective approach for monitoring heat extremes across the Indian subcontinent, particularly in data-scarce environments.

How to cite: Remesh Ancy, A. and Mitra, S.: Monitoring Heat Extremes over India Using Earth Observations and Data Driven Approaches, EGU General Assembly 2026, Vienna, Austria, 3–8 May 2026, EGU26-16372, https://doi.org/10.5194/egusphere-egu26-16372, 2026.

EGU26-16451 | Posters virtual | VPS12

Near-Decadal Land Subsidence Susceptibility and Trends Using Physics-Informed LSTM 

Desmond Kangah and Ahmed Abdalla

Land subsidence poses growing risks to urban infrastructure, water resources, and long-term resilience, requiring assessment frameworks that link present-day observations with planning-relevant forecasts. This study develops an integrated approach for land subsidence susceptibility mapping and trend forecasting over multi-year horizons. The analysis uses SBAS-InSAR deformation time series derived from Sentinel-1 observations from 2017 to 2025 to characterize subsidence patterns across East Baton Rouge Parish, Louisiana. Subsidence susceptibility is modeled using an ensemble machine-learning framework that combines Extra Trees and Random Forest regressors and incorporates geological, topographic, hydrological, land use, infrastructure, and climatic conditioning factors. The susceptibility results highlight the dominant influence of land use, elevation, proximity to faults and rivers, and terrain-hydrology interactions on subsidence patterns. To extend assessment beyond observation periods, a physics-informed long short-term memory (LSTM) ensemble is introduced for forecasting. The model integrates data-driven learning with physically motivated constraints to ensure stable and realistic deformation trajectories. The forecasts preserve observed spatial patterns while exhibiting physically consistent temporal evolution and quantified uncertainty. The results demonstrate that combining InSAR observations with physics-informed deep learning enables robust, planning-scale subsidence assessment and forecasting. The proposed framework is transferable to other urban settings where long-term subsidence poses increasing societal risk.

How to cite: Kangah, D. and Abdalla, A.: Near-Decadal Land Subsidence Susceptibility and Trends Using Physics-Informed LSTM, EGU General Assembly 2026, Vienna, Austria, 3–8 May 2026, EGU26-16451, https://doi.org/10.5194/egusphere-egu26-16451, 2026.

EGU26-17842 | ECS | Posters virtual | VPS12

 Sensitivity of Time-Dependent Earthquake Conditional Probabilities to Catalogue Declustering in the Himalayas  

Brijesh Pratap and Mukat Lal Sharma

Earthquake catalogue declustering is a critical preprocessing step in time-dependent seismicity analyses (Gardner and Knopoff, 1974; Reasenberg, 1985), yet its systematic influence on conditional earthquake probability estimates remains insufficiently quantified, particularly in tectonically complex continental collision zones such as the Himalayas (Bungum et al., 2017). Renewal-based recurrence models typically assume that declustered catalogues isolate tectonically driven mainshock recurrence by removing dependent events. However, recent advances in declustering theory demonstrate that methodological choices, ranging from fixed spatio-temporal windows to adaptive and stochastic approaches, can substantially modify inter-event time statistics and inferred recurrence memory (Zaliapin et al., 2008; Zaliapin & Ben-Zion, 2020; Teng & Baker, 2019). Despite these developments, the implications of declustering-induced variability for time-dependent conditional probabilities remain underexplored in active orogenic belts.

In this study, we explicitly quantify how alternative declustering strategies influence time-dependent recurrence behavior and conditional rupture probabilities across selected Himalayan seismic source zones. Inter-event time series were constructed for moderate-to-large earthquakes (M ≥ 4.0) using both raw (non-declustered) and declustered catalogues derived from regional earthquake compilations. Declustering was performed using commonly applied fixed-window and adaptive approaches to capture epistemic variability associated with catalogue preprocessing. The resulting inter-event times were analyzed within renewal process models, including Brownian Passage Time (BPT), Lognormal, Weibull, and Gamma distributions, to estimate conditional probabilities as functions of elapsed time since the most recent major event.

Results show that declustered catalogues consistently yield smoother initial probability gradients and delayed probability peaks relative to raw catalogues, reflecting reduced short-term temporal clustering in inter-event time distributions. These shifts correspond to systematic changes in inferred renewal memory parameters, with declustering suppressing short-term contagion effects while largely preserving long-term mean recurrence intervals. In the Himalayas, collision-driven aftershock swarms and spatially heterogeneous fault interactions amplify these effects, introducing substantial epistemic uncertainty in early-time conditional probabilities, which can locally exceed factors of two to three depending on the declustering strategy employed. In contrast, long-term probability remains comparatively robust across declustering scenarios, consistent with steady-state tectonic strain accumulation.

These findings identify catalogue declustering as a dominant and often underappreciated source of uncertainty in time-dependent seismic probability modelling, reinforcing recent calls for ensemble-based and transparent pre-processing strategies in probabilistic seismic hazard workflows. This study advances a methodological framework for interpreting renewal-based conditional probabilities in clustered tectonic regimes. The Himalayas emerge as a natural laboratory where combined raw and declustered analyses can yield more resilient probabilistic interpretations.

How to cite: Pratap, B. and Sharma, M. L.:  Sensitivity of Time-Dependent Earthquake Conditional Probabilities to Catalogue Declustering in the Himalayas , EGU General Assembly 2026, Vienna, Austria, 3–8 May 2026, EGU26-17842, https://doi.org/10.5194/egusphere-egu26-17842, 2026.

EGU26-18022 | ECS | Posters virtual | VPS12

Landslide Hazard, Vulnerability, and Risk Analysis (HVRA) Using Machine Learning and AI: A Case Study of the Darma Valley, Kumaun Himalaya, India 

Mohd Shawez, Sandeep Kumar, Vikram Gupta, Parveen Kumar, and Gautam Rawat

Landslides have become one of the most destructive geological hazards in the Himalayan region, exhibiting a significant increase in both occurrence and intensity in recent decades. This increasing trend poses serious threats to human life, infrastructure, and essential public assets, underscoring the need for comprehensive risk evaluation in these highly vulnerable mountainous terrains. The present study offers an extensive assessment of landslide hazard, vulnerability, and associated risk in the Darma Valley of the Kumaun Himalaya, India. Landslide susceptibility was modelled using a Multilayer Perceptron (MLP) neural network, and the model’s predictive performance was validated through ROC–AUC analysis. Vulnerability was quantified by integrating land-use/land-cover categories with their respective economic valuations. Furthermore, rainfall and seismic intensity maps were combined with the susceptibility outputs to derive a detailed landslide hazard map. The results indicate that roads are the most vulnerable elements, followed by settlements and dam infrastructures, largely due to their substantial reconstruction costs and higher exposure levels. The final risk map, produced by integrating hazard and vulnerability layers, reveals that approximately 9% of the study area falls within high to very high risk zones, 22% within moderate risk, 26% within low risk, and 43% within very low risk zones. These findings offer essential guidance for promoting sustainable development and supporting land-use planning that accounts for environmental risks. They also contribute to more informed and effective decision-making aimed at strengthening the resilience of the fragile and sensitive Himalayan landscape.

How to cite: Shawez, M., Kumar, S., Gupta, V., Kumar, P., and Rawat, G.: Landslide Hazard, Vulnerability, and Risk Analysis (HVRA) Using Machine Learning and AI: A Case Study of the Darma Valley, Kumaun Himalaya, India, EGU General Assembly 2026, Vienna, Austria, 3–8 May 2026, EGU26-18022, https://doi.org/10.5194/egusphere-egu26-18022, 2026.

EGU26-18221 | ECS | Posters virtual | VPS12

PS-InSAR based Slope Deformation Monitoring in the Bhagirathi Valley, Uttarakhand Himalaya 

Anand Kumar Gupta, Khayingshing Luirei, Vikram Gupta, and Mohd Shawez

Slow-moving, deep-seated landslides represent a significantly underestimated geologic hazard, incurring huge economic loss and persistent long-term risk to communities annually. Further, they have the potential to evolve into catastrophic events, which necessitates continuous monitoring to better understand their dynamics, minimize potential losses, and implement appropriate mitigation measures. The present study aims at understanding the dynamics of the slow-moving slopes housing villages such as Bhatwari, Raithal, and Barsu in the Bhagirathi Valley, Uttarakhand Himalaya, by means of PS-InSAR techniques. A total of 129 ascending-pass and 114 descending-pass scenes of Sentinel-1, from January-2021 up to March-2025, have been utilized to estimate slope velocities along the radar line-of-sight (LOS) for each pass, using open-source tools such as ISCE and StaMPS.  Further, these LOS velocities were decomposed to obtain vertical (up-down) and horizontal (east-west) velocities. The results reveal that Raithal (elevation ~2150 m), on middle of the slope, is subsiding at ~3 mm/year with an eastward movement of ~5 mm/year. Bhatwari (1650 m), on the lower slope, shows eastward creep at ~4 mm/year and upliftment at ~2 mm/year, suggesting rotational landslide activity. Barsu (2262 m), situated at a slope ~3 km upstream, exhibits eastward movement at ~6 mm/year and subsidence at ~3 mm/year. Field investigations corroborate these findings, revealing features such as scarps, cracks, tilted structures, disrupted roads, and longitudinal and transverse ponds. The persistent creeping suggests the potential for sudden slope failure during heavy rainfall or earthquakes, which may dam the Bhagirathi River, and the impoundment may further trigger cascading downstream hazards. Therefore, there is a need for a comprehensive investigation integrating the PS results with the slope stability analysis that assesses the role of geology, rainfall, and earthquakes. This integration shall assist in estimating the risk posed by the failure and further help in mitigation planning.

How to cite: Gupta, A. K., Luirei, K., Gupta, V., and Shawez, M.: PS-InSAR based Slope Deformation Monitoring in the Bhagirathi Valley, Uttarakhand Himalaya, EGU General Assembly 2026, Vienna, Austria, 3–8 May 2026, EGU26-18221, https://doi.org/10.5194/egusphere-egu26-18221, 2026.

EGU26-19054 | Posters virtual | VPS12

Urban Landslide Monitoring Using PS-InSAR Sentinel-1 Data in Chișinău, Republic of Moldova (2019-2025) 

Ionut Sandric, Igor Nicoara, Cristina Spian, Alexandru Tambur, Viorel Ilinca, Victor Jeleapov, Radu Irimia, Teona Daia-Creinicean, and Nicolas Alexandru

Chișinău, the capital of the Republic of Moldova, faces significant geohazard challenges due to its unique geological setting on loess-covered plateaus dissected by river valleys and ravines. Urban expansion and infrastructure development have intensified landslide susceptibility in this region, threatening residential areas, transportation networks, and critical infrastructure. This study presents a comprehensive analysis of urban landslides in Chișinău using Persistent Scatterer Interferometric Synthetic Aperture Radar (PS-InSAR) technique applied to Sentinel-1 satellite data spanning the last five years (2019-2025).

The PS-InSAR methodology provides millimeter-level precision in detecting and monitoring ground deformation over time, making it particularly suitable for identifying slow-moving landslides and ground subsidence in urban environments. We processed ascending and descending Sentinel-1 SAR imagery to generate time-series deformation maps and identify persistent scatterers across the Chișinău metropolitan area. The analysis revealed multiple zones of significant ground displacement, with deformation rates ranging from -15 to +25 mm/year, concentrated primarily in areas with steep terrain, proximity to water courses, and urban development on historically unstable slopes.

The susceptibility map derived from our analysis indicates high-risk zones in the northern and western sectors of Chișinău, particularly around suburb localities Vatra, Ghidighici, and Durlești, where loesslike deposits on valley slopes are subjected to both natural erosion processes and anthropogenic pressures. The southeastern areas near locality Bubuieci also show elevated landslide susceptibility, correlating with urban expansion into previously undeveloped terrain. Integration of PS-InSAR results with geological maps, digital elevation models, and land-use data enabled the development of a comprehensive landslide susceptibility assessment framework.

Key findings reveal that ground deformation patterns in Chișinău exhibit strong seasonal variations, with accelerated movement during spring months corresponding to snowmelt and precipitation events. Urban infrastructure, including roads, buildings, and utilities, located within identified high-risk zones, shows structural damage consistent with slow-moving landslide activity. The study identifies critical infrastructure corridors, including major transportation routes (E583, E581) traversing the study area, that require enhanced monitoring and mitigation measures.

Acknowledgements: This work was supported by a grant of the Ministry of Research, Innovation and Digitization, CNCS – UEFISCDI, project number 40PCBROMD within PNCDI IV.

How to cite: Sandric, I., Nicoara, I., Spian, C., Tambur, A., Ilinca, V., Jeleapov, V., Irimia, R., Daia-Creinicean, T., and Alexandru, N.: Urban Landslide Monitoring Using PS-InSAR Sentinel-1 Data in Chișinău, Republic of Moldova (2019-2025), EGU General Assembly 2026, Vienna, Austria, 3–8 May 2026, EGU26-19054, https://doi.org/10.5194/egusphere-egu26-19054, 2026.

EGU26-643 | ECS | Posters virtual | VPS13

Global Synchronization of Compound Drought and Hot Extremes 

Femin C Varghese, Sakila Saminathan, and Subhasis Mitra

Compound drought–heatwave events (CDHEs) are becoming more frequent across several regions at the same time, heightening global climate risks, yet the processes that lead to their synchronized emergence remain poorly understood. Further, to assess how the governing drivers of synchrony have evolved, we employ statistical approaches to quantify the relative contributions of climatic oscillations and anthropogenic warming to CDHE occurrences. In this study, CDHEs are detected using the Blended Dry and Hot Index (BDHI), and their co-occurrence patterns are analyzed through a global complex-network approach that identifies statistically significant teleconnections. Complex network analysis reveals persistent synchronization hubs in the Amazon, West Africa, the Mediterranean, Southeast Asia, and northern Eurasia, highlighting regions where hot–dry extremes tend to cluster in time. Results also indicate that, although ENSO has historically played a major role in widespread CDHE clusters, its influence has weakened considerably in recent decades.  In contrast, anthropogenic warming exhibits a consistently increasing and statistically significant effect, elevating the baseline probability of CDHEs even during weak or neutral ENSO conditions. Overall, our findings demonstrate a climate-system shift toward warming-dominated synchronization dynamics, in which background warming increasingly overrides natural variability. This transition heightens the risks of simultaneous climate shocks across continents, with major implications for disaster preparedness and global food–water security.

How to cite: Varghese, F. C., Saminathan, S., and Mitra, S.: Global Synchronization of Compound Drought and Hot Extremes, EGU General Assembly 2026, Vienna, Austria, 3–8 May 2026, EGU26-643, https://doi.org/10.5194/egusphere-egu26-643, 2026.

EGU26-1600 | ECS | Posters virtual | VPS13

Nationwide Multi-Scenario GLOF Hazard Mapping in Nepal Using Remote Sensing and Hydrodynamic Modelling 

Susmita Saha, Hrishikesh Singh, and Mohit Prakash Mohanty

Rapid glacier retreat in the Nepal Himalaya has accelerated the formation and expansion of glacial lakes, increasing the likelihood of glacial lake outburst floods (GLOFs) with potentially severe downstream consequences. Existing GLOF studies in Nepal are largely site-specific and lack national-scale consistency, limiting their utility for systematic hazard planning. Here, we present a comprehensive, multi-scenario GLOF hazard assessment for Nepal based on three decades of satellite observations (1990–2023) and large-scale hydrodynamic modelling. Using multi-temporal remote sensing, we mapped 1,232 glacial lakes, including 265 newly formed lakes, and estimated lake volumes and peak discharges using established empirical relationships. Downstream flood propagation was simulated using the LISFLOOD-FP hydrodynamic model, enabling consistent, high-resolution inundation mapping across the country. To examine plausible future conditions under continued glacier retreat, we implemented scenario-based lake-volume increases of 10–50%, representing optimistic, intermediate, and pessimistic states. Results indicate a ~26.9% increase in total glacial lake area since 1990, with the most pronounced expansion in the Koshi and Karnali provinces. Modelled inundation extents and flood depths, particularly exceeding 3.5 m, increase substantially under higher-volume scenarios. Koshi and Karnali consistently emerge as the most exposed regions, with heightened impacts on settlements, hydropower infrastructure, and transport networks. The resulting national-scale GLOF hazard atlas provides a coherent framework for visualising present and future flood hazards and offers a practical basis for climate adaptation planning and disaster risk reduction in high-mountain regions.

How to cite: Saha, S., Singh, H., and Mohanty, M. P.: Nationwide Multi-Scenario GLOF Hazard Mapping in Nepal Using Remote Sensing and Hydrodynamic Modelling, EGU General Assembly 2026, Vienna, Austria, 3–8 May 2026, EGU26-1600, https://doi.org/10.5194/egusphere-egu26-1600, 2026.

EGU26-7909 | ECS | Posters virtual | VPS13

A Framework for Fire Risk Assessment in Heritage Cities through Multi-Stakeholder Data Integration 

Sabin Ghimire, Sohan Dangol, Sumit Khatri, Sunil Duwal, and Yogesh Bhattarai

Urban fire risk in heritage cities threatens lives, livelihoods, and irreplaceable historical monuments. Nepal's heritage cities, rich in cultural landmarks, face acute vulnerability due to dense settlement patterns driven by uncontrolled urbanization. Fragmented data availability prevents stakeholders from implementing effective fire risk mitigation measures at the community level, which intensifies the existing vulnerabilities. In this study, we address this challenge by developing comprehensive data through collaborative public-private partnerships involving multiple stakeholder experts. We propose scalable interventions designed to reduce fire risk while strengthening community resilience in ways that align with heritage preservation objectives. This integrated approach ensures that safety measures protect both people and the cultural assets that define these historic urban centers.

Our study area is Bhaktapur Municipality, a UNESCO World Heritage site rich with traditional wooden architecture. Our approach combines municipal planning data, private building inventories, community knowledge, and emergency response databases for fire hazards. We integrate Analytical Hierarchy Process (AHP) with GIS technology across three domains: hazard factors, vulnerability indicators, and response capacity. We establish public-private partnerships to gain access to previously prepared fire incident datasets while we protect commercial interests. We establish multi-stakeholder data protocols and develop community-centered collection mechanisms that respect local knowledge systems. We leverage real field knowledge from community-level surveys to assess the present scenario and propose upgrades to current practices. We perform dynamic vulnerability assessments that support both emergency planning and heritage conservation. Through weighted overlay analysis, we determine optimized fire hydrant placement for narrow streets that existing firefighting services cannot access. This spatial analysis ensures that infrastructure improvements respect the historic urban fabric while they enhance emergency response capabilities.

We expect collaborative data partnerships to enhance decision-making through three key contributions: (i) bridge critical information gaps that have long hindered effective fire risk management, (ii) support sustainable development, cultural preservation, and community resilience as interconnected goals and (iii) offer scalable lessons for complex urban management challenges in resource-constrained environments. This integrated framework demonstrates how heritage cities can balance safety imperatives with conservation priorities through evidence-based interventions.

How to cite: Ghimire, S., Dangol, S., Khatri, S., Duwal, S., and Bhattarai, Y.: A Framework for Fire Risk Assessment in Heritage Cities through Multi-Stakeholder Data Integration, EGU General Assembly 2026, Vienna, Austria, 3–8 May 2026, EGU26-7909, https://doi.org/10.5194/egusphere-egu26-7909, 2026.

EGU26-10195 | ECS | Posters virtual | VPS13

Warning is not enough: time delays and spatial inequalities in household-scale cyclone evacuation in coastal Bangladesh 

Md Rajibul Islam, Md Hasanur Rahman, Farzana Ahmed Ahmed, and Dr. Mashfiqus Salehin

Early warning systems are fundamental to cyclone risk reduction, yet evacuation outcomes depend on whether warnings trigger timely household action and whether households can physically reach shelters. This study quantifies evacuation thresholds, time-to-action, and mobility constraints using georeferenced survey data from 1,126 households across two cyclone-prone coastal unions in Bangladesh. Using household-level GPS data, we measured distance to the nearest cyclone shelter for each household and analysed evacuation behaviour across spatial distance thresholds.

Early warning message (EWM) coverage was high, with 93.5% of households reporting receipt of warnings, yet only 80.8% evacuated, indicating a persistent warning–action gap. Logistic regression shows that households receiving EWMs had more than twice the odds of evacuation (OR = 2.13, 95% CI: 1.27–3.55, p < 0.01), although evacuation likelihood varied significantly by distance to shelters, and road conditions. Distance to shelters and road conditions were also significantly associated with evacuation outcomes (p < 0.001).

Time-to-action analysis indicates delayed mobilisation after warnings: only 39.8% of households began preparation within 1 hour, and 9.3% delayed action beyond 6 hours. Distance and road conditions compounded these delays: evacuation times rose sharply beyond 1 km and were significantly longer where roads were reported poor or waterlogged during the cyclone, suggesting that delayed mobilisation increases exposure to peak travel constraints.

Spatial constraints also explain non-evacuation among warned households. Among households (18%) that received warnings but did not evacuate, the dominant barriers were distance from shelters (50.0%), shelter overcrowding and lack of privacy or maternal facilities (48.9%), and lack of transportation (45.7%), alongside caregiving and health-related constraints. Only 2.4% cited lack of knowledge about shelter locations, indicating that non-evacuation reflects spatial and mobility exclusion rather than information failure.

These findings demonstrate that cyclone evacuation is a threshold-based and constrained mobility process, where warnings increase evacuation odds but do not guarantee timely action for households facing greater distance, degraded road conditions, and care burdens. Strengthening anticipatory action therefore requires addressing spatial inequalities in last-mile accessibility, reducing response delays, and improving shelter suitability for households with health and caregiving needs in high-risk coastal settings.


How to cite: Islam, M. R., Rahman, M. H., Ahmed, F. A., and Salehin, Dr. M.: Warning is not enough: time delays and spatial inequalities in household-scale cyclone evacuation in coastal Bangladesh, EGU General Assembly 2026, Vienna, Austria, 3–8 May 2026, EGU26-10195, https://doi.org/10.5194/egusphere-egu26-10195, 2026.

EGU26-13004 | Posters virtual | VPS13

Trade-off between short-term resilience and long-term sustainability in infrastructure systems 

Rachata Muneepeerakul and Ning Lin

Resilience and sustainability are widely recognized as desirable properties of infrastructure systems.  Although related, they can become conflicting objectives, especially when resources available to enhance them are limited, making trade-offs between short-term resilience and long-term sustainability inevitable. Despite growing needs of increasing both resilience and sustainability, systematic analyses of such trade-offs remain limited.  In this work, we address this gap by developing a stylized, minimalistic stochastic model of system functionality under a sequence of disruptions.  The results reveal the nature of the trade-offs between short-term resilience and long-term sustainability and show that, depending on the effectiveness of investments in each, sub-optimal allocations may arise and should be avoided.  The analysis establishes clear relationships demonstrating how physical system features and investment strategies interplay to influence the nature of such resilience-sustainability trade-offs.

How to cite: Muneepeerakul, R. and Lin, N.: Trade-off between short-term resilience and long-term sustainability in infrastructure systems, EGU General Assembly 2026, Vienna, Austria, 3–8 May 2026, EGU26-13004, https://doi.org/10.5194/egusphere-egu26-13004, 2026.

EGU26-14542 | Posters virtual | VPS13

Development and validation of scales measuring natural resources and local development perceptions in the Danube Delta, a climate-vulnerable ecosystem 

Eugen Avram, Claudia Iuliana Iacob, Daniela Ionescu, and Iuliana Armas

Background: The Danube Delta, a UNESCO Biosphere Reserve and one of Europe's most important wetland ecosystems, faces increasing environmental pressures from climate change, including altered hydrological regimes, flooding patterns, and ecosystem degradation. Effective climate adaptation and nature-based solutions in such regions require not only hazard modeling but also robust tools for assessing how local communities perceive their environment and the governance structures meant to protect it. Understanding these perceptions helps designing risk communication strategies and fostering behavioral preparedness.

Methods: This study presents the development and psychometric validation of two scales measuring (1) perceptions of natural resources and (2) perceptions of local development and quality of life among Danube Delta inhabitants. A cross-sectional survey was conducted with 503 residents (76.3% female; M age = 24.8 years). Exploratory and confirmatory factor analyses were employed to establish the factorial structure and validity of both instruments.

Results: Descriptive findings revealed that residents perceive estate-level government engagement in ecosystem conservation as notably low (M = 46/100), significantly lower than local government engagement—a finding with direct implications for implementing top-down nature-based adaptation strategies. The Natural Resources Perception Scale yielded a 6-item, two-factor structure with excellent fit indices (CFI = .97, TLI = .96, RMSEA = .08): Factor 1 captures environmental quality (air, water, soil), while Factor 2 captures biodiversity (fish, birds, animals). The Local Development and Quality of Life Scale retained 12 items across two factors (CFI = .95, TLI = .94, RMSEA = .07): Factor 1 addresses tourism and infrastructure development, while Factor 2 encompasses governance engagement, ecosystem conservation mechanisms, and inhabitants' quality of life. Both scales demonstrated good internal consistency (α = .83 and α = .92, respectively).

Conclusion: These instruments offer researchers and practitioners standardized tools for assessing community perceptions in climate-vulnerable regions. Such assessments can inform the design of locally-relevant risk communication and identify gaps in perceived governance effectiveness. Future applications may include longitudinal tracking of perception changes following climate events or conservation interventions.

How to cite: Avram, E., Iacob, C. I., Ionescu, D., and Armas, I.: Development and validation of scales measuring natural resources and local development perceptions in the Danube Delta, a climate-vulnerable ecosystem, EGU General Assembly 2026, Vienna, Austria, 3–8 May 2026, EGU26-14542, https://doi.org/10.5194/egusphere-egu26-14542, 2026.

EGU26-15733 | Posters virtual | VPS13

Linking paleochannel evidence and physical vulnerability to urban flooding: a spatial analysis in Ibarra, Ecuador  

Brenda Mayacela-Salazar and Raisa Torres-Ramirez

Urban flooding is a recurrent hazard in Ibarra city, northern Ecuador, where intense rainfall frequently triggers the overflow of streams draining the slopes of the Imbabura volcano. Recent flood events reported at local and provincial scales highlight the increasing relevance of flood-related hazards in the city (El Universo, 2023; La Hora, 2023). Previous research has demonstrated a strong spatial correspondence between flood occurrence and paleochannel networks and has characterized urban flood hazard using historical records and geospatial analyses (Torres-Ramírez, 2024a; Torres-Ramírez, 2024b). However, the physical vulnerability of neighborhoods located within these flood-prone areas has not yet been systematically evaluated. 

This research builds on previous studies by integrating paleochannel geomorphological evidence with general indicators of physical vulnerability to evaluate urban flood risk in Ibarra. Areas susceptible to flooding were identified based on existing interpretations of paleochannel remnants and documented historical flood events. In parallel, information related to urban exposure was compiled from collaborative geospatial sources and analyzed within a GIS environment to explore spatial relationships between flood-prone zones and the built environment. These datasets were then jointly examined to characterize patterns of physical vulnerability across the city. 

The results indicate that urban areas located within or near zones influenced by paleochannel landforms tend to present higher levels of flood vulnerability. This pattern is particularly evident in low-lying sectors affected by recent urban growth and limited drainage capacity, where geomorphological conditions favor the concentration of surface flows. By integrating inherited fluvial morphology with present-day urban characteristics, this approach provides a more comprehensive understanding of urban floods in Ibarra. In this way, the study provides relevant information linking paleochannels to support flood analysis and urban planning in rapidly growing Andean cities, based on the case of Ibarra. 


References  

El Universo. (2023, february ). Lluvias afectan a varios sectores de Ibarra. https://www.eluniverso.com/noticias/ecuador/lluvias-ibarra-febrero-2023-nota/

La Hora. (2023, february ). Las calles de Ibarra se llenaron de lodo por inundaciones. https://www.lahora.com.ec/imbaburacarchi/Las-calles-de-Ibarra-se-llenaron-de-lodo-por-inundaciones-20230223-0020.html

Torres-Ramírez, R. (2024, a). Hazard and Risk Assessment of Secondary flows (lahars) in Ibarra city, Imbabura – Ecuador. Université de Genève, Switzerland. 

Torres-Ramírez, R. (2024, b). Paleochannels and their correspondence with floods in the 21st century. Case study of Ibarra city, Imbabura, Ecuador., EGU General Assembly 2024, Vienna, Austria, 14–19 Apr 2024, EGU24-14423, https://doi.org/10.5194/egusphere-egu24-14423. 

How to cite: Mayacela-Salazar, B. and Torres-Ramirez, R.: Linking paleochannel evidence and physical vulnerability to urban flooding: a spatial analysis in Ibarra, Ecuador , EGU General Assembly 2026, Vienna, Austria, 3–8 May 2026, EGU26-15733, https://doi.org/10.5194/egusphere-egu26-15733, 2026.

EGU26-15909 | Posters virtual | VPS13

A Structured Framework for Climate-Adaptive Cultural Heritage Management 

Maria Bostenaru Dan and the Climate Adaptation Working Group at ICOMOS Iscarsah

This presentation outlines a multi-faceted framework for addressing climate change adaptation. The methodology is built upon key pillars, including the resilience and integrity of cultural heritage assets, responsible resource use, and effective mitigation of hazard impacts. The success of any adaptation initiative depends on a holistic evaluation that considers not only technical feasibility and cost, but also its broader societal, cultural, community, and economic impacts, including the project's carbon footprint and adherence to principles of the circular economy.
The management of cultural heritage threated by increasing climate change hazards needs a multi-criteria evaluation framework. A structured approach to decision-making ensures that all intervention strategies prioritize conservation, resilience, and long-term sustainability. Criteria and their respective measurement spaces include technical feasibility, cost (which may be incured looking towards the benefit of increasing climate resilience for culturally significant buildings and unbuilt spaces), adherence to regulatory compliance, as well as impact on society and culture. Authenticity, values, and integrity of the heritage building or unbuilt space must be kept. Thus framework emphasizes key climate-specific metrics: hazard impact mitigation, proactive adaptability (such as preventive retrofit), efficient resource use (including materials, time and workforce as they may be depicted in devices for costs calculation), minimizing carbon footprint, and aligning with the circular economy. Actually building retrofit by itself as a reuse strategy illustrates the principles of circular economy itself at its best in the built environment. Such a retrofit project must demonstrate community acceptance (for example by respecting the mental map of landmarks to be kept in case of reconstruction, following Kevin Lynch principles as well as a psychogeograhic parcours), offer educational value, and ensure positive economic impact. 
This strategic management model follows a four-level hierarchy, from the definition of the overarching mission and objectives (Level 1), over problem definition, diagnosis, and stakeholders analysis (Level 2) to defining the challenge and identifying opportunities (Level 3). The highest level of decision-making (Level 4) - implementation - involves setting evaluation criteria, criterion weighting, and decision rules to inform the final choice and design of the intervention. The outcome is an action plan comprising operational and communication (a higher level of participation) means, demonstrated in a model project aiming at long-term resilience and effective climate risk management.

An analysis of various climate change-related events (floods: Elbe/East Germany 2013, Passau 2013, Florence 1966, Bosnia Herzegovina 2025, and winter storms: Lothar 1999, and Atlantic storm in 2013) is included, detailing, along with articles and online exhibitions, for each event:

  • Structures: Locations and specific areas affected, such as the Elbe and Bosna rivers, the Black Forest, inner-city forests in Karlsruhe, and the Pena Palace park in Sintra.
  • Damage: The impacts range from common effects like flooding of streets, transport disruption, and damage to lower levels of buildings (incl. economic impacts and activity disruption) to specific damage like forest destruction and agricultural land saturation from freaic water.
  • Intervention:
    • Short-term/Emergency: Early warning, sandbags, closing roads, removing fallen trees.
    • Long-term: Awareness campaigns, a flood museum (Passau), landscape solutions (river renaturation, changing vegetation to more storm-resilient species in affected forests)

How to cite: Bostenaru Dan, M. and the Climate Adaptation Working Group at ICOMOS Iscarsah: A Structured Framework for Climate-Adaptive Cultural Heritage Management, EGU General Assembly 2026, Vienna, Austria, 3–8 May 2026, EGU26-15909, https://doi.org/10.5194/egusphere-egu26-15909, 2026.

EGU26-16181 | ECS | Posters virtual | VPS13

Physics-Based Flood Fragility Modeling of CLT Shear Walls  

Nehal Mahmud Khan, Sabarethinam Kameshwar, and Rubayet Bin Mostafiz

In this study, a physics-based, performance-oriented framework to estimate the probability of failure of a cross-laminated timber (CLT) shear wall has been proposed. In low-lying coastal regions, residential buildings are becoming more exposed to both the pluvial and fluvial flooding. In previous studies, most structural analysis has been done emphasizing either solely on masonry-wall structures or entire building structures made of wood. In this study, the CLT shear wall has been subjected to flood-induced load. The wall demand is expressed in terms of a combination of hydrostatic and hydrodynamic forces, with the water depth acting as the intensity measure. Structural resistance has been computed at the component level by combining the in-plane and out-of-plane resistance models. Among the in-plane, bracket sliding, and rocking capacities, along with their combination has been considered. Whereas for out-of-plane bending resistance, the bending strength of CLT has been considered. Based on the demand and the resistance value, a limit state function has been formulated. Using a series of crude Monte Carlo simulations, the uncertainties in flood depth that lead to the damage state have been calculated. Overall, the results demonstrate that for all the given water depths, the CLT shear wall can withstand the load and avoid structural failure.

How to cite: Khan, N. M., Kameshwar, S., and Bin Mostafiz, R.: Physics-Based Flood Fragility Modeling of CLT Shear Walls , EGU General Assembly 2026, Vienna, Austria, 3–8 May 2026, EGU26-16181, https://doi.org/10.5194/egusphere-egu26-16181, 2026.

EGU26-16469 | ECS | Posters virtual | VPS13

Seismic Risk Assessment in Italy through Probabilistic Hazard Analysis and Integrated Exposure–Vulnerability Modelling  

Sharmistha Sonowal, Donato Amitrano, Antonio Elia Pascarella, Ravi Kumar, and Giovanni Gaicco

Seismic risk represents a major concern for densely populated urban areas, particularly in regions characterized by persistent volcanic and tectonic unrest. The city of Naples, southern Italy, is currently affected by an ongoing bradyseism crisis associated with the Campi Flegrei caldera, which has resulted in frequent low-to-moderate magnitude earthquakes (M 2–3+) over recent months. In this context, this study presents an integrated, data-driven framework for urban-scale earthquake risk mapping that combines probabilistic seismic hazard assessment with exposure and vulnerability modelling using convolutional neural networks (CNNs) and GIS techniques. Seismic hazard was quantified using earthquake records spanning 1990–2024 and modelled through six conditioning factors: elevation, slope, earthquake magnitude density, epicentral density, distance to epicentres, and peak ground acceleration. These spatial layers were integrated using a CNN architecture to generate a probabilistic hazard map representing the likelihood of earthquakes with magnitudes ≥3.5. Human exposure was subsequently assessed by integrating gridded population datasets with building footprints and parcel-level spatial data where available. Structural vulnerability was estimated through the fusion of land use/land cover information and recent building height data, both reclassified into susceptibility scores reflecting potential earthquake damage. The combined vulnerability index was categorized into five classes, with higher values corresponding to dense urban areas and taller building stock. The final seismic risk map was produced by integrating hazard, exposure, and vulnerability layers. Results highlight that areas characterized by high population density and intensive urban development sexhibit the highest seismic risk, consistent with observed urban patterns. The proposed methodology offers a transferable and automated approach for urban seismic risk assessment and can support risk-informed planning and disaster mitigation strategies in seismically active metropolitan regions.

How to cite: Sonowal, S., Amitrano, D., Pascarella, A. E., Kumar, R., and Gaicco, G.: Seismic Risk Assessment in Italy through Probabilistic Hazard Analysis and Integrated Exposure–Vulnerability Modelling , EGU General Assembly 2026, Vienna, Austria, 3–8 May 2026, EGU26-16469, https://doi.org/10.5194/egusphere-egu26-16469, 2026.

EGU26-21921 | ECS | Posters virtual | VPS13

Legal Resilience at the EU / non-EU Interface: Best-Effort Cooperation in Transboundary Lakes 

Laura Turley, Flore Vanackere, and Aline Telle

Climate change is reshaping hydrological regimes in European transboundary lakes, intensifying pollution pressures and exposing the limits of existing coordination arrangements. Hydrological extremes increasingly interact with persistent and emerging pollutants, creating compound challenges for legal and institutional frameworks developed under more stable conditions. While resilience has become a central concept in water governance research, we still know comparatively little about how specific legal designs support adaptive capacity across borders.

This paper draws on empirical research from a Swiss National Science Foundation–funded project on transboundary water cooperation in Europe. It examines pollution governance in three transboundary lakes—Lac Léman (France–Switzerland), Lake Lugano, and Lake Maggiore (Switzerland–Italy)—where cooperation duties are often framed in flexible or “best-effort” terms and where EU and non-EU legal orders meet. The analysis compares bilateral agreements, joint commissions, regulatory standards, and coordination practices across the three basins.

The empirical material is analyzed through the lens of legal resilience and adaptive capacity, building on work by Ruhl and by Cosens and Soininen. Five systemic properties—reliability, efficiency, scalability, modularity, and evolvability—are used to assess how legal arrangements facilitate coordination under conditions of uncertainty. The paper questions whether, under certain conditions, flexible legal arrangements (such as best effort obligations) can function as enabling elements of systemic resilience in transboundary water governance, allowing incremental adjustment and locally adapted responses to emerging pollutants and hydrological extremes. We conclude by deriving design implications for transboundary lake agreements facing compound hydrological-pollution pressures.

How to cite: Turley, L., Vanackere, F., and Telle, A.: Legal Resilience at the EU / non-EU Interface: Best-Effort Cooperation in Transboundary Lakes, EGU General Assembly 2026, Vienna, Austria, 3–8 May 2026, EGU26-21921, https://doi.org/10.5194/egusphere-egu26-21921, 2026.

EGU26-22076 | ECS | Posters virtual | VPS13

Ethical AI for Disaster Resilience: Centering Frontline Communities  

Shilthia Monalisa and Rubayet Bin Mostafiz

Our dependency on artificial intelligence (AI) is increasing gradually for predicting disasterallocating resources, emergency response systems, and calculating the impact of the disasterThese new technologies undoubtedly offer unparalleled opportunities to enhance resilience, but their implementation without ethical safety measures could multiply the existing inequalities with humanity. This study makes the case for a paradigm shift in humanitarian engineering toward human-centered AI, with a focus on prioritizing the requirements of frontline communities that are most impacted by climatic extremes. To investigate how design decisions affect equity results, this analysis draws on current developments in climate-resilient infrastructure and AI-driven catastrophe management. Using a policy-oriented perspective, this paper identifies three actionable strategies: mandating equity impact assessments for AI applications in disaster contexts, establishing governance frameworks that include community representation, and incorporating ethical AI training into engineering and public administration curricula. These ideas intend to bring about a convergence of scientific advancement and social justice, with the goal of ensuring that AI enhances human agency rather than diminishing it. Through the incorporation of frontline communities into the process of developing and deploying AI systems, this study will contribute to an approach to catastrophe resilience that is more accountable and inclusive. In conclusion, the article emphasizes the importance of interdisciplinary collaboration among engineers, policymakers, and affected people to develop AI solutions that are not only effective but also compassionate and egalitarian. 

How to cite: Monalisa, S. and Mostafiz, R. B.: Ethical AI for Disaster Resilience: Centering Frontline Communities , EGU General Assembly 2026, Vienna, Austria, 3–8 May 2026, EGU26-22076, https://doi.org/10.5194/egusphere-egu26-22076, 2026.

EGU26-22962 | Posters virtual | VPS13

Implementation of a Congolese observatory of urban gullies for research, governance, and early warning system 

Guy Ilombe Mawe, Eric Lutete Landu, Toussaint Mugaruka Bibentyo, Fils Makanzu Imwangana, Charles Nzolang, Jean Poesen, Olivier Dewitte, Charles Bielders, Matthias Vanmaercke, and Caroline Michellier

Urban gullies are an emerging geo-hydrological hazard of the Anthropocene, particularly in rapidly urbanizing tropical cities. In the Democratic Republic of the Congo (DRC), intense rainfall, steep slopes, erodible soils, and uncontrolled urban expansion combine to create highly favorable conditions for the formation and rapid expansion of UGs. Recent national-scale inventories reveal that more than half of Congolese cities are significantly affected, with nearly 3,000 urban gullies mapped. These features can reach tens of meters in depth and width within a few years, causing widespread destruction of housing, roads, and infrastructure, and leading to population displacement, injuries, and fatalities.

Recent analyses estimate that approximately 118,000 people were displaced by urban gullies in the DRC between 2004 and 2023, with displacement rates more than doubling after 2020. Currently, about 3.2 million people live within potential gully expansion zones, a number expected to increase dramatically as urbanization continues. Despite this growing risk, major knowledge gaps persist regarding the socio-economic impacts, rainfall thresholds, and short-term dynamics controlling gully initiation and expansion, severely limiting disaster risk management and early warning capacities.

This project aims to address these gaps through the implementation of a Congolese observatory of urban gullies, focusing on the cities of Kinshasa and Bukavu. Building on previous achievements, the project combines geomorphological research, citizen science, and policy advocacy to provide a proof of concept for an operational observatory.

The project adopts a participatory citizen science approach, engaging at-risk communities as “citizen observers” to collect in-situ data on gully dynamics, rainfall events, and socio-economic impacts. Community information sessions support risk awareness, co-development of data collection tools, and validation of observations. Data are collected using mobile applications, complemented by high-resolution geomorphological monitoring through rain gauge networks, GPS surveys, and drone imagery. These datasets enable improved characterization of gully expansion processes and identification of rainfall thresholds associated with hazardous events.

Beyond data generation, the project emphasizes governance and advocacy by translating scientific results into policy briefs and stakeholder workshops involving communities, authorities, NGOs, and urban planners. The project ultimately seeks to strengthen disaster risk management, inform sustainable urban planning, and demonstrate the feasibility and necessity of a dedicated national observatory for urban gullies in the DRC.

How to cite: Ilombe Mawe, G., Lutete Landu, E., Mugaruka Bibentyo, T., Makanzu Imwangana, F., Nzolang, C., Poesen, J., Dewitte, O., Bielders, C., Vanmaercke, M., and Michellier, C.: Implementation of a Congolese observatory of urban gullies for research, governance, and early warning system, EGU General Assembly 2026, Vienna, Austria, 3–8 May 2026, EGU26-22962, https://doi.org/10.5194/egusphere-egu26-22962, 2026.

EGU26-23167 | Posters virtual | VPS13

Stabilisation of urban gullies by managing rainwater at parcel scale 

Eric Lutete Landu, Guy Ilombe Mawe, Fils Makanzu Imwangana, Lise-Olga Makonga, Dan Lusolamo Nguizani, Rosette Luemba Luemba, Charles Bielders, Caroline Michellier, Olivier Dewitte, Jean Poesen, and Matthias Vanmaercke

Urban gullies (UGs) are an increasingly urgent concern in many cities of the Global South. Rapid and largely unplanned urban expansion, combined with inadequate drainage infrastructure, erodible soils, and intense rainfall, have led to the formation of thousands of large UGs —often several tens of meters wide and deep and extending over hundreds of meters— in cities across the Democratic Republic of the Congo. These gullies cause loss of life, destroy housing and critical infrastructure, and further exacerbate the vulnerability of already marginalized populations. The situation is particularly severe in Kinshasa, where more than 800 UGs have already been recorded, threatening over one million people.

A wide range of initiatives has been implemented to stop UG expansion. These include large-scale engineering interventions led by the state or non-governmental organizations, such as concrete reinforcement of gully heads and canalizing the gully channel. However, many measures are expensive and/or often fail.

Nevertheless, emerging evidence highlights promising strategies for urban gully prevention and control. A key principle is to prevent rainwater from leaving individual parcels by installing water retention structures, as the accumulation of runoff along roads is a primary driver of gully initiation and expansion. A critical requirement for success is that a majority of households actively participate in such initiatives. Improving risk awareness and creating synergies between UG control and water accessibility will therefore be crucial to achieving this.

Here we aim to demonstrate the effectiveness of such a strategy. For this purpose, we installed water retention structures in a representative catchment in Kinshasa affected by UGs. This is done in close collaboration with local stakeholders. By monitoring and studying participation rates as well as the resulting hydrological effects (e.g., through the involvement of local students), we will develop actionable guidelines to this growing problem in Kinshasa and elsewhere, thereby enhancing both urban resilience and water security in vulnerable neighborhoods.

How to cite: Lutete Landu, E., Ilombe Mawe, G., Makanzu Imwangana, F., Makonga, L.-O., Lusolamo Nguizani, D., Luemba Luemba, R., Bielders, C., Michellier, C., Dewitte, O., Poesen, J., and Vanmaercke, M.: Stabilisation of urban gullies by managing rainwater at parcel scale, EGU General Assembly 2026, Vienna, Austria, 3–8 May 2026, EGU26-23167, https://doi.org/10.5194/egusphere-egu26-23167, 2026.

EGU26-4650 | ECS | Posters virtual | VPS14

Integrating Climate Models and Coastal Risk Assessment in relation to Tropical Cyclones using an Adaptive Mesh Framework  

Yue Zheng, Chi‐Yung Tam, Chi-Chiu Cheung, and Wai-Pang Sze

Translating coarse-resolution climate projections into actionable, city-scale hazard information remains a critical challenge for coastal infrastructure planning worldwide. We present a transferable framework that combines adaptive-mesh numerical modeling with a physically consistent pseudo-global warming (PGW) methodology to generate high-resolution, climate-adjusted tropical cyclone (TC) scenarios. Here, we employ the CPAS (ClusterTech Platform for Atmospheric Simulation) model at variable resolutions (96-48-24-12-3 km), coupled with bias-corrected CMIP6 data under SSP5-8.5 forcing. Climate perturbations are applied using a physically consistent approach that also helps reduce model spin-up. The methodology incorporates a scale-aware physics scheme specifically validated for TCs. It bridges the scale gap between global climate models (~100 km) and decision-relevant hazard assessment (~1 km), offering a pathway applicable to coastal megacities globally. 

We demonstrate the framework using five representative TCs impacting the South China coast during 2008-2021, spanning a range of intensities, sizes, and approach characteristics. Historical control simulations accurately reproduce observed storm tracks and structures, establishing confidence in the climate-perturbed scenarios. Systematic climate change signals emerge across the event portfolio: (1) variable intensity amplification (3.1-8% °C⁻¹ climate sensitivity), dependent on storm structure, with the strongest storms exhibiting the largest response; (2) nonlinear precipitation enhancement, with median increases of 30-35% and amplification up to 50% at extreme percentiles; and (3) diverse structural responses, with some storms contracting while others expand their damaging wind field.

Event-to-event differences (e.g., initial intensity, storm size, track angle, and rapid intensification) drive diverse climate responses, making uniform adjustment factors potentially misleading. The framework provides physics-based, scenario-specific hazard simulations at 3 km resolution (extendable to < 1 km), directly linkable to exposure databases for “what-if” stress-testing of historical events under future climate conditions. Although demonstrated for TCs, the framework is transferable to other storm types and regions, with adaptive meshing enabling efficient, decision-relevant hazard modeling over complex coastal terrain.

How to cite: Zheng, Y., Tam, C., Cheung, C.-C., and Sze, W.-P.: Integrating Climate Models and Coastal Risk Assessment in relation to Tropical Cyclones using an Adaptive Mesh Framework , EGU General Assembly 2026, Vienna, Austria, 3–8 May 2026, EGU26-4650, https://doi.org/10.5194/egusphere-egu26-4650, 2026.

Geotechnical centrifuge modeling provides an effective approach to reproduce prototype-relevant stress states for high-speed dry granular flows. Yet, in a rotating reference frame, the Coriolis acceleration induced by rapid granular motion can become comparable to the centrifugal acceleration, thereby markedly modifying run-out behavior and impact responses and complicating the interpretation of physical modeling results. This study integrates a suite of centrifuge model tests with discrete element method (DEM) simulations to systematically elucidate how Coriolis effects govern both the mobility of dry granular flows and their impact on rigid barriers. For run-out processes, a DEM framework incorporating both centrifugal and Coriolis accelerations is employed to compare granular mobility under three Coriolis configurations: dilative, compressive, and deflective conditions. The results indicate that the dilative Coriolis condition substantially enhances flow mobility and kinetic energy, whereas the compressive condition suppresses run-out and promotes flow densification. In contrast, under the deflective Coriolis condition, the sensitivity of the final run-out distance and overall flow scale to Coriolis effects is significantly reduced. This reduced sensitivity is attributed to two opposing deflection stages during propagation and deposition, suggesting a practical advantage for mitigating Coriolis-induced bias in centrifuge modeling. For impact processes, centrifuge experiments combined with DEM simulations are used to characterize granular impact behaviors on rigid barriers under different Coriolis conditions. The Coriolis effect has a limited influence on the peak magnitude of the total impact force, but it significantly alters the force time history and spatial distribution by modifying the velocity structure, flow thickness, and particle-scale momentum transfer. Notably, impact responses obtained under the dilative Coriolis condition are closer in force level to Coriolis-free reference cases, whereas the resultant force application point is comparatively insensitive to the Coriolis configuration. Overall, the results demonstrate that Coriolis effects should not be treated as a uniform experimental disturbance. Instead, they represent a key control factor whose influence depends on the specific quantities of interest. The findings provide methodological guidance for configuring centrifuge experiments and interpreting results in the modeling of high-speed dry granular flows, with explicit implications for both run-out and impact simulations. 

How to cite: Zhang, B.: Understanding Coriolis effects in centrifuge modeling of high-speed dry granular flows, EGU General Assembly 2026, Vienna, Austria, 3–8 May 2026, EGU26-7212, https://doi.org/10.5194/egusphere-egu26-7212, 2026.

EGU26-9527 | ECS | Posters virtual | VPS14

Atmospheric Rivers as Triggers of Slope Instability and Landslides in the Himalayas 

Basit Ahad Raina and Munir Ahmad Nayak

Landslides are among the most destructive natural hazards in the Himalayan region, where steep terrain, complex lithology, heterogeneous soil cover, and intense hydro-meteorological forcing collectively govern slope instability. Despite growing recognition of ARs as major contributors to extreme rainfall, their explicit integration into physically informed slope stability assessments in the Himalayas remains limited. This research aims to investigate the impact of atmospheric-river-driven precipitation on slope stability across the Himalayan region by coupling landslide inventory data, soil characteristics, topographic controls, and slope stability theory. landslide occurrences are analyzed with respect to topographic parameters derived from digital elevation models, such as slope angle, elevation, and terrain morphology. Given the limited availability of site-specific geotechnical data over large mountainous regions, soil mechanical properties specifically cohesion and angle of internal friction are inferred from soil type and texture classes obtained from global soil databases. Representative ranges of shear strength parameters are assigned based on established values reported in the literature.

Temporal characteristics of AR events, including shape, movement, intensity, duration, and antecedent moisture conditions, are linked with observed landslide occurrences to identify critical thresholds associated with slope failure. Slope stability is evaluated using the factor of safety (FOS) concept derived from limit equilibrium principles for infinite and shallow slope conditions. The influence of atmospheric rivers is incorporated through rainfall-induced changes in pore-water pressure and effective stress, enabling assessment of strength reduction and progressive destabilization under extreme precipitation scenarios. The outcomes of this research are expected to quantify the degradation of slope stability associated with atmospheric-river-driven rainfall, identify soil and terrain combinations most susceptible to AR-induced failures, and provide a physically meaningful explanation for observed landslide spatial clustering during extreme precipitation events. By integrating atmospheric processes with geotechnical slope stability analysis, this study advances the understanding of hydro-geomorphic hazards in the Himalayas and contributes to improved landslide susceptibility assessment, risk mitigation, and climate-resilient land-use planning in mountainous regions.

How to cite: Raina, B. A. and Nayak, M. A.: Atmospheric Rivers as Triggers of Slope Instability and Landslides in the Himalayas, EGU General Assembly 2026, Vienna, Austria, 3–8 May 2026, EGU26-9527, https://doi.org/10.5194/egusphere-egu26-9527, 2026.

EGU26-11366 | ECS | Posters virtual | VPS14

Transferability of Semi-Automatic Landslide Mapping Approach Using High-Resolution DTMs: a Case Study from the Swabian Alb, Germany 

Ikram Zangana, Rainer Bell, Lucian Drăguţ, and Lothar Schrott

Landslides are among the natural hazards that significantly impact human life and infrastructure, making accurate landslide mapping essential for hazard assessment, risk reduction, and land use planning. However, mapping landslides, particularly in vegetated areas, remains challenging, as traditional field-based and manual mapping approaches are time-consuming and require substantial expert knowledge. Semi-automatic mapping methods based on high-resolution Digital Terrain Models (DTMs) have improved landslide inventory preparation; however, their transferability to larger and diverse environmental settings remains limited and require further assessment.  Therefore, this study aims to assess the transferability of a Geographic Object-Based Image Analysis (GEOBIA) landslide mapping approach using optimal moving window sizes, and to examine whether model performance varies across specific land use classes and improves with higher-quality DTM data.

A GEOBIA-based model, originally developed for forest covered landslides in the cuesta landscape of Jena region (Zangana et al., 2025), was transferred and applied to landslides at the Swabian Alb escarpment in south-western Germany, which are located not only in forests, but also in grasslands and settlements. The study area is characterized by Jurassic limestones overlying marls and clays. It is affected mainly by rotational slides, slump-earthflows, and translational landslides, some of which show repeated reactivation. The manually mapped landslide inventory was used for result validation and accuracy assessment. DTM derivatives (from the 2003 and 2023 data) were prepared using optimal moving window sizes following Zangana et al. (2025). The semi-automatic landslide detection workflow involved multi-resolution segmentation (MRS) and support vector machine (SVM) classification, followed by expert-based refinement and accuracy assessment against the reference map. Finally, transferability was further examined through land use class-based performance analysis and by evaluating the effect of higher-quality 2023 DTM data on model results.

The results indicate that the model developed for the Jena region is transferable to the Swabian Alb. When applied to the 2003 dataset, without differentiating between land use types, the model achieved a 75% detection rate for landslide body areas. Using the 2023 dataset increased detection accuracy to 86% compared to the 2003 data. The area-based detection accuracy in this study is approximately 30% higher than reported for the Jena region by Zangana et al. (2025). When considering only forested areas—for which the model was originally developed—the true positive rate increased by about 15%, while false positives decreased by a similar margin. Although the approach effectively identifies landslides, particularly in vegetated areas, it currently performs best for cuesta-related rotational slides. Further assessment and refinement are needed to extend its applicability to other landslide types. Nevertheless, the method shows strong potential for detecting landslides with distinct geomorphological signatures in high-resolution DTMs worldwide.

Reference: Zangana, I., Bell, R., Drăguţ, L., Sîrbu, F., and Schrott, L.: Mapping forest-covered landslides using Geographic Object-Based Image Analysis ( GEOBIA ), Jena region , Germany, Nat. Hazards Earth Syst. Sci., 25, 4787–4806, https://doi.org/10.5194/nhess-25-4787-2025, 2025.

How to cite: Zangana, I., Bell, R., Drăguţ, L., and Schrott, L.: Transferability of Semi-Automatic Landslide Mapping Approach Using High-Resolution DTMs: a Case Study from the Swabian Alb, Germany, EGU General Assembly 2026, Vienna, Austria, 3–8 May 2026, EGU26-11366, https://doi.org/10.5194/egusphere-egu26-11366, 2026.

EGU26-13589 | ECS | Posters virtual | VPS14

Co-seismic Landslide Susceptibility Mapping after the 2023 Al Haouz Earthquake (Morocco) Using Machine Learning 

Abderrahmane Edoudi, Seif-eddine Cherif, Hassan Ibouh, Nima Ahmadian, Farid El Wahidi, Mimoun Chourak, Robin Kurtz, and Olena Dubovyk

Landslides are a global geological phenomenon that constitute serious threats for human lives and engineering infrastructure, making the susceptibility assessment of these landslides a critical step for risk mitigation. The Al Haouz province, which was heavily struck by the Mw 6.8 earthquake of 2023, recorded several slope instabilities caused by seismic motion. In this context, the present study aims to evaluate co-seismic landslides susceptibility using machine learning models to support effective risk mitigations.

Logistic Regression LR and Random Forest RF models were employed to generate the susceptibility maps. The landslide inventory map with 302 landslide points and 600 non-landslide points was utilized with a 70:30 split for training/testing purposes. Sixteen conditioning factors were considered in the modelling process.

The results indicate RF performed better than the LR method, with an accuracy of 97.34% compared 92.92% for LR. The area under the curve (AUC) values ranged between 0.98 for LR and 0.99 for RF. reflecting the high predictive capability of both models. Elevation, Slope, PGA and rainfall had the highest contribution scores amongst the factors identified by both models.

The outcomes indicate the effectiveness of machine learning algorithms, specifically the RF model, for susceptibility mapping related to landslides in a seismic area. Elevation and slope are the most important factors influencing landslides from a geomorphological perspective in Al Haouz province. PGA is the most significant parameter among all factors as landslides are primarily triggered by seismic acceleration associated with earthquake events. Rainfall is a significant parameter that triggers landslides as a result of steep slopes associated with heavy rainfall either continuously or with high intensity.

The co-seismic landslide susceptibility maps produced in this study provide valuable information for identifying vulnerable zones and constitute an effective tool for land-use planning and disaster risk reduction aimed at protecting human lives, infrastructure, and the environment.

Keywors: Landslide susceptibility; Al Haouz earthquake; Machine learning; Morocco

How to cite: Edoudi, A., Cherif, S., Ibouh, H., Ahmadian, N., El Wahidi, F., Chourak, M., Kurtz, R., and Dubovyk, O.: Co-seismic Landslide Susceptibility Mapping after the 2023 Al Haouz Earthquake (Morocco) Using Machine Learning, EGU General Assembly 2026, Vienna, Austria, 3–8 May 2026, EGU26-13589, https://doi.org/10.5194/egusphere-egu26-13589, 2026.

EGU26-15290 | ECS | Posters virtual | VPS14

The Impact of Radiometric Terrain Normalization (γ⁰) on Burned Area Mapping Accuracy Using Sentinel-1 data 

Yonatan Tarazona and Vasco Mantas

Wildfires are increasingly destructive events, threatening ecosystems and human infrastructure while contributing significantly to carbon emissions. Accurate and timely burned area mapping is therefore essential for effective mitigation and recovery. Optical satellite sensors are often hindered by clouds and smoke, making Synthetic Aperture Radar (SAR) sensors like Sentinel-1, with their all-weather capability, a crucial tool for monitoring. However, SAR backscatter is significantly influenced by topography, which can distort signals and hinder accurate detection.

This study evaluates the impact of angular-based radiometric terrain normalization (RTN) on burned area mapping using Sentinel-1 SAR data and the Normalized Radar Burn Ratio (NRBR) index. We compare the performance of NRBR calculated with standard sigma nought (σ⁰) and with gamma nought (γ⁰) corrected via an angular-based RTN model implemented in Google Earth Engine. A U-Net deep learning model was used to delineate burned areas in Portugal and California. Results show that NRBR without RTN achieved better accuracy in Portugal, suggesting potential overcorrection effects in moderate terrain. In California, RTN slightly improved overall accuracy and reduced commission errors, although omission errors remained high. These findings indicate that while RTN enhances radiometric consistency, its impact on burned area detection with NRBR is limited, likely because the NRBR formulation itself already mitigates topographic effects through pre/post-fire ratios.

How to cite: Tarazona, Y. and Mantas, V.: The Impact of Radiometric Terrain Normalization (γ⁰) on Burned Area Mapping Accuracy Using Sentinel-1 data, EGU General Assembly 2026, Vienna, Austria, 3–8 May 2026, EGU26-15290, https://doi.org/10.5194/egusphere-egu26-15290, 2026.

EGU26-16126 | Posters virtual | VPS14

Estimation of Future 100-year Precipitation in Mie Prefecture, Japan 

Miyuki Kurata, Makoto Hasegawa, Chiharu Mizuki, and Yasuhisa Kuzuha

Probabilistic precipitation, such as the 100-year rainfall, is widely used as the design storm for planning flood control structures. However, due to climate change, the return periods estimated 50 years ago are no longer valid. This shift necessitates a fundamental reconsideration of how we determine design levels for construction. In other words, there is an urgent need for more sophisticated methodologies capable of handling non-stationary precipitation data.

To address these challenges, we present two key topics:

  • In Japan, the national and local governments have issued guidelines suggesting that future extreme rainfall intensities can be estimated by multiplying present-day values by a change factor of 1.1 to 1.15, assuming a 2.0°C increase in global temperature. While these guidelines tend to treat the change factor as largely uniform across regions for practical simplicity, we contend that it should be estimated with greater geographical precision. Consequently, we estimated the change factors specifically for Mie Prefecture in central Japan. Our results demonstrate that even within a single prefecture, the factor varies significantly depending on the specific location.

  • We have been developing a novel approach to estimate future 100-year precipitation levels through multivariate analysis. The details of this methodology and our findings will be presented in our poster session.

How to cite: Kurata, M., Hasegawa, M., Mizuki, C., and Kuzuha, Y.: Estimation of Future 100-year Precipitation in Mie Prefecture, Japan, EGU General Assembly 2026, Vienna, Austria, 3–8 May 2026, EGU26-16126, https://doi.org/10.5194/egusphere-egu26-16126, 2026.

On 7 January 2025, there took place a strong earthquake in Dingri with Mw7.1 in southern Tibet, China. Due to the complex geographical and geological conditions at this region, only a few ground-based seismic and geophysical observation stations have been installed here, but some typical anomalies have been detected before the earthquake occurrence and gave short-term and imminent prediction opinions, especially from the space-borne technologies. To reveal the whole preparation processes, multiple geophysical and geochemical observation data were collected and analyzed in this research, including regional geomagnetic field and gravity field in the lithosphere, atmospheric infrared longwave radiation (OLR) and methane gas (CH4), GNSS TEC and satellite-detected plasma and magnetic field disturbances in the ionosphere. The temporal and spatial developing characteristics of these anomalies is summarized preceding the Dingri earthquake, providing crucial support for understanding the precursory anomalies and their coupled formation mechanisms, as well as scientific basis for assessing seismic conditions in the region. The results show that, 1) Some methods provided explicit analytical predictions both before and after the earthquake, offering scientific support for regional seismic hazard assessment; 2) Pre-seismic anomalies exhibited rich development, with over 30 cumulative anomalies occurring before the earthquake, particularly showing concentrated development within the 10 days preceding the event; 3) Spatially, anomalies initially developed at long distances in the Earth-ionosphere system, and gradually converging toward the epicenter, as while the anomaly development progressively decreased in the altitude; 4) The thermal infrared and methane gas anomalies emerged during the pre-seismic phase, and fully covered the earthquake occurrence period, indicating that observations closer to the ground surface may provide more significant indicative value for the future epicenter. This seismic research demonstrates the potential of space-based Earth observation technologies to fill vast monitoring gaps in western regions of China and enhances the effectiveness of cross-layer integrated approaches. Future efforts should optimize comprehensive analytical prediction techniques by leveraging the strengths and addressing the weaknesses of different detection technologies, to improve the accuracy of spatio-temporal prediction of the three key seismic parameters.

How to cite: Zhang, X.: The multiple parameter disturbances and their coupling process around 2025 Dingri Mw7.1 earthquake in China, EGU General Assembly 2026, Vienna, Austria, 3–8 May 2026, EGU26-16354, https://doi.org/10.5194/egusphere-egu26-16354, 2026.

EGU26-17369 | Posters virtual | VPS14

Deep Reinforcement Learning for Operational Coastal Emergency Response With AI Agent Orchestration and Human Oversight 

Marcello Sano, Davide Ferrario, Samuele Casagrande, Sebastiano Vascon, Silvia Torresan, and Andrea Critto

Despite urgent needs for adaptive coastal risk management, operational systems still rely heavily on static triggers and fragmented information that overlook interactions between evolving hazards and response actions. Building on a completed game-like deep reinforcement learning (DRL) testbed, we present a pathway toward operational coastal decision support, progressing toward real-world case studies such as Venice in Italy and South East Queensland in Australia.

In the first phase, we developed a controllable game-like scenario that captures the essential components of coastal emergency management: a simplified representation of coastal geography and built assets, dynamic multi-hazard drivers evolving over time, and an action space reflecting plausible operational interventions under constraints. Using this environment, we demonstrated that a PPO-based DRL agent can learn adaptive policies through repeated interactions, as we gained practical lessons on state representation, constraint handling, and reward design for safety-critical objectives.

We then focus on the transition from simulation to real-world settings by outlining a set of alternative state-representation options, spanning classical dimensionality reduction and feature engineering through to learned latent-state methods. We report results for selected approaches, using autoencoders as the primary entry point to compress high-dimensional spatio-temporal hazard and exposure information into compact variables that retain decision-relevant structure while improving training efficiency and robustness. This provides a practical interface to real-world, digital-twin style environments built from geospatial and socio-economic data and forecast inputs.

Finally, we propose an orchestration layer to reduce the risk of AI-driven decision making and improve usability. A large language model (LLM) ingests DRL outputs and contextualises recommendations via retrieval-augmented generation over plans, studies, and standard operating procedures, together with API calls to dynamic data feeds. The proposed orchestration layer is intended to translate DRL outputs into human-readable and auditable decision support for a human-in-the-loop operator, grounding recommendations in retrieved local documentation and live data feeds to strengthen transparency, uncertainty communication, and operational trust.

How to cite: Sano, M., Ferrario, D., Casagrande, S., Vascon, S., Torresan, S., and Critto, A.: Deep Reinforcement Learning for Operational Coastal Emergency Response With AI Agent Orchestration and Human Oversight, EGU General Assembly 2026, Vienna, Austria, 3–8 May 2026, EGU26-17369, https://doi.org/10.5194/egusphere-egu26-17369, 2026.

EGU26-17956 | ECS | Posters virtual | VPS14 | Highlight

Motivation and Engagement in Disaster Mapping in Europe (MEDiME): Understanding hydrogeological risks and vulnerability through serious gaming 

Irene Petraroli, Johannes Flacke, and Funda Atun

This paper presents the development and pilot evaluation of Map@Me, an RPG-based serious game designed to improve understanding of hydrogeological risks and evacuation planning. Developed within the Motivation and Engagement in Disaster Mapping in Europe (MEDiME) Horizon Project, Map@Me targets a diverse audience and was tested in formal education settings, specifically middle and high schools.

The game integrates real local hazard maps, allowing players to explore their own environments and engage in realistic evacuation scenarios. With Map@Me, the player traces a realistic evacuation route that takes into account diverse mobility conditions, including disabilities, as well as advantageous and challenging factors, such as access to local knowledge and unfamiliarity with the area. Using a randomised system to determine the fictional character’s features in a real hazard map scenario, Map@Me represents a good example of how traditional disaster education can be supported by participatory methods of learning, whereby the agents can, in a controlled environment, experiment creatively with their behavioural choices and address their intrinsic biases.

During the presentation of the preliminary results from pilot sessions conducted with students, we will highlight both traditional learning outcomes—such as knowledge of evacuation sites and emergency preparedness measures—and “soft” learning outcomes, including cooperation, empathy, and collective responsibility.

The findings suggest that serious games such as Map@Me can enhance inclusive, place-based disaster preparedness, hazard map literacy and risk awareness, and overall contribute to a more socially aware approach to risk communication among younger audiences.

How to cite: Petraroli, I., Flacke, J., and Atun, F.: Motivation and Engagement in Disaster Mapping in Europe (MEDiME): Understanding hydrogeological risks and vulnerability through serious gaming, EGU General Assembly 2026, Vienna, Austria, 3–8 May 2026, EGU26-17956, https://doi.org/10.5194/egusphere-egu26-17956, 2026.

EGU26-20736 | Posters virtual | VPS14

A Four-Phase Serious Games Approach in the PARATUS Project 

Michalina Kulakowska, Funda Atum, Bettina Koelle, and Piotr Magnueszewski

The increasing complexity of cascading and compounding effects, necessitates innovative tools for wide stakeholder engagement and decision-making, especially in uncertain situations. Risk communicators often struggle to successfully convey these complexities to diverse groups of actors. In the PARATUS project, we implemented a series of four serious games: High Water Pantano, Bucur Simulation, Saltum Montem, Paratus Systemic Risk Game; to address this gap through experiential process.

The structured, stakeholder-driven process used in the PARATUS project was grounded in the CompleCSUs framework and the design thinking methodologies. The development process included four phases, as follows: 1) Research and conceptualization, focused on the literature review and Miro app based mapping of stakeholder needs and PARATUs four case study areas (Caribbean, Bucharest, Istanbul, and the Alps); 2) Scenario and role design, focused on translating real-world impact chains co-developed with stakeholders into interactive storylines; 3) Prototyping and iterative testing, focused on stakeholders interacting with the prototypes and providing direct feedback to the tools; and 4) Implementation and evaluation, focused on the deployment of serious games in workshops and assessing their effectiveness.
Some benefits identified include increased transdisciplinary collaboration and the opportunity for stakeholder exploration of the results of inaction or certain decisions linked with the risk reduction, in  a safe, simulated environment. However, the four-phase serious games approach in the PARATUS also resulted in certain critical lessons for the future implementation of co-design processes. These included the need for more flexibility in formats of the tools (analog vs. digital) to accommodate technical and context-based limitations; the importance of understanding the institutional hierarchies and factoring them into the process activities, and the need for multilingual support, especially in the transboundary context, for increase of the accessibility of the tools and trust levels of the participants. Following such four-step process, scientific risk assessment can be transformed into a scalable, user-centered and engaging tool for fostering long-term resilience.

How to cite: Kulakowska, M., Atum, F., Koelle, B., and Magnueszewski, P.: A Four-Phase Serious Games Approach in the PARATUS Project, EGU General Assembly 2026, Vienna, Austria, 3–8 May 2026, EGU26-20736, https://doi.org/10.5194/egusphere-egu26-20736, 2026.

EGU26-22036 | ECS | Posters virtual | VPS14

Compound hazards, crop sensitivity, and climate-smart adaptation 

Tanvir Hossain and Rubayet Mostafiz

Agricultural production remains central to food security and rural livelihoods, yet it is increasingly exposed to compound and cascading natural hazards under a changing climate. Drought, flooding, and extreme rainfall, heat stress, storms, and soil degradation do not operate in isolation. Their impacts often accumulate across the seasonal calendar and propagate beyond the field through labor, processing, storage, and distribution constraints. This contribution synthesizes evidence on how multi-hazard pressures disrupt agricultural productivity and stability, with attention to major staple and cash crops (for example, rice, wheat, maize, sugarcane, and soybean) and to vulnerability patterns that shape disproportionate impacts on resource-constrained and smallholder systems. We review and organize recent findings around three linked questions: (1) how hazard timing and co-occurrence influence crop sensitivity across key growth stages; (2) which biophysical and socioeconomic conditions amplify losses and slow recovery; and (3) which adaptation pathways show consistent promise under multi-hazard risk. A central focus is Climate-Smart Agriculture (CSA) as an integrated response, including practices that aim to improve productivity while strengthening resilience and reducing environmental tradeoffs. However, the review also highlights barriers that frequently limit CSA uptake in high-vulnerability settings, including institutional constraints, knowledge gaps, and financing limitations. By connecting hazard mechanisms to stage-specific crop impacts and to constraints along agricultural value chains, the synthesis supports more targeted adaptation planning and more realistic resilience strategies. The paper argues for context-specific, multi-stakeholder approaches that combine policy, technology, and farmer-centered implementation to address increasing climate and hazard uncertainty.

How to cite: Hossain, T. and Mostafiz, R.: Compound hazards, crop sensitivity, and climate-smart adaptation, EGU General Assembly 2026, Vienna, Austria, 3–8 May 2026, EGU26-22036, https://doi.org/10.5194/egusphere-egu26-22036, 2026.

EGU26-1128 | ECS | Posters virtual | VPS15

A Molecular Simulation Study on Sodium-Montmorillonite Clay Soil Stabilization through Calcium-Based Stabilizers 

Aparna Singh, Angan Sengupta, and Debanjan Guha Roy

The most prevalent clay mineral found in soil is montmorillonite. Montmorillonite-rich soils also known as expansive soils can pose hazards that bring geotechnical challenges because their swelling or shrinking behaviour arises due to the large water retention capacity of montmorillonite-rich soils. This soil swelling reduces the shear strength of soil and results in differential settlement of foundation, which compromises the structural integrity of the infrastructure. Montmorillonite is made up of multiple-layer structures, and these interlayers contain free cations that enable attachment of water molecules, which cause volumetric expansion of the soil. To prevent swelling, calcium-based stabilizers are often utilized for sodium-montmorillonite (Na-MMT) clay stabilization. These calcium-based stabilizers replace sodium ions with calcium ions with creating a diffuse layer around clay particles that affects the water adsorption capacity of Na-MMT. Therefore, to ensure structural safety and soil stability, it is essential to predict accurate soil properties, which depend on soil-water interactions; a pore-scale study of soil stabilization provides an enhanced understanding of soil-water interactions and water adsorption in the clay, which is responsible for swelling in Na-MMT. This study examines water adsorption and soil-water interactions inside montmorillonite clay pores using the Monte Carlo molecular simulations to quantify the systematic exchange of sodium with calcium cations and their influence on swelling behaviour in montmorillonite. The pore width (multiple of d-spacing) ranges from 10 to 20 Å, and varied pH environment via change in Ca²⁺ cation exchange compositions upto 100% have been simulated under in-situ conditions of temperature range of 288 to 308 K and at a pressure of 1 atm. The ClayFF forcefield was used to modelled Na-MMT clay pore, and the SPCE forcefield was used to modelled the water molecules. The simulated bulk densities of water were validated with literature data at the considered thermodynamic conditions. The Ca²⁺ exchange indicated an influence on the hydration behaviour of Na-MMT and altered the molecular ordering of water inside the pore. The adsorption of water shows dependency on interactions between water and the pore surface, as well as the available pore volume. Furthermore, these simulations analysed the percentage change in cation composition on the surface using local density distribution profiles and pore pressure across the height of the pore. This study aims to provide molecular insights into the performance of calcium-based stabilisers on expansive soils and clay-water interactions, which will help to predict pore pressure, swelling and softening and improved stability of expansive soils.

How to cite: Singh, A., Sengupta, A., and Guha Roy, D.: A Molecular Simulation Study on Sodium-Montmorillonite Clay Soil Stabilization through Calcium-Based Stabilizers, EGU General Assembly 2026, Vienna, Austria, 3–8 May 2026, EGU26-1128, https://doi.org/10.5194/egusphere-egu26-1128, 2026.

EGU26-1236 | ECS | Posters virtual | VPS15

Soil quality responses to extensive grazing use in subalpine pastures across the Pyrenees. 

Silvia Quintana, Clara Martí, David Badía, and Pilar Santolaria

Subalpine pastures in the Pyrenees are part of a long-standing cultural landscape shaped by centuries of extensive free-range grazing and transhumance. Like other European mountain regions, these grasslands are biodiversity-rich socio-ecological systems whose persistence depends on continuous management. Their ecological and cultural value is increasingly threatened by land abandonment, shrub encroachment, and climate warming, which reduce forage quality, alter soil processes, and compromise ecosystem resilience. Understanding how grazing influences soil functioning is therefore essential for sustainable pastoral management. We tested the hypothesis that, within low-stocking extensive systems, areas with moderately higher grazing exhibit enhanced soil quality relative to lightly used areas through effects on vegetation, nutrient inputs, and biogeochemical functioning, while remaining within low-intensity stocking levels.

We assessed soil quality under two relative grazing uses, Higher grazing use (HG) and Lower grazing use (LG), in extensive free-range systems with very low absolute stocking densities. At the Spanish site, the grazing unit comprises ~8,000 ha used by a free-ranging herd of 30 cattle (~0.04 LU·ha⁻¹). GPS tracking of five collared cows revealed strong contrasts in site use: 3,496 minutes in HG areas versus 298 minutes in LG areas during July–September. Parcels were classified based on vegetation structure and field indicators of bovine activity. At each site (Spain, Andorra, France), two areas (HG, LG) were sampled, each with four replicated subplots. Soil cores were collected at 0–6 cm (bulk density, mesofauna) and 0–20 cm (physical, chemical, biological properties), and aboveground biomass was harvested in 40×40 cm quadrats.

Soil Quality Index (SQI) values were calculated using the Minimum Data Set approach (Andrews et al., 2002), normalized on a 0.1–1 scale. Mesofauna was incorporated through the Ecological–Morphological Index (Menta et al., 2018).

The highest-weighted SQI indicators were electrical conductivity (0.560), total glomalin (0.197), pH (0.197), cation exchange capacity (0.197), water saturation content (0.170), coarse fragments (0.170), Olsen-P (0.073), porosity (0.073), bulk density (0.073), and clay (0.073). SQI showed consistent regional patterns, with higher values in HG areas: Spain 0.780 ± 0.005 vs. 0.727 ± 0.017; France 0.624 ± 0.027 vs. 0.606 ± 0.008; Andorra 0.714 ± 0.034 vs. 0.692 ± 0.024.

Several high-weight indicators showed grazing-related changes. Aggregate stability increased under higher grazing in Andorra but decreased in France and Spain. Total glomalin was identical between HG and LG in Andorra and France, but lower under LG in Spain. Cation exchange capacity and pH were consistently higher in HG. Electrical conductivity remained slightly higher in HG, especially in Spain. Coarse fragments varied by site, but their contribution was moderate relative to conductivity and cation exchange capacity.

Overall, moderately higher grazing helps maintain soil structural stability, supports fungal contributions to soil carbon, preserves cation-exchange capacity and pH, and sustains electrical conductivity within functional ranges. Together, these processes enhance soil quality in extensive free-range systems. Our findings highlight intermediate grazing as a key driver of soil functioning and ecosystem resilience in subalpine Pyrenean pastures, emphasizing the integration of soil indicators, biological communities, and grazing patterns for sustainable management of high-mountain rangelands.

How to cite: Quintana, S., Martí, C., Badía, D., and Santolaria, P.: Soil quality responses to extensive grazing use in subalpine pastures across the Pyrenees., EGU General Assembly 2026, Vienna, Austria, 3–8 May 2026, EGU26-1236, https://doi.org/10.5194/egusphere-egu26-1236, 2026.

EGU26-2885 | ECS | Posters virtual | VPS15

Vegetation and microtopography drive microbial necromass carbon sequestration in wetland soils 

Xiaomin Zhang, Yakov Kuzyakov, Dayong Zhao, and Jin Zeng

Floodplain wetlands are important carbon sinks, yet drought-induced water level declines threaten this function by triggering mudflat-to-meadow transitions that alter soil organic carbon (SOC) stocks and stability. Microtopography shapes wetland hydrology and vegetation productivity; however, its interactive effects with vegetation on microbial necromass carbon (MNC)—the main component of stable SOC derived from microbial death—remain unknown. Combining amino sugar biomarkers, amplicon and metagenomic sequencing, we investigated MNC distribution and drivers across vegetation covers (meadow and mudflat) and microtopographic units (dish-shaped depressions, delta slopes, and riparian slopes) up to 30 cm depth in Poyang Lake floodplains. In the top 10 cm, MNC pool shifted from bacterial (BNC) to fungal necromass carbon (FNC) dominance from mudflats to meadows, with FNC/BNC ratio increasing from 0.5 to 1.7. This shift was driven by drainage that stimulated plant growth and C input belowground as well as oxygenation, thereby enriching fungal saprotrophic and symbiotrophic guilds, cellulose-hydrolyzing enzymes, and genes responsible for aerobic lignin-degradation. Conversely, lower meadow pH suppressed bacterial richness and functions critical for carbon, nitrogen, and sulfur cycling. Microtopography further mediated MNC/SOC ratio following vegetation effects. In the top 10 cm, delta meadow soil had higher FNC/SOC than dish-shaped and riparian meadows, driven by recalcitrant dissolved organic matter that enriched saprotrophic fungi. Aerated riparian mudflat had higher BNC/SOC than other mudflats due to efficient nitrogen turnover and reduced CO2 emissions. Below 10 cm, BNC exceeded FNC owing to oxygen limitation for fungi. Delta meadow and riparian mudflat also maintained higher BNC/SOC than other microtopography units, primarily driven by clay-silt mineral protection. Overall, drought-induced meadow expansion restructured topsoil microbial communities, shifting microbial carbon sequestration pathway from bacterial toward fungal dominance. Slope wetlands mitigate climate change more effectively than depressions through greater SOC stability, mediated by depth-dependent drivers of microbial necromass—substrate availability in the top 10 cm and mineral protection below. These findings reveal that the impact of microbial life-and-death processes on long-term carbon sequestration and stability is regulated by the hotspot-specific conditions created by vegetation, microtopography, and soil depth, highlighting the need for hotspot-differentiated wetland management strategies.

How to cite: Zhang, X., Kuzyakov, Y., Zhao, D., and Zeng, J.: Vegetation and microtopography drive microbial necromass carbon sequestration in wetland soils, EGU General Assembly 2026, Vienna, Austria, 3–8 May 2026, EGU26-2885, https://doi.org/10.5194/egusphere-egu26-2885, 2026.

EGU26-4538 | ECS | Posters virtual | VPS15

Validate satellite remote sensing soil moisture with ground-based methods in dryland 

Ramson Kabenla, Arnon Karnieli, and Tuvia Turkeltuab

Soil moisture is a key component of the Earth system and hydrological cycle. Accurate soil moisture estimates are critical for many applications. Global soil moisture measurements are primarily derived from microwave remote sensing (RS); however, their spatial resolution is typically coarse, often on the order of kilometers, and is impacted by various factors. Therefore, in situ ground measurements should be used to improve the spatial and temporal representation of soil moisture in RS. The current study presents a comparative analysis of soil moisture data retrieved from Time Domain Reflectometry (TDR), Electromagnetic Induction (EMI), Cosmic-Ray Soil Moisture Observation System (COSMOS), and satellite remote sensing soil moisture derived using the OPTical TRApezoid Model (OPTRAM). The study site is located in a semi-arid environment, with a mean annual rainfall of 150 mm that falls between October and May. EMI measurements were conducted manually during the dry summer and wet winter seasons. Concurrently, TDR at depths of 10 and 20 cm and COSMOS continuously monitored and collected soil moisture data, respectively. Satellite information for the dates of the EMI surveys was retrieved from Sentinel-2 images.

Various correlation analyses were performed. The spatial and seasonal relationships between apparent electrical conductivity (ECa) and remote sensing soil moisture (RSSM) were also tested. At the beginning of the winter season, after a long dry spell, the ECa values correlated negatively with the RSSM. The best positive correlation occurred only after a long period of water percolation. The correlation between TDR and RSSM was the strongest among the methods. Meanwhile, COSMOS soil moisture also showed a strong positive correlation with RSSM, stronger than with ECa.

Concerning EMI measurements, soil moisture variability was minimal after five months of a dry, hot summer. Following several rain events, the ECa values exhibited high variability, which was related to increases in soil moisture. The RSSM showed a corresponding phenomenon: during the dry period, a narrow distribution of values was observed, and after a number of rain events, the distribution expanded. Thus, the ground-based EMI method and RSSM indicated the same spatiotemporal dynamics of soil moisture in the subsurface of dryland.

It is concluded that the RSSM represents the spatiotemporal conditions of the top-soil moisture conditions, but only after sufficient time for water percolation and distribution. TDR and COSMOS provide reliable soil moisture data to correct RSSM across time and space, whereas EMI is seasonally dependent (positive correlation during very wet periods and negative correlation after long dry spells).

How to cite: Kabenla, R., Karnieli, A., and Turkeltuab, T.: Validate satellite remote sensing soil moisture with ground-based methods in dryland, EGU General Assembly 2026, Vienna, Austria, 3–8 May 2026, EGU26-4538, https://doi.org/10.5194/egusphere-egu26-4538, 2026.

EGU26-9411 | Posters virtual | VPS15

Soil microbiome state in militarily impacted soils of Ukraine 

Volodymyr Illienko, Anna Salnikova, Valeriіa Bondar, Mykola Lazarev, and Alla Klepko

Military operations in Ukraine are causing significant changes to the environment, with soil being one of the most vulnerable components. Explosions, the utilisation of heavy machinery, and the pollution emanating from military facilities are collectively responsible for the deterioration of the soil physical properties. This results in a reduction of soil fertility and an alteration in the soil microbiome composition. Microorganisms play a pivotal role in biogeochemical processes that affect soil quality, its regenerative capacity, and the stability of agroecosystems. The rehabilitation and restoration of ecosystems, including soils, in the aftermath of armed conflict is crucial to ensure food security and strongly depends on the soil conditions. Therefore, comprehensive study to investigate the consequences of military interventions on the microorganisms, as well as physico-chemical characteristics of soils, and their consequent influence on the ecological conditions are necessary.

We collected soil samples from a militarily disturbed area in the vicinity of the village Moshchun in the Kyiv region in May 2025. The site presents a crater left by an aerial bomb explosion in the spring of 2022. The agrochemical parameters were determined according to the standard protocols. For microbiological analysis, soil suspension was plated onto selective nutrient media. The directional coefficients microbiological processes in soil (i.e., mineralisation-immobilisation coefficients, oligotrophy, pedotrophy) were calculated according to SSU 3750-98, and microbial transformation of soil organic matter – according to Mukha V.D.

The agrochemical parameters of the soil sampled in the crater and in the area directly adjacent to it indicates degradation of the soil organic matter and a decrease in nitrogen availability. These changes indicate the areas of significant thermal and mechanical destruction. An increase in mineral nitrogen in the centre of the approximately 6 m deep crater may reflect the exposure of inorganic nitrogen from deeper parent material layers. We also observed a decrease in the contents of mobile phosphorus and potassium, as well as soil organic matter (or humus) content. These findings confirm the negative impact of the explosion on soil fertility indicators.

Samples collected from the crater and adjacent undisturbed areas exhibited pronounced shifts in the abundance of different microbial groups. In the immediate vicinity of the explosion epicentre, the abundance of oligotrophs and pedotrophs increased, whereas populations of ammonifiers, phosphate mobilisers and cellulose decomposers decreased. Directionality coefficients of microbiological processes indicate a general shift toward predominance, of mineralisation processes withn the explosion-affected zones, resulting in the loss of organic carbon and a negative humus balance. The elevated proportion of oligotrophic and pedotrophic microorganisms in the crater centre suggest depletion of readily available nutrients for the microbiota, accompanied by active uptake of mobile nutrients from deeper soil or parent materials.

We acknowledge the Ministry of Education and Science of Ukraine for the financial support of this research (Projects 0124U001049 and 0124U000960).

How to cite: Illienko, V., Salnikova, A., Bondar, V., Lazarev, M., and Klepko, A.: Soil microbiome state in militarily impacted soils of Ukraine, EGU General Assembly 2026, Vienna, Austria, 3–8 May 2026, EGU26-9411, https://doi.org/10.5194/egusphere-egu26-9411, 2026.

EGU26-12374 | ECS | Posters virtual | VPS15

Short-term effect of leguminous cover crops on soil health in young vineyards with simulated global warming. 

Derlis Enciso-Santacruz, Chinquiquirá Hontoria, Fernando Peregrina, Esther Hernández-Montes, Sara Sánchez-Elez Martin, and Ignacio Mariscal-Sancho

Global warming is increasingly threatening vineyards soil health, particularly in Mediterranean regions, mainly compromising their biological parameters, which are highly sensitive to rising temperatures. Sustainable management practices, such as the use of legume cover crops (CCS) have been emerging as an effective strategy to mitigate these impacts. The objective of this study was to evaluate the implementation of legume CCs in new vineyard plantations, as a sustainable soil management practice to enhance resistance and resilience to warming conditions. The experiment was conducted in Central Spain) under dry climate (Bsk, cold steppe), with an average annual temperature of 14.1 °C, and annual precipitation of 421.8 mm, 57% of which occurs between September and February and the soil presented a sandy loam texture. A completely randomised design was applied with three factors: (i) temperature: normal (current climatic conditions) vs increased (~ +1 °C) using open-top chambers (OTC); (ii) soil management with three levels: bare soil with tillage (T), and two CCs, CC Trifolium subterraneum L. (TCC), and Medicago truncatula Gaern. (MCC); and (iii) grapevine cultivar: cv.  Airén versus cv. Tempranillo. The combination generated 12 treatments with four replicates (48 experimental units). Four months after grapevine planting and CC sowing, and one month after CC mowing soil samples were collected at two depths (0–10 and 10–30 cm) to determine key soil health indicators: enzymatic activities (β-glucosidase, phosphatase, urease, N-acetyl-glucosaminidase), basal and induced respiration, pH and electrical conductivity. The infiltration rate was also determined. Results show that both MCC and TCC significantly increased β-glucosidase and urease activities in the 0–10 cm layer compared with tilled bare soil, while OTC warming reduced phosphatase and N-acetyl-glucosaminidase activities, potentially compromising nutrient recycling. The grapevine cultivar × CC interaction revealed that soils with cv. Airén responded better with Medicago truncatula Gaern, showing a significant increase in urease activity in the 10–30 cm layer, whereas in cv. Tempranillo no significant differences were observed. This suggests that the effect of CC on soil biological activity depends on the grapevine cultivar, underscoring the need to further investigate these interactions. Basal and induced respiration increased with CCs relative to bare soil but decreased under OTC warming. In addition, MCC increased electrical conductivity in the 0–10 cm layer compared to TCC and bare soil. No significant differences were observed in the infiltration rate. These findings indicate that leguminous cover crops enhance soil biological activity in the short term, while physical properties such as infiltration and chemical properties such as pH require longer periods to show significant changes. Overall, the use of leguminous CCs represents a promising strategy to sustain soil health in young vineyards under global warming, with cultivar-specific responses that warrant deeper investigation.

Acknowledgements: This study was carried out in the framework of the CUBIC project. Grants PID2023-147576OB-C21 and PID2023-147576OB-C22 funded by MICIU/AEI/10.13039/501100011033

How to cite: Enciso-Santacruz, D., Hontoria, C., Peregrina, F., Hernández-Montes, E., Sánchez-Elez Martin, S., and Mariscal-Sancho, I.: Short-term effect of leguminous cover crops on soil health in young vineyards with simulated global warming., EGU General Assembly 2026, Vienna, Austria, 3–8 May 2026, EGU26-12374, https://doi.org/10.5194/egusphere-egu26-12374, 2026.

EGU26-13521 | ECS | Posters virtual | VPS15

Adding reactive transport capabilities to the 2DSOIL model with the integration of PhreeqcRM  

Aditya Kapoor, Sahila Beegum, David Fleisher, Dennis Timlin, Chittaranjan Ray, and Vangimalla Reddy

Process-based crop models are often coupled with soil models to compute the soil water and nutrient status in the root zone. The integration of a geochemical module with existing soil models can enhance their accuracy and capability to simulate additional key bio-geochemical processes. 2DSOIL is a legacy soil model integrated with several prominent process based crop models such as those for maize (MAIZSIM), cotton (GOSSYM), soybean (GLYCIM) and potato (SPUDSIM). However, this soil model lacks a dedicated geochemical component. This study addresses this limitation by integrating the prominent geochemical model, PhreeqcRM, with 2DSOIL using the operator splitting approach, resulting in an improved reactive transport model named ‘2DSOIL-PhreeqcRM’. This new model was validated with two exercises: (i) benchmarking simulated reactive transport against the standard analytical solutions; and (ii) inter-model comparison between cation-exchange simulations from 2DSOIL-PhreeqcRM versus PHREEQC’s built-in transport module. 2DSOIL-PhreeqcRM performed well in both exercises, with a mean absolute percentage error less than 4.75 % and RMSE less than 0.015 mol/l. This research establishes the accuracy and robustness of the 2DSOIL-PhreeqcRM, paving the way for its future use in simulating complex agro-bio-geochemical processes such as the nutrient transformations, precipitation and dissolution of minerals, effect of the addition of lime, ammonia and urea etc.

How to cite: Kapoor, A., Beegum, S., Fleisher, D., Timlin, D., Ray, C., and Reddy, V.: Adding reactive transport capabilities to the 2DSOIL model with the integration of PhreeqcRM , EGU General Assembly 2026, Vienna, Austria, 3–8 May 2026, EGU26-13521, https://doi.org/10.5194/egusphere-egu26-13521, 2026.

EGU26-13573 | ECS | Posters virtual | VPS15

Effects of Legume Cover Crops on Soil Nitrogen Availability, Biomass and Foliar N of Young Grapevines under Simulated Warming and Reduced Precipitation 

C. Joel Fariña, Derlis Enciso Santacruz, Esther Hernández- Montes, Ana B. Muñiz González, Ignacio Mariscal-Sancho, Chiquinquirá Hontoria, and Fernando Peregrina

In Mediterranean viticulture, climate change is reshaping management practices by increasing water scarcity and temperatures, challenging productivity and wine quality. The establishment of new vineyards is particularly vulnerable at early stages. In this context, legume cover crops (CCs) may enhance soil resilience and vineyard establishment through increased biological activity and biological N fixation.

This study evaluated the potential of two legume CCs to improve soil N availability and early grapevine development under a simulated warming scenario (+2 °C) and contrasting precipitation regimes. A microcosm experiment (12 kg soil per pot) was conducted under semi-controlled greenhouse conditions (Madrid, Spain) using a multifactorial design including three soil management treatments (bare soil, cover crop of Medicago truncatula Gaertn., and cover crop of Trifolium subterraneum L.), two precipitation levels (current and 15 % reduced), and two grapevine cultivars (white cv. Airén and red cv. Tempranillo). Cover crops were mowed 75 days after sowing, and their residues were left on soil surface as mulch. After one growing cycle, soil total N and extractable NO₃⁻ were measured, and grapevine foliar biomass, as well as foliar N content, were determined.

Under warming conditions, legume CCs did not increase soil total N or extractable NO₃⁻ compared with bare soil. In contrast, reduced precipitation increased both parameters. Moreover, reduced precipitation decreased total foliar N amount by a 14 %. This suggests that reduced precipitation limited N uptake by the grapevine and in consequence increased the soil NO3-. These results may be explained by decreased water availability, given that N assimilation is an active, energy-dependent process regulated by the water status of grapevine and CCs.

Foliar biomass showed significant interaction between soil management and precipitation level. Under bare soil conditions, reduced precipitation decreased leaf biomass by 22 % relative to current precipitation. In contrast, under current precipitation, CCs reduced leaf biomass by 20 % compared with bare soil.  However, under reduced precipitation CCs did not decrease foliar biomass respect to bare soil. This interaction indicates that cover crop competition is significant under current precipitation but not under reduced precipitation. A reduction in foliar biomass under CCs, when not accompanied by reduced precipitation, would indicate that factors other than water competition are involved. One such factor could be N uptake by the cover crops, which reduces N uptake by the grapevine and consequently limits its foliar development.

In conclusion, legume CCs did not increase soil N availability grapevine N status, or foliar growth in grapevines during their first growing cycle. However, they were not detrimental to grapevine foliar biomass under water-restricted conditions compare to the bare soil. Overall, the results highlight water availability as a key factor modulating of the soil–plant N balance. These results support the use of legume CCs as sustainable soil management for climate-resilient viticulture at the first year of grapevine establishment. Further research is needed to optimize legume CCs management to enhance soil N availability and grapevine performance under future climate change scenarios.

Acknowledgements: proyecto CUBIC. PID2023-147576OB-C21 y PID2023-147576OB-C22, financiadas por MICIU/AEI/10.13039/501100011033.

How to cite: Fariña, C. J., Enciso Santacruz, D., Hernández- Montes, E., Muñiz González, A. B., Mariscal-Sancho, I., Hontoria, C., and Peregrina, F.: Effects of Legume Cover Crops on Soil Nitrogen Availability, Biomass and Foliar N of Young Grapevines under Simulated Warming and Reduced Precipitation, EGU General Assembly 2026, Vienna, Austria, 3–8 May 2026, EGU26-13573, https://doi.org/10.5194/egusphere-egu26-13573, 2026.

EGU26-17269 | ECS | Posters virtual | VPS15

Interactive effects of warming and biochar addition on photosynthesis and greenhouse gas emissions in a paddy system 

Xuejiao Chen, Lihua Ma, Qiaozhi Mao, and Ningbo Cui

Global warming and rice cultivation are both significant drivers of greenhouse gas emissions, with methane (CH₄) representing a potent short lived climate forcer. Understand the interactive effects of rising temperatures and soil management practices in regulating carbon fixation and emissions is essential for developing climate-smart rice agroecosystems. Biochar amendment has been proposed to improve soil fertility and mitigate greenhouse gas emissions, yet its interactive effects with warming remain insufficiently understood. A synergistic assessment of warming and biochar application is therefore necessary to evaluate their integrated potential for climate mitigation and sustainable rice production.

A controlled pot experiment using a water bath warming system was established to investigate the interactive effects of warming and biochar amendment. Four treatments were implemented: (1) conventional fertilization (NPK, control), (2) warming (NPK + H), (3) biochar addition (NPK + BC), and (4) combined warming and biochar (NPK + BC + H). Throughout the growing season, key environmental variables, including soil temperature, moisture, and electrical conductivity were continuously monitored. In parallel, rice growth traits and photosynthetic parameters were measured periodically. Greenhouse gas fluxes (CO₂, CH₄, and N₂O) were regularly quantified to assess treatment effects on emissions dynamics.

The experiment revealed critical interactions between warming and biochar. Their effects were often divergent when applied singly but convergent in combination. Specifically, while biochar alone stimulated CO₂ and CH₄ fluxes, and warming independently raised soil temperature, their combined application did not yield additive outcomes. Instead, it suppressed the biochar-induced increase in CO₂ and CH₄, demonstrating a clear interactive mitigation effect. Furthermore, this combination synergistically promoted rice photosynthesis and growth, and all amendment treatments reduced N₂O emissions relative to the NPK control.

Our findings demonstrate that warming and biochar amendment interactively regulate soil-plant processes and greenhouse gas fluxes in rice paddies, primarily through an antagonistic interaction that reverses the sole effect of biochar on CH₄ and CO₂ emissions. This shift indicates a fundamental change in microbial activity and carbon metabolism under combined treatment. Moreover, the synergy between warming and biochar enhanced photosynthetic carbon fixation, illustrating a dual mechanism that simultaneously optimizes carbon gain and attenuates carbon loss. These results provide mechanistic insight into how integrated management can reconcile productivity with climate mitigation, supporting the development of climate-smart strategies for rice agroecosystems under future warming scenarios.

How to cite: Chen, X., Ma, L., Mao, Q., and Cui, N.: Interactive effects of warming and biochar addition on photosynthesis and greenhouse gas emissions in a paddy system, EGU General Assembly 2026, Vienna, Austria, 3–8 May 2026, EGU26-17269, https://doi.org/10.5194/egusphere-egu26-17269, 2026.

Introduction

Soybean has a strong impact on soil biological processes by interacting with microorganisms. Using arbuscular mycorrhizal fungi (AMF) and bacterial inoculants improves nutrient uptake and soil biological activity. However, the combined effects of these treatments with chemical seed treatment on soil health indicators in chernozem soils under intensive farming have not been studied enough.


Materials and Methods

The research was carried out on typical chernozem after maize for silage and soybeans. All variants of the experiment were created under uniform mineral fertilization (N₆₀P₆₀K₆₀).

The experimental design included the following treatments:

  • Control – mineral fertilization only, without seed treatment, arbuscular mycorrhizal fungi, or inoculation;
  • Chemical seed treatment – mineral fertilization with seed treatment (Maxim XL, 1.0 l/t);
  • Mycorrhizal treatment – MycoApply (4.0 g/ha) combined with seed treatment (Maxim XL, 1.0 l/t) under mineral fertilization;
  • Combined biological treatment – MycoApply (4.0 g/ha) + HiStick inoculant (400 g/ha) with seed treatment (Maxim XL, 1.0 l/t) under mineral fertilization

The number of microorganisms capable of ammonification, amylolysis, oligotrophy, pedotrophy, phosphate mobilization, and actinomycetes was assessed. The functional indices of soil health were evaluated using the coefficients of mineralization-immobilization, organic matter transformation, oligotrophy, and pedotrophy.


Results and Discussion

The control samples showed fairly high soil biological activity, which suggested a substantial presence of ammonifying microorganisms. The presence of numerous oligotrophic and pedotrophic microorganisms suggests the stable organic matter pools were frequently used. The limited quantity of actinomycetes present suggests a reduced rate of humification and carbon stabilization.

The application of Maxim XL led to a broader decrease in microbial populations, especially affecting oligotrophic and pedotrophic microorganisms. Lower values for the coefficient of organic matter changes suggest a dampening of microbial actions involved in breaking down organic residues.

Integrating MycoApply with a chemical seed treatment helped recover some microbial populations and improved functional measures when contrasted with seeds that only received the chemical treatment. More phosphate-mobilizing microorganisms showed up, meaning there was more phosphorus available.

The biological treatment, which included MycoApply with HiStick and Maxim XL, showed the best microbial response, as compared to other treatments. The presence of mycorrhizal fungi and bacterial inoculant lessened some of the negative aspects associated with chemical seed treatment. We found that microbial numbers and activity were greater than with just the chemical treatment by itself. Even though the microbial levels did not quite get back to where they started, this treatment did make the microbial community more resilient and stable when a lot of fertilizer was used.


Conclusions

In a common chernozem soil, various seed treatments for soybean farming caused noticeably different reactions in the biological markers for soil health. The application of chemical seed treatments independently led to a reduction in both microbial activity and the processes involved in organic matter transformation. In contrast, applying arbuscular mycorrhizal fungi, especially when paired with bacterial inoculation, somewhat lessened these problems and contributed to more even soil microbial activity. The findings indicate that biological methods can sustain soil health and ecosystem functions in soybean-based agroecosystems under conditions of global change.

How to cite: Pravylov, V.: Biological indicators of soil health under soybean cultivation as affected by mycorrhizal application and seed treatment in typical chernozem, EGU General Assembly 2026, Vienna, Austria, 3–8 May 2026, EGU26-21989, https://doi.org/10.5194/egusphere-egu26-21989, 2026.

EGU26-22253 | Posters virtual | VPS15

Data Mining of ELFA Bioindicators to Assess Soil Threats Across European Biogeoclimatic Regions Using the LUCAS Dataset 

Nicolas Martin, Laurent Caner, Oddur Vilhelmsson, and Claudio Zucca

Soil threats, such as pollution, salinity, soil organic carbon (SOC) loss and compaction, are often difficult to quantify or costly to analyze and bioindicator research represents an important approach for their efficient evaluation. Microbial bioindicators can reflect early biological responses to soil degradation processes, offering a sensitive and cost-efficient complement to conventional soil analyses. The identification of microbial clade–specific indicators can be achieved in detail through metabarcoding technologies, although these methods typically require extensive data processing and advanced bioinformatics expertise.

In contrast, ester-linked fatty acid (ELFA) analysis provides an inexpensive biological method capable of quantifying major microbial groups in soil, including bacteria, fungi, Gram-positive, Gram-negative and Actinobacteria. We hypothesize that ELFA analysis can serve as a complementary and alternative technique for soil threat bioindication.

Using LUCAS 2018 soil survey data, we assessed relationships between soil threat proxies (estimated metal and metalloid concentrations, electrical conductivity, SOCmeasured/SOCexpected ratio and bulk density) and ELFA-derived parameters (both raw and ratio-transformed) through random forest modeling and ANOVA. Significant bioindicators (α < 0.05 and β > 0.8) were confirmed using generalized additive model (GAM) regressions across European biogeoclimatic regions (Alpin, Continental, Pannonian, Mediterranean, Boreal and Atlantic).

Our results demonstrate that Actinobacteria/Gram− ratio, fungi-to-bacteria (F/B) ratio, Gram+ and Gram− groups can serve as potential bioindicators for soils enriched in metals (Zn and Cd) and for SOC loss (SOC_observed/SOC_expected) as significantly highlighted by Random Forest, ANOVA and GAM analyses. Some responses were found to be specific to continental, boreal and Mediterranean biogeoclimates.

These findings support the inclusion of ELFA-based microbial metrics in European soil monitoring schemes such as LUCAS or the Soil Monitoring Law. Future research should integrate ELFA data with molecular bioindicators to refine multi-parameter soil threat assessments.

How to cite: Martin, N., Caner, L., Vilhelmsson, O., and Zucca, C.: Data Mining of ELFA Bioindicators to Assess Soil Threats Across European Biogeoclimatic Regions Using the LUCAS Dataset, EGU General Assembly 2026, Vienna, Austria, 3–8 May 2026, EGU26-22253, https://doi.org/10.5194/egusphere-egu26-22253, 2026.

Abstract: Understanding how vegetation patterns control gravity erosion, such as avalanches, landslides, and mudflows, in slope–gully systems under heavy rainfall, remains a key challenge on the Chinese Loess Plateau. To address this, five 1-h simulated rainfalls were conducted, at an intensity of 1.4 mm/min, on experimental plots. These plots featured a gentle slope of 3° and a gully sidewall of 70°, and were covered with different vegetation patterns. Our results show that high-coverage grass on the gentle slope effectively reduced avalanche magnitude. The plot with 85% grass coverage had the lowest average avalanche volume, at 109.6 cm3, across the five rainfall experiments. Conversely, the excessive restoration of woody vegetation, or planting woody vegetation near the gully shoulder line, markedly increased landslide scale. Across the five rainfalls, the average landslide volume was 1,202.7 cm³ in the plot with 85% tree coverage and 983.3 cm³ in the plot with 60% shrub coverage along the gully shoulder line––both nearly triple that of bare land. Mudflow volumes in most of the plots accounted for less than 10% of the total gravity erosion. Avalanche and landslide volumes were significantly correlated with root mass density, silt content, bulk density, and organic matter, with all correlation coefficients exceeding 0.45. Consequently, implementing high-coverage grass on gentle slopes is one of the most effective strategies for mitigating gravity erosion on gully sidewalls.

Keywords: Gravity erosion; Vegetation pattern; Slope–gully systems; Grass; Loess Plateau

How to cite: Ran, G. and Xu, X.: High-coverage grass on slope–gully systems effectively mitigates gravity erosion in the Loess Plateau, EGU General Assembly 2026, Vienna, Austria, 3–8 May 2026, EGU26-6345, https://doi.org/10.5194/egusphere-egu26-6345, 2026.

EGU26-7358 | ECS | Posters virtual | VPS16

Unveiling the Invisible Ecological Cost: Seasonal Biodiversity Footprint of Crop Rotation in China 

Qiankun Niu and Dandan Zhao

Multiple cropping systems are widely adopted as a key climate adaptation strategy to ensure food security in China, however, they also impose significant pressure on freshwater ecosystems. While trade-offs between yield and water use are well-documented, the spatiotemporal impacts of specific rotation systems on aquatic biodiversity remain poorly quantified at fine spatial scales. To address this, we present a high-resolution framework integrating 30m-resolution crop rotation maps with monthly gridded characterization factors to quantify the potential fraction of species loss (PDF) at the grid level. This approach specifically distinguishes the impacts of seasonal rotation patterns from annual aggregates. We anticipate three key findings: (1) the identification of seasonal biodiversity hotspots driven by groundwater reliance in winter; (2) a quantification of the biodiversity leakage or savings resulting from China’s Crop Rotation and Fallow Policy; and (3) the revelation of spatial mismatches between agricultural intensification and ecosystem vulnerability. By shifting from a static, national-level perspective to a dynamic, spatially explicit one, this study underscores the urgency of incorporating seasonal biodiversity footprints into climate-smart agricultural policymaking to achieve food targets with ecosystem integrity.

How to cite: Niu, Q. and Zhao, D.: Unveiling the Invisible Ecological Cost: Seasonal Biodiversity Footprint of Crop Rotation in China, EGU General Assembly 2026, Vienna, Austria, 3–8 May 2026, EGU26-7358, https://doi.org/10.5194/egusphere-egu26-7358, 2026.

EGU26-7583 | Posters virtual | VPS16

Adsorption of heavy metals to chia seeds' mucilage 

Kidane Aregawi abrha and Gilboa Arye

Plant roots actively modify the physical properties of the soil in their area by secreting mucilage. Chia seed mucilage (CSM) is used as a model for plant root exudates primarily because of its similarities in physicochemical properties to natural root mucilage and its easy extraction in substantial, consistent quantities for laboratory experiments to study plant-soil-water relations. CSM can form highly viscous solutions at low concentrations and exhibits excellent properties, including water-holding capacity, surface tension, and emulsion stabilization. Most previous studies focused on chia seed mucilage as a conceptual model to describe the effect of mucilage on soil hydraulic properties, solute movement and gas diffusion in soil. However, the interactions between CSM and heavy metals have not been studied yet. Here, we showed the role of CSM as a bio-adsorbent for the removal of heavy metals and contaminants. Due to its sensitivity, non-destructivity, and simplicity, molecular fluorescence spectroscopy has been used to provide qualitative and quantitative information on the interaction between natural dissolved organic matter and metal ions. CSM was extracted from hydrated chia seeds and characterized using fluorescence Excitation-Emission Matrices combined with the Parallel Factor Analysis (EEM-PARAFAC) method. The binding interactions of CSM fluorescent components with heavy metals were quantified using fluorescence quenching titration and the Stern-Volmer model. Competitive binding studies were also conducted using one heavy metal as the quenching agent in the presence of competing heavy metal ions. Unconstrained PARAFAC modelling with two to four components was performed separately on 61 EEMs obtained from different concentrations of CSM samples, and the final component scores were determined through core consistency analysis, split-half analysis, and examination of the explained variance percentages. Protein-like (tryptophan & tyrosine) substances were the main fluorescent components identified by EEM-PARAFAC. The quenching titration results showed that the fluorescence intensity of CSM fluorescent components decreased with increasing heavy metal concentration under various environmental conditions. This strong quenching effect implies the binding ability of CSM to heavy metals and its significance in understanding metal toxicity, bioavailability, and transport in soil and natural waters.

How to cite: abrha, K. A. and Arye, G.: Adsorption of heavy metals to chia seeds' mucilage, EGU General Assembly 2026, Vienna, Austria, 3–8 May 2026, EGU26-7583, https://doi.org/10.5194/egusphere-egu26-7583, 2026.

Process-based crop models such as AquaCrop are widely used to assess crop responses to irrigation management and climate variability. However, large-scale scenario exploration and optimization are often constrained by the high computational cost of repeated model simulations. In this study, we develop a machine-learning surrogate model to emulate AquaCrop-OSPy (ACOSP) simulated wheat yields under a wide range of soil-moisture-triggered irrigation (SMT) thresholds and daily maximum irrigation limits (MaxIrr) across 26 growing seasons in Northwest India. A simulation ensemble of 21,840 ACOSP runs was generated by systematically varying SMT (0–100%) and MaxIrr (0–40 mm day⁻¹) for each season. The surrogate model was trained using season-wise climate variability, seasonal precipitation and irrigation strategy parameters (Season, SMT, MaxIrr) as predictors, with wheat yield (t ha⁻¹) as the target variable. We implemented and compared Random Forest and XGBoost regression models using a time-based train–test split to avoid information leakage across seasons. The best-performing XGBoost model explained ~87–90% of the inter-season and management-driven yield variability in the independent test period, while maintaining computational runtimes several orders of magnitude lower than ACOSP. Feature-importance analysis showed that SMT was the dominant explanatory factor, followed by climate-driven seasonal variability, whereas MaxIrr primarily influenced high-stress scenarios. The surrogate model successfully reproduced non-linear yield responses and threshold behaviour, suggesting strong potential for near-real-time decision support and large-scale scenario exploration. This work demonstrates that machine-learning surrogates can complement process-based crop models by enabling rapid evaluation of irrigation strategies, uncertainty assessment, and future climate scenario testing at regional scales. The developed framework is transferable to other regions, crops, and water-limited environments, offering a scalable pathway toward computationally efficient agricultural water-management assessment.

How to cite: Garg, D. and Kumar, H.: Developing a machine-learning Surrogate Model to rapidly predict wheat yields under Soil-Moisture-Triggered irrigation strategies in Northwest India, EGU General Assembly 2026, Vienna, Austria, 3–8 May 2026, EGU26-10703, https://doi.org/10.5194/egusphere-egu26-10703, 2026.

EGU26-10788 | ECS | Posters virtual | VPS16

Sewage sludge-derived biochar as a circular “waste-to-resource” strategy for wastewater treatment 

Erofili Vagia Gkogkou, Ekavi Aikaterini Isari, Eleni Grilla, Ioannis D. Manariotis, Ioannis K. Kalavrouziotis, and Petros Kokkinos

The increasing production of wastewater and sewage sludge (SS) is a major environmental challenge of the 21st century, while the need for sustainable waste management and resource recovery drives the development of innovative technologies for sludge utilization. The thermochemical conversion of SS through pyrolysis to biochar (BC) is a promising “waste-to-resource” strategy, as it allows both the reduction of sludge volume and the production of a functional, value-added material.

This study aims to examine sewage sludge-derived biochar (BCxSS), focusing on its characterization methods, the effect of pyrolysis conditions on its physicochemical properties, and its practical applications in water and wastewater treatment. By applying a structured PRISMA-based methodology, 170 studies concerning the production, modification, and environmental utilization of BCxSS were studied. The results showed that pyrolysis conditions, and particularly pyrolysis temperature, have a major influence on the properties of the BC, such as yield, ash content, pH, specific surface area, porous structure, and surface functional groups. Furthermore, BCxSS effectively removes heavy metals, dyes, phenolic compounds, and emerging organic micropollutants, such as pharmaceuticals and antibiotics. These removals occur through mechanisms such as physical adsorption, ion exchange, surface complexation, and π-π interactions. BCxSS is also attracting attention as a precursor for catalysts capable of degrading persistent pollutants. Despite these advances, the application of BCxSS for the adsorption and inactivation of pathogenic microorganisms and antibiotic resistance genes remains limited, revealing a critical research gap. Understanding BC-microorganism interactions is vital, given the significant public and environmental health risks posed by waterborne pathogens.

Overall, BCxSS provides a tangible example of circular economy in practice, transforming wastewater treatment byproducts into valuable resources that reduce waste and mitigate pollution.

How to cite: Gkogkou, E. V., Isari, E. A., Grilla, E., Manariotis, I. D., Kalavrouziotis, I. K., and Kokkinos, P.: Sewage sludge-derived biochar as a circular “waste-to-resource” strategy for wastewater treatment, EGU General Assembly 2026, Vienna, Austria, 3–8 May 2026, EGU26-10788, https://doi.org/10.5194/egusphere-egu26-10788, 2026.

EGU26-19240 | Posters virtual | VPS16

Advanced descriptive statistics of random reflectance measurements on plant-based biochars-do they even matter? 

George Siavalas, Karim Alami Sounni, and Marta Camps Arbestain

Numerous recent publications have demonstrated the relationship between random reflectance and the proportion of the fully carbonized fraction (equivalent to the fusinite maceral) contained in a biochar sample. These findings have motivated international frameworks and independent carbon registries to consider random reflectance among the core analytical proxies required to assess biochar permanence in soil. However, skepticism for the application of the proxy still persists, with main challenges revolving around the aspects of data acquisition and data interpretation. This is mostly attributed to the fact that the methods applied in the microscopic study of biochar were originally developed and standardized for the study of coal, where the calculation of the average and standard deviation of a 100 measurements on collotelinite, accompanied by a histogram showing the frequency distribution of the measured values, is often enough to describe and report this optical property.

Even though biochar samples are petrographically much simpler than coal and other sedimentary rocks, they have peculiarities that require a more careful consideration when applying standard petrographic techniques for their study. Biochar manufacturing conditions play a major role in the extent of the carbonization degree of the feedstock and this in turn has an impact on the heterogeneity of the formed biochar grains often resulting in complex distributions of the reflectance values, not always accurately captured in the basic descriptive statistics (mean and standard deviation, etc.), particularly in the case of polymodal distributions. For this reason a higher number of measurements, ranging between 300-500, on fields of view selected along a regular grid, is required to acquire meaningful average and standard deviation values, as opposed to coal samples, where a “run of the sample” on parallel traverses where collotelinite occurs is a common practice.  

Advanced descriptive statistics have long been successfully used for the evaluation of grain size analysis of clastic sedimentary rocks for the assessment of reservoir properties and depositional environment. This study attempts to investigate the frequency and probability distributions and derived advanced descriptive statistics of random reflectance measurements acquired from 50 plant-based biochar samples, in order to characterize their heterogeneity with regards to the proportion of the fully carbonized fraction. The calculated advanced descriptive statistics include the coefficient of variation and confidence intervals, measures of central tendency (median and mode), measures of dispersion (variance and interquartile range), shape parameters (skewness and kurtosis), and probability-related measures (probability density function, cumulative distribution function, and percentiles, particularly those associated with the established “inertinite benchmark”-IBRo2). In addition to those, the study attempts a comparison between the IBRo fractions determined by the measurement of 3-4 points per field of view, against those determined by just measuring the point located at the crosshair of each field of view, together with the convergence of the acquired set of measurements to the mean and median of each sample. Findings are expected to contribute to a mathematically more robust characterization of the acquired datasets, providing greater rigor in how this data can be utilized with regards to the assessment of biochar carbon permanence.

How to cite: Siavalas, G., Alami Sounni, K., and Camps Arbestain, M.: Advanced descriptive statistics of random reflectance measurements on plant-based biochars-do they even matter?, EGU General Assembly 2026, Vienna, Austria, 3–8 May 2026, EGU26-19240, https://doi.org/10.5194/egusphere-egu26-19240, 2026.

EGU26-276 | ECS | Posters virtual | VPS17

Evaluating the Effect of Compaction on Soil Hydraulic Properties 

Abdu Yimer Yimam, Desale Kidane Asmamaw, Margaret Chen, Seifu A Tilahun, Abebech Abera Beyene, Mekete Dessie, Kristine Walraevens, Enyew Adgo Tsegaye, Amaury Frankl, and Wim Cornelis

Soil compaction is commonly viewed by agronomists as an undesirable consequence of intensive agricultural activities arising from heavy machinery or livestock trampling. However, when induced at the bottom of furrows, it might help reduce the water loss during furrow irrigation. As such, understanding of how compaction alters soil hydraulic properties is essential for developing sustainable soil and water management practices. This study aimed to investigate the impact of compaction on soil hydraulic properties of a clay-textured Nitisol. Thirty undisturbed soil samples were collected from a depth of 15 cm in Koga irrigation scheme, Ethiopia, and subjected to five compaction levels: control (0%), 5%, 10%, 15%, and 20% volume reduction, each with six replicates. Saturated hydraulic conductivity was measured using the KSAT® apparatus with the falling head technique, while water retention and unsaturated hydraulic conductivity were measured using the HYPROP® system based on the modified evaporation method. Compaction reduced water retention and hydraulic conductivity, particularly in the wet range up to pF 3. Saturated hydraulic conductivity decreased by 9% to 78% from the lowest to highest compaction level tested. Compaction also increased bulk density (8% – 40%) and relative field capacity (4% – 10%) and decreased total porosity (6% – 33%), macroporosity (28% – 82%), air capacity (25% – 61%), and plant-available water content (8% – 17%). When compared with soil quality thresholds, compaction of 15% or more reduced plant-available water below optimal range (< 0.2 m3 m-3) and lowered saturated hydraulic conductivity below the threshold (8.64 cm day-1). While this study was designed to evaluate the efficiency of furrow irrigation subjected to compaction, the findings also emphasize the need for sustainable soil management to improve crop yield and soil resilience.

Keywords: Hydraulic properties, HYPROP2®, KSAT®, Soil compaction, Soil physical quality

How to cite: Yimam, A. Y., Asmamaw, D. K., Chen, M., Tilahun, S. A., Beyene, A. A., Dessie, M., Walraevens, K., Tsegaye, E. A., Frankl, A., and Cornelis, W.: Evaluating the Effect of Compaction on Soil Hydraulic Properties, EGU General Assembly 2026, Vienna, Austria, 3–8 May 2026, EGU26-276, https://doi.org/10.5194/egusphere-egu26-276, 2026.

EGU26-294 | ECS | Posters virtual | VPS17

Potential of Radon Deficit as a Monitoring Tool in Organic Soil Remediation: A Machine Learning-Based Predictive Approach 

Jaime Montalvo Piñeiro, Fernando Barrio Parra, Humberto Serrano García, Miguel Izquierdo Díaz, Eduardo De Miguel García, and David Lorenzo Fernández

The characterization and monitoring of soils and groundwater affected by non-aqueous phase liquids (NAPLs) remains a challenge due to the difficulty and high costs associated with their spatial delineation through intrusive methods (e.g., core-recovery drilling). The radon deficit technique is a promising screening method that enables the identification of potentially impacted areas based on the ubiquity of this gas, its operational simplicity and capability for rapid in situ measurement, and its preferential partitioning into NAPLs. However, subsurface sampling does not allow discrimination between impacts occurring in the vadose zone and those in the saturated zone. This work proposes the application of machine learning algorithms (Random Forest) as a tool to analyze the spatial variability of radon activity data in contaminated sites, with the aim of quantitatively determining their dependence on information related to contamination processes in both the vadose and saturated zones, as well as evaluating the ability of these algorithms to assess  the potential of the radon deficit technique for monitoring remediation processes in NAPL-impacted sites.
This study uses information collected during sampling campaigns conducted at a NAPL-impacted site at various depths within the vadose and saturated zones. The collected data (radon activity, lithological characteristics, and organic contamination information) were integrated into a machine learning algorithm that enabled the spatial analysis of the joint behavior of the variables, resulting in a predictive model to assess the potential of the radon deficit technique for monitoring remediation processes.
The results suggest that the radon deficit is a useful screening and monitoring method for NAPL-impacted sites, and demonstrate the value of machine learning not only as a predictive tool but also as an analytical resource to interpret complex relationships and validate indirect environmental monitoring techniques.

How to cite: Montalvo Piñeiro, J., Barrio Parra, F., Serrano García, H., Izquierdo Díaz, M., De Miguel García, E., and Lorenzo Fernández, D.: Potential of Radon Deficit as a Monitoring Tool in Organic Soil Remediation: A Machine Learning-Based Predictive Approach, EGU General Assembly 2026, Vienna, Austria, 3–8 May 2026, EGU26-294, https://doi.org/10.5194/egusphere-egu26-294, 2026.

EGU26-8294 | Posters virtual | VPS17

Taming Underground 

Rietje Evelijn Martinius

This paper examines how the urban underground is organized and managed during construction projects, focusing on professional boundaries between asset managers and project managers. Drawing on an ethnographic case study of a large underground utilities construction and renovation project, the paper analyzes how the underground is made sense of in everyday project practices. The findings show that during construction the underground was framed as an ambiguous entity, simultaneously treated as a manageable technical space and as an uncontrollable source of risk. Although largely absent from planning routines, underground conditions repeatedly disrupted project performance through delays, budget overruns and physical damage. Risk management became the dominant response to these disruptions. However, despite the involvement of underground experts, uncertainty could not be eliminated and projects proceeded with the expectation of further unforeseen events. Experts navigated this uncertainty by mobilizing a dual framing of the underground: as a controllable container for infrastructure and as a natural force beyond managerial control. The paper argues that the agency of the underground is decentralized and relational, emerging through local practices, narratives and material conditions rather than residing in a single actor or substance. By showing how managerial framings themselves become agentive, the study contributes to research on infrastructure governance and project management by reconceptualizing the underground as a distributed and untamed agent in urban development processes.


How to cite: Martinius, R. E.: Taming Underground, EGU General Assembly 2026, Vienna, Austria, 3–8 May 2026, EGU26-8294, https://doi.org/10.5194/egusphere-egu26-8294, 2026.

EGU26-13470 * | Posters virtual | VPS17 | Highlight

Soil Erosion Control at the Interface of Processes, Management, and Policy: Lessons from Serbia, Bosnia and Herzegovina, and the European Union 

Milica Vranesevic, Muhamed Bajrić, Marijana Kapović Solomun, and Ilija Čigoja

Soil erosion represents a major threat to soil health, water resources, food security, and ecosystem resilience, particularly in regions exposed to increasing climatic extremes and long-standing pressures from unsustainable land use. In Southeast Europe, intensified rainfall events, land degradation, and inadequate spatial planning have amplified erosion processes and related hazards, such as torrential floods, highlighting the need for more integrated and adaptive approaches to soil conservation.

This study examines soil erosion and conservation from a comparative and integrative perspective, focusing on Serbia and Bosnia and Herzegovina and situating both within the broader European Union policy and governance framework. Soil erosion is addressed not only as a biophysical process, but as a systemic challenge arising from interactions between natural processes, land management practices, institutional arrangements, and policy implementation.

In Serbia, soil erosion and torrential processes have long been recognized as major environmental challenges, particularly in hilly and mountainous catchments. The country has a strong tradition of erosion control and torrent regulation based primarily on technical and biotechnical measures implemented at the local scale. National assessments indicate that approximately 86% of Serbia’s territory is potentially exposed to water erosion, ranging from very weak to severe intensities, reflecting pronounced geomorphological diversity. Despite extensive technical expertise, soil conservation remains weakly integrated with spatial planning, ecosystem-based approaches, and socio-economic valuation of soil functions and ecosystem services, resulting in predominantly sectoral and engineering-oriented interventions.

In Bosnia and Herzegovina, erosion-prone catchments are shaped by steep terrain, erodible soils, increasing climate variability, and fragmented institutional responsibilities. National erosion mapping shows that areas affected by excessive, intensive, and medium erosion account for approximately 15.7% of the territory, while 84.3% is characterized by slight to very slight erosion, largely associated with forested areas, karst landscapes, and lowland agricultural plains. Management responses are largely reactive, focused on post-event measures following extreme rainfall and torrential floods, with limited long-term effectiveness due to weak catchment-scale coordination and insufficient integration with land-use planning.

The European Union provides an important reference framework through the Water Framework Directive, the Floods Directive, and the EU Soil Strategy, which promote integrated, catchment-based management and the wider use of nature-based solutions. However, implementation in candidate and neighboring countries remains uneven, constrained by institutional capacity, financial resources, and governance complexity.

By comparing national experiences with EU policy principles, this study identifies persistent gaps between scientific knowledge, management practice, and policy implementation. It argues for a shift from fragmented, sectoral approaches toward integrated strategies linking process-based understanding, sustainable land management, nature-based solutions, and coherent governance. In this context, soil erosion control emerges as a key pathway for advancing Sustainable Development Goal 15 (Life on Land; aligned with the Sendai Framework for Disaster Risk Reduction, 2015–2030), while simultaneously contributing to disaster risk reduction, climate adaptation, and ecosystem resilience in Southeast Europe.

How to cite: Vranesevic, M., Bajrić, M., Kapović Solomun, M., and Čigoja, I.: Soil Erosion Control at the Interface of Processes, Management, and Policy: Lessons from Serbia, Bosnia and Herzegovina, and the European Union, EGU General Assembly 2026, Vienna, Austria, 3–8 May 2026, EGU26-13470, https://doi.org/10.5194/egusphere-egu26-13470, 2026.

EGU26-14632 | ECS | Posters virtual | VPS17

MIC/MBC resistance fingerprints to As(III) in Bacillus and Pseudomonas as bioindicators across water and solid matrices in southern Perú 

Olga Libia Cjuno Huanca, Ana Cecilia Valderrama Negrón, Javier Martin Quino Favero, and Erika Silva Santos

Arsenic (As) contamination in soils and waters is a critical challenge to human health, agricultural productivity, and ecological integrity. In soil-water systems, As can modify microbial community structure and physicochemical properties; therefore, indicators that integrate As availability and biological stress across heterogeneous matrices are needed. This study evaluated whether phenotypic As resistance patterns in environmental bacteria can be used as bioindicators and whether native, As-tolerant Bacillus and Pseudomonas stains could support recovery-oriented assessments.

Soil/sediment and water samples were collected at six sites across three high-Andean areas in southern Perú: Desaguadero (Puno; deep well and spring), Sicuani (Cusco; two springs), and Espinar (Cusco; Salado River). Solid matrices included riverbed sediments, saturated solids at spring outlets, and excavated well soils (drill cuttings/spoil around the wellhead). In soil/sediment, pseudo-total As was determined by aqua regia digestion. In waters, dissolved As, was quantified alter filtration (0.45 µm) and acidification (HNO3 (pH < 2).

Tolerance assays were performed on nutrient agar amended with 100, 1000, 1500, and 2000 mg L-1 As (III) at 30°C for 24-72 h to estimate the minimum inhibitory concentration (MIC). The minimum bactericidal concentration (MBC) was then determined by subculture in As-free broth (triplicate; OD600). A total of 59 isolates were obtained: Bacillus (n = 40, water = 12, solid matrix = 28) and Pseudomonas (n = 19, water = 3, solid matrix = 16). Biochemical profiling assigned Bacillus to the B. cereus complex (cereus/thuringiensis), B. subtilis group, and Bacillus spp.; Pseudomonas to P. aeruginosa, P. stutzeri, P. mendocina and Pseudomonas spp.

Bacillus showed higher resistance than Pseudomonas: with growth observed in 37/40, 28/40, 20/40 and 4/40 isolates at 1000, 1500 and 2000 mg L-1, respectively, and higher tolerance enriched in solid matrix isolates (1500 mg L-1: 17/28 vs 3/12; 2000 mg L-1: 4/28 vs 0/12). In Pseudomonas, growth occurred in 16/19, 9/19 3/19 and 0/19 isolates at the same concentrations. The most tolerant isolates were B2539 (Bacillus sp.; MBC = 2200 mg L-1) and P2501 (P. aeruginosa), with an MBC = 1400 mg L-1). These results support MIC/MBC “resistance fingerprints” as quantitative bioindicators to compare sites and matrices in As-affected environments.

Keywords: arsenic; microbial bioindicators; riverbed sediment; springs, soil; Bacillus; Psedomonas; souther Perú. 

How to cite: Cjuno Huanca, O. L., Valderrama Negrón, A. C., Quino Favero, J. M., and Silva Santos, E.: MIC/MBC resistance fingerprints to As(III) in Bacillus and Pseudomonas as bioindicators across water and solid matrices in southern Perú, EGU General Assembly 2026, Vienna, Austria, 3–8 May 2026, EGU26-14632, https://doi.org/10.5194/egusphere-egu26-14632, 2026.

EGU26-14894 | ECS | Posters virtual | VPS17

Toposequence-driven variability on soil properties redistribution at irrigated semi-arid landscape, Northeastern Algeria 

Kamel Kouider, Yacine Benhalima, El Hadi Mazouz, Erika Santos, and Diego Arán

Agriculture in semi-arid Mediterranean regions contributes significantly to local food production and rural livelihood.  Nevertheless, it depends strongly on irrigation to sustain crop production and soil fertility. With the terrain complexity present, irrigation can lead to downward and lateral transfer of soil particles and nutrients, thus intensifying and accelerating the complex interplay between leaching and erosion, which in turn, reduce soil productivity and create spatial fertility imbalances. This study addresses the lack of knowledge about these processes to support better soil management in  Bir Bouhouch irrigated perimeter with complex terrain characteristics in northeastern Algeria , which represents a strategic agricultural area mainly producing cereals .The area has been used for intensive agriculture since the expansion of irrigation schemes in recent decades .In This study  the vertical and catenary variability of physicochemical characteristics of soils were examined. Four soil profiles along a toposequence from the summit (P1), to the toeslope (P4) were described and soils samples were collected in different depth to physicochemical characterization (texture, pH and electrical conductivity in water (EC), active lime, organic matter (OM), total nitrogen and extractable phosphorus. All profiles showed alkaline pH (8.10–8.60) with low EC (0.23–0.58 dS/m) that increased progressively from the summit to the teslope as well as with depth. Surface horizons (0- 60 cm) at downslope profiles showed finer textures with transition from silty clay to loamy clay and higher OM contents (up to 17.2 g/kg) compared with the summit (9.00 g/kg), indicating possible downslope colluvial accumulation. Active lime increased but followed a bi-profile sequence along surface (from 55 to 145 g/kg for P1-P2 and from 35 to 105 g/kg for P3-P4) and with depth reflecting a possible carbonate leaching and re-precipitation under alkaline conditions, locally forming caliche horizons. Extractable P concentrations ranged from 0.05 to 0.07 mg/kg and were enriched at lower slope positions at surface horizons. Besides total N (0.8–1.5 g/kg) showed limited vertical and lateral variation. These patterns demonstrate that soil variability along the transect can be mainly controlled by the topography-driven redistribution and carbonate dynamics enhanced by irrigation.

This work was funded by national funds through FCT – Fundação para a Ciência e a Tecnologia, I.P., under the projects UIDB/04129/2020 and UID/04129/2025 (LEAF) and LA/P/0092/2020 (TERRA).

How to cite: Kouider, K., Benhalima, Y., Mazouz, E. H., Santos, E., and Arán, D.: Toposequence-driven variability on soil properties redistribution at irrigated semi-arid landscape, Northeastern Algeria, EGU General Assembly 2026, Vienna, Austria, 3–8 May 2026, EGU26-14894, https://doi.org/10.5194/egusphere-egu26-14894, 2026.

Contamination of agricultural soils with heavy metals poses a critical threat to global food security and human health due to their high mobility and long biological half-life. Consequently, there is an urgent need for innovative remediation strategies, such as the development of safe multi-functional soil amendments, that do not disrupt food production. Among various additives, biochar (BC), obtained through the pyrolysis of organic wastes (including agricultural residues), is one of the most extensively studied. BCs can immobilize pollutants due to their developed surface area and abundance of functional groups. Hydrogels (HG) are another type of modifier that can simultaneously immobilize metals and improve the water-holding capacity of soils. Special attention is given to biopolymer-based HGs due to their biocompatibility and biodegradability. Furthermore, nanoparticles (NPs) have been reported to decrease heavy metal toxicity to plants. Thus, in this study, a series of hybrid chitosan-lignin HGs enriched with wheat straw-derived BC and selenium (Se) or copper (Cu) NPs were developed, and their effect on maize germination under water-deficit and cadmium contamination stress was evaluated.

During the study, agricultural soil was modified using 1% (w/w) of the developed HGs: (1) HG filled with BC; (2) HG filled with BC and SeNPs; (3) HG filled with BC and CuNPs; and (4) a combination of HGs (2) and (3). The plant growth experiment was conducted in a growth chamber and included soils contaminated with cadmium (35 mg/kg) and uncontaminated controls. Two weeks after sowing, watering was stopped, to simulate water-deficit conditions, and water evapotranspiration was monitored gravimetrically. After one week, seedlings were collected, and their fresh/dry mass and length were determined.

A decrease in evapotranspiration rates was observed for the soil modified with HGs. For example, the control soil lost 68 g/pot of water during 7 days, while the soils modified with HG/BC and HG/BC/SeNPs lost 59 and 57 g, respectively. Additionally, these HGs demonstrated a stimulatory effect on maize growth. The average shoot height increased from 18.3 cm in the control to 20.9 cm, and dry mass rose from 0.029 g to 0.037 g for the soils modified with HG/BC and HG/BC/SeNPs. The root dry mass also increased in both cases. Moreover, under cadmium contamination, both hydrogels neutralized the negative impact of the heavy metal on shoot growth. In contrast, HG filled with BC and CuNPs had an inhibitory effect on plant biomass growth. The mixture of hydrogels demonstrated a moderated effect on plant germination.

Acknowledgements: The research was funded by the Polish National Agency for Academic Exchanges under the Strategic Partnerships Program (BNI/PST/2023/1/00108) and the National Science Centre (2024/08/X/NZ9/00561).

How to cite: Siryk, O. and Szewczuk-Karpisz, K.: Chitosan-lignin hydrogels enriched with biochar and Se/Cu nanoparticles for the mitigation of cadmium and drought stress in maize, EGU General Assembly 2026, Vienna, Austria, 3–8 May 2026, EGU26-17043, https://doi.org/10.5194/egusphere-egu26-17043, 2026.

EGU26-17792 | ECS | Posters virtual | VPS17

Soil Erosion Assessment in the Beiluo River Basin Based on the CSLE Model and Sampling Survey Method 

Miaoqian Wang, Xiaoping Zhang, Haojia Wang, Weinan Sun, Wenliang Geng, and Xuanhao Liu

Soil erosion is a global ecological and environmental issue. To improve the accuracy of regional soil erosion estimation, this study investigates the impact of different sampling densities on soil erosion estimation at the watershed scale using the CSLE model, taking the Beiluo River Basin as an example. Based on the CSLE model, the study compares the effects of four sampling densities (0.0625%, 0.25%, 1%, and 4%) on soil erosion estimation in the study area using two methods: full coverage calculation and unit interpolation extrapolation. The differences and main causes of these effects are analyzed to identify the appropriate sampling density and soil erosion estimation method for the watershed. This provides a theoretical basis for the selection of field sampling density and methods in regional soil erosion dynamic monitoring. This study extracted land use and soil and water conservation measure information through remote sensing interpretation of sampling survey units at different densities. Based on the CSLE model, soil erosion rates were calculated for the watershed. The results indicate that both the full-coverage calculation method and the sampling survey method are capable of capturing the macro-scale patterns of soil erosion within the watershed. The full-coverage calculation method provides complete spatial coverage, effectively represents the spatial distribution characteristics of regional soil erosion, and is relatively insensitive to variations in sampling density. However, due to limitations in the accuracy of model input data sources, this method tends to overestimate soil erosion rates. In contrast, the sampling survey method utilizes higher-precision input factors, resulting in more accurate soil erosion assessments. Nevertheless, its estimation results are strongly influenced by sampling density and the choice of interpolation methods. In summary, the sampling survey method better reflects soil erosion variations across different topographic conditions, making it an efficient and practical approach for regional soil erosion investigations.

Keywords:Beiluo River Basin; CSLE model; soil erosion estimation; sampling density; full coverage calculation

How to cite: Wang, M., Zhang, X., Wang, H., Sun, W., Geng, W., and Liu, X.: Soil Erosion Assessment in the Beiluo River Basin Based on the CSLE Model and Sampling Survey Method, EGU General Assembly 2026, Vienna, Austria, 3–8 May 2026, EGU26-17792, https://doi.org/10.5194/egusphere-egu26-17792, 2026.

EGU26-18654 | ECS | Posters virtual | VPS17

Soil and vegetation diversity responses to designed Technosol applied in a sulfide mine under semi-arid conditions: field evidence at long term 

Aránzazu Estrada, Yacine Benhalima, Erika Santos, and Diego Arán

The recovery of sulfide mine areas using designed Technosols and vegetation is often evaluated under controlled conditions, whereas field-scale evidence remains scarce. The first pilot (1.5 ha) with designed Technosols, produced from agro-industrial and urban wastes, was installed at the São Domingos mine (Iberian Pyrite Belt, Portugal)in two areas subject to continuous leaching of acid mine drainage, for environmental recovery purpose. An adjacent area without Technosol was used as control. The areas with and without Technosol were sown with a commercial herbaceous mixture including some autochthonous shrub species. After 4.5 years from recovery system (Technosol+vegetation) installation, the physicochemical quality of soil (pH, EC, fertility, nutrients and potentially hazardous elements-PHE availability) and the vegetation status (species composition, % cover, total biomass, seed bank diversity) were evaluated. A total of 25 randomly distributed sampling points were established with both soil and vegetation samples collected at each point (T1-Technosol area: 15, T2-Technosol area 2: 5, control: 5). The aim of the study was to evaluate the chemical quality of soil and vegetation status in the Technosol and control areas at long-term.

The application of the designed Technosol significantly improved the soil quality of the mine area compared to the control, increasing pH (from 4.08 to 7.76) and organic C content (62.49 vs. 2.42 g kg⁻¹). The available fractions of macronutrients were higher in the Technosols areas while available PHE amounts were approximately 73% lower than in the control area. Vegetation reflected soil improvement, with 20 taxa (10 families) registered and higher family richness in the Technosol areas (10 vs. 4) .Technosols areas were dominated by Poaceae and Asteraceae showing almost complete soil cover (~96%). The control area was barely covered (<9%) mainly by Poaceae with Linaceae and Brassicaceae. The soil seed bank showed higher plant diversity in Technosols samples (8 families), while no germination was recorded in the control (assay conducted under controlled conditions for 3 months).

Comparing the two areas with Technosol, no remarkable differences was obtained for pH (7.75–7.78 and low PHE availability but EC EC (500.6 vs. 236.4 µS/cm), available P content (321.7 vs. 191.1 mg kg⁻¹) and CEC (61.1 vs. 46.6) were different. Despite the application of similar Technosol and seeding, the plant communities diverged for the plant diversity (8 families vs. 5) and dominance of grasses. Although the vegetation cover and biomass amounts were similar between the Technosol areas, a differentiation of the carbon stock obtained (948.8 vs. 645.2 g C/m-2). Seed bank family richness was similar (6 families each) but composition differed Poaceae, Asteraceae, Urticaceae and Apiaceae families were common, while presence of Brassicaceae and Solanaceae or Malvaceae and Amaranthaceae depended on the Technosol area. This field case study provides a practical workflow linking soil improvement, contamination dynamics and vegetation recovery. It highlights the effectiveness of Technosol in environmental recovery of sulfide mine areas at long term and the spatial heterogeneity evolution.

This work was funded by national funds through FCT—Fundação para a Ciência e a Tecnologia under the projects UID/04129/2025 (LEAF) and LA/P/0092/2020 (TERRA).

How to cite: Estrada, A., Benhalima, Y., Santos, E., and Arán, D.: Soil and vegetation diversity responses to designed Technosol applied in a sulfide mine under semi-arid conditions: field evidence at long term, EGU General Assembly 2026, Vienna, Austria, 3–8 May 2026, EGU26-18654, https://doi.org/10.5194/egusphere-egu26-18654, 2026.

EGU26-19058 | ECS | Posters virtual | VPS17

Integrated environmental Assessment of  multielement Contamination in Mining-Impacted Soils and Leachates: A Case Study from Northeastern Algeria 

Sonia Cedah, Fadila Fekrache, Diego Aran, and Erika Santos

Abandoned mining sites are a major source of long-term soil contamination by potentially toxic elements. This study assessed the environmental risk of metal-contaminated soils from the Sidi Kamber mine (northeastern Algeria). Mining residues are spread into the surrounding areas and the Oued Es-Souk, a river that supplies the Guenitra dam.This dam is the main drinking water reserve in the Skikda region..

This study is based on the geochemical and ecotoxicological analysis of 16 soil samples, from four stations distributed along the Oued Es-Souk until the dam. Samples were taken at two depths (0–25 cm and 25–50 cm) during both the dry and wet seasons. in Metal availability was evaluated through simulated leachate analyses, while soil properties (pH, fertility and pseudo-total elemental concentrations) were determined using conventional methods. Ecotoxicological bioassays were conducted to assess the biological effects of both soils and leachates in two plant species (Allium cepa and Lactuca sativa), focusing on seed germination, root elongation, and total biomass production as sensitive indicators of phytotoxicity.  Soil pollution indices, including the Igeo-Geoaccumulation Index and the CF-Contamination Factor were calculated to quantify contamination levels and identify the most critical elements.

The soils showed a very variable conductivity (510–3460 μS/cm) and a pH ranging from neutral to slight acid (5.15–7.54), with a tendency towards acidification during dry season. The leachates, less saline, were systematically acid (pH ~5). The organic carbon and some available nutrients contents were relatively low confirming low soil fertility.

The upstream location had the lowest Zn, Mn, Cu, and Pb concentrations in pseudo-total fraction recorded in wet season (194, 480, 16.5, and 88 mg/kg, respectively).  Despite being the lowest on the site, these levels exceeded benchmarks reported by Dutch Target Values or AFNOR standards. The highest concentrations are located at the surface of the soils and at specific points, reflecting a localized accumulation.  Mobility Index (MI = Av/PT) ranked metals in descending order of mobility: Cd>Zn>Ni>Cu>Pb>Cr>Fe. Contamination Factors confirm a significant polluting heritage: the pseudo-total contents of Zn, Pb and Cd are considerably enriched (CF>10 in many cases) compared to local natural levels. The geoaccumulation index classifies metals into three categories: strong to extreme contamination for Cd and Pb (Igeo>3); moderate accumulation for Zn and S (1<Igeo<2); and low to natural levels for Fe, Mn, Cr and Ni (Igeo=0).

Inhibition index specially on  Lactuca, shows that root growth is much more sensitive than germination. If it is very little affected (indices from -0.06 to +0.01), the length of the roots varies greatly, from a marked inhibition (-33.5% for the most toxic sample) to a significant stimulation (+46.5%). Among all the relationships studied, it is between pH and germination that the negative correlation is the most marked..

Overall, this integrated approach provides a comprehensive framework for assessing the environmental risks associated with abandoned mining.

This work was funded by national funds through FCT – Fundação para a Ciência e a Tecnologia, I.P., under the projects UIDB/04129/2020 and UID/04129/2025 (LEAF) and LA/P/0092/2020 (TERRA).

How to cite: Cedah, S., Fekrache, F., Aran, D., and Santos, E.: Integrated environmental Assessment of  multielement Contamination in Mining-Impacted Soils and Leachates: A Case Study from Northeastern Algeria, EGU General Assembly 2026, Vienna, Austria, 3–8 May 2026, EGU26-19058, https://doi.org/10.5194/egusphere-egu26-19058, 2026.

EGU26-19259 | ECS | Posters virtual | VPS17

Evaluation of soil contamination surrounding an abandoned ore processing plant in Northeastern Algeria: spatial variability and seasonality effect 

Mebarka Djemli, Khaled Boudeffa, Fadila Fekrache, Diego Arán, and Erika Santos

Abandoned ore processing plants represent critical, long-term sources of environmental contamination and therefore constitute an important field of research for the subsequent rehabilitation of the area.  

The objective of this study was the evaluation of the level and spreading of soil contamination by trace metal elements in the vicinity of an abandoned ore processing plant in northeastern Algeria. Superficial soil samples were collected from 8 sampling stations located upstream, downstream, and directly at the abandoned ore processing plant during the wet and dry seasons.  An environmental assessment of soil samples was conducted through the analysis of physicochemical characteristics: pH, electrical conductivity, and concentration of nutrients and potentially toxic elements in the available and total fractions.

Soil samples showed marked spatial variability in pH values and electrical conductivities although, in general, soils collected in the both seasons showed an acid pH (3.66-4.19) and low-moderate EC (250-446 µS/cm)The total concentrations of S, Fe, Cr, As, Cu, Pb and Zn were elevated in all soil samples, exceeding the maximum values permitted for industrial land use according to soil legislation in several countries (e.g. Canada). For Ni and Cd, only some soil samples exceeded the maximum allowed values. The variation in the elements' availability revealed clear spatial heterogeneity between locations upstream and downstream of the abandoned ore processing plant. However, values remained consistently high near the plant regardless of position, which confirmed its role as the primary contamination source through multidirectional dispersion via runoff and wind.

This work was funded by national funds through FCT – Fundação para a Ciência e a Tecnologia, I.P., under the projects UIDB/04129/2020 and UID/04129/2025 of LEAF-Linking Landscape, Environment, Agriculture and Food, Research Unit and LA/P/0092/2020 of Associate Laboratory TERRA

How to cite: Djemli, M., Boudeffa, K., Fekrache, F., Arán, D., and Santos, E.: Evaluation of soil contamination surrounding an abandoned ore processing plant in Northeastern Algeria: spatial variability and seasonality effect, EGU General Assembly 2026, Vienna, Austria, 3–8 May 2026, EGU26-19259, https://doi.org/10.5194/egusphere-egu26-19259, 2026.

EGU26-19332 | Posters virtual | VPS17

Changes in soil structure and sorption capacity after mixed treatment with macromolecular compounds and orange peels-derived activated carbons  

Sylwia Kukowska, Katarzyna Grygorczuk-Płaneta, and Katarzyna Szewczuk-Karpisz

Soil provides 95% of our food and provides other essential ecosystem services, such as water purification, biodiversity, and climate regulation. Unfortunately, numerous agroecological functions of soil are increasingly threatened by the intensifying, primarily anthropogenic, processes of soil degradation. This deteriorates the surface, sorption, and buffering properties of soils, the spread of pollutants into watercourses and groundwater, and adverse changes in porosity, organic matter composition and content, wettability, aggregation, and microbial community, resulting in soil partially or completely losing its ability to function properly. Therefore, it is so important to develop new soil conditioners that can reduce the effects of anthropogenic pressure and make soils more resistant to negative phenomena.

The main aim of this study was to estimate the impact of newly developed biochars and activated carbons from orange peels as well as water-soluble polymers (exopolysaccharide of bacterial origin (Rhizobium leguminosarum bv. trifolii), ionic polyacrylamides) on the structure and sorption capacity of the selected soil. Haplic Luvisol, the most common Polish soil, was collected from 0–20 cm depth of arable land in Poland (Parchatka, Lublin Upland, N 51°22′54″ E 21°59′54″). It was derived from loess parent material. It was modified with 1 wt.% of solid modifier (biochar, or activated carbon) by mixing. Macromolecular compounds (of initial concentration 100 mg/L) were added in the form of solutions. The following parameters: pH, ash content, total organic carbon content, porosity, variable surface charge of the soil were measured before and after modification to estimate effectiveness of the performed treatment. The soil sorption capacity was examined towards copper (Cu) and cadmium (Cd) using a batch adsorption method. The metal concentration was determined using a atomic absorption spectrometer working in the graphite cuvette technique (ContrAA 800, Analytik Jena, Germany). Porosity of the soils was examined using a mercury porosimetry (autopore IV 9500, Micrometrics INC, USA).

It was observed that all modifications using carbonaceous materials improved total pore area, average pore diameter, and total porosity of the soil, which was mainly associated with highly porous structure and relatively large specific surface area of the applied solids. The modification with activated carbon and cationic polyacrylamide resulted in the highest increase in total pore area. Carbon-rich materials could not only increase specific surface area and porosity of the soil, but also form organo-mineral connections, improving the number of active centers. Consequently, they increase soil sorption capacity towards Cu and Cd. The activated carbon application improved their 3- and 1.9-fold adsorption, respectively. The presence of polymers further increased their adsorption on the soil.

The research was founded by National Science Centre, Poland (2021/41/B/NZ9/03059).

How to cite: Kukowska, S., Grygorczuk-Płaneta, K., and Szewczuk-Karpisz, K.: Changes in soil structure and sorption capacity after mixed treatment with macromolecular compounds and orange peels-derived activated carbons , EGU General Assembly 2026, Vienna, Austria, 3–8 May 2026, EGU26-19332, https://doi.org/10.5194/egusphere-egu26-19332, 2026.

EGU26-19666 | Posters virtual | VPS17

Enhancing the representation of human activities’ impact on surface processes to improve the model’s ability to simulate reality on global scale 

Xiaoping Zhang, Rui Li, Baoyuan Liu, Qinke Yang, Jose Alfonso Gomez Carlero, Gema Guzman, Peter Strauss, and Tomas Dostal

Over the past decades, the World is suffering from a serious process of land degradation as a result of global climate change and the increasingly acute conflicts among population, resources and the environment. According to IGBPS (2018, 2023), the area of degraded soil worldwide is continuously increasing, and the global soil health situation is still deteriorating, with which soil erosion was regarded as the 1st threat to the planet soil.  In order to reverse this trend towards land degradation, many regions and countries have carried out sustained and painstaking initiatives for soil and water conservation, whose results has been monitored using different methodologies, and providing efficient recommendation for local government. It is urgent to adopt state of the art technologies including the latest earth observation techniques to evaluate global soil erosion status and soil conservation benefit in a standardized way.  Accurately achieving the status of global soil erosion and the distribution and types of soil and water conservation measures, will help to illustrate the difference in effectiveness of soil/water conservation practices, improve current technologies, promote soil/water conservation measures, eliminate interregional imbalances and promote the United Nations’ Sustainable Development Goals using solid science.

         Among numerous erosion models, only the USLE-family models are frequently employed in regional and global-scale soil erosion studies. Current research has established the distribution patterns of soil erosion at the global scale. However, significant challenge remains in balancing a model’s ability to represent real surface processes, its accuracy, and the target objectives f different levels of government.        For global erosion surveys and mapping (GSERmap), we will draw upon experiences from China’s 2010 Soil and Water Conservation Census. By employing an unequal probability sampling units and investigation methods, combined with high-resolution remote sensing imagery, we aim to enhance the models’ simulation capability of real-world surface processes while maintaining a certain accuracy.

How to cite: Zhang, X., Li, R., Liu, B., Yang, Q., Gomez Carlero, J. A., Guzman, G., Strauss, P., and Dostal, T.: Enhancing the representation of human activities’ impact on surface processes to improve the model’s ability to simulate reality on global scale, EGU General Assembly 2026, Vienna, Austria, 3–8 May 2026, EGU26-19666, https://doi.org/10.5194/egusphere-egu26-19666, 2026.

EGU26-20534 | ECS | Posters virtual | VPS17

Irrigation activates soil inorganic carbon dynamics in a calcareous mediterranean agroecosystem 

Ana P. Conte, Rodrigo Antón, Alberto Enrique, Isabel S. de Soto, and Iñigo Virto

The implementation of irrigation is a key management practice in arid and semi-arid regions to sustain agricultural productivity. Irrigation modifies the soil carbon cycle [1], [2] but its effects on soil inorganic carbon (SIC) have received far less attention than those on soil organic carbon. However, SIC constitutes most of the soil carbon stock in calcareous soils of these regions. Understanding how irrigation interacts with SIC dynamics, governed by carbonate dissolution and precipitation processes, is crucial to assess soil carbon stability and its response to management changes.

This study compares two contrasting management scenarios, rainfed maize and irrigated maize, and evaluated how irrigation affected the dynamics of the SIC in an experimental plot in Navarra (northern Spain) historically cultivated with rainfed wheat. We quantified SIC and SOC contents in bulk soil and in coarse (>50 µm) and fine (<50 µm) fractions of the tilled layer (0–30 cm) of a calcareous soil (⁓40% CaCO₃), together with the isotopic signatures of SOC (δ¹³C-SOC) and SIC (δ¹³C-SIC) along the first 7 years of the trial, as direct assessment of SIC isotopic signatures provides a more reliable estimate of pedogenic carbonate contributions than commonly used mixing equations, avoiding biases associated with C3–C4 crop changes [3].

After 7 years, it was found that the accumulated SOC inputs were higher in irrigated maize (24.0 Mg C ha⁻¹) than in rainfed maize (14.8 Mg C ha⁻¹).  Therefore, irrigated maize showed an increase in SOC stocks of +7.1% [4]. With regard to total SIC, ⁓24% of soil carbonates were found in the coarse fraction and ⁓16% in the fine fraction. No differences were observed between treatments, either in total SIC or in the coarse fraction, but there were differences in the fine fraction of irrigated maize compared to rainfed maize (-1%).

Clear differences in δ¹³C-SIC were however observed between treatments. In bulk soil, δ¹³C-SIC decreased from −3.80‰ under rainfed maize to −4.14‰ under irrigated maize. In the coarse fraction, the shift was more pronounced, from −3.70‰ to −4.95‰, while intermediate changes were observed in the fine fraction (from −3.94‰ to −4.20‰). These isotopic shifts indicate that irrigation, together with increased organic matter inputs, activated carbonate dissolution–precipitation cycles, thereby increasing the relative contribution of pedogenic carbonates.

Furthermore, the preferential accumulation of SIC in the coarse fraction may be related to the formation of pseudo-sands driven by carbonate cementation within aggregates [5], highlighting the need to adjust ultrasonic energy during particle-size fractionation.

Overall, our results demonstrate that irrigation triggers SIC dynamics in calcareous agricultural soils, promoting carbonate dissolution and precipitation processes even in the absence of significant changes in total SIC content, and emphasize the importance of jointly considering SOC and SIC to accurately interpret pedogenic carbonate formation under contrasting agricultural management regimes.


References

[1] Ball et al. (2023), https://doi.org/10.1016/j.soilbio.2023.109189

[2] de Soto et al. (2017), https://doi.org/10.1016/j.geoderma.2017.03.005

[3] de Soto et al. (2024), https://doi.org/10.1016/j.catena.2024.108362

[4] Antón et al. (2022), https://doi.org/10.3389/fsoil.2022.831775

[5] Rowley et al. (2018), https://doi.org/10.1007/s10533-017-0410-1

How to cite: Conte, A. P., Antón, R., Enrique, A., de Soto, I. S., and Virto, I.: Irrigation activates soil inorganic carbon dynamics in a calcareous mediterranean agroecosystem, EGU General Assembly 2026, Vienna, Austria, 3–8 May 2026, EGU26-20534, https://doi.org/10.5194/egusphere-egu26-20534, 2026.

 In order to reveal the sorting characteristics and transport mechanism of sediment on the steep slope Of engineering accumulation driven by runoff,three simulated runoff scour experiments were designed under The conditions of 10,20,and30 L/min from above to analyze the particle distribution characteristics of erosion sediment on the steep slope(32°) of the accumulation body of the Yangling project. The results showed that the clay and fine silt in the eroded sediment (before dispersion) increased significantly compared with the original soil, which was easy to produce erosion. The influence of runoff on aggregate fragmentation of erosion sediment clay content and the influence of runoff on pellet crushing effect on clay content is negative when runoff power is less than 1.709N/(m•s), but positive when runoff power is greaterthan3.89N/(m•s). In sediment,fine and coarse silt particles are mainly transported in the form of single grain, while clay and sand particles are mostly transported in the form of aggregates. Clay particles are enriched and sand particles are depleted. The sediment particle size determines the main transport mode,<0.11mm sediment particles are mainly suspended saltation transport,>0.11mm sediment particles are mainly rolling transport,More than 80% erosion sediment particles are transported by suspended saltation, and the contribution rate of rolling transport increases first and then decreases with the increase of runoff transport capacity. The conclusion of this study will help to reveal the micro mechanism of slope water erosion process of engineering accumulation body, and provide scientific basis for improving the prediction accuracy of slope water erosion model of engineering accumulation.

How to cite: Gao, Z.: Study on Sediment Sorting Characteristic sand Transport Mechanism of  Engineering Accumulation Slope Erosion, EGU General Assembly 2026, Vienna, Austria, 3–8 May 2026, EGU26-20591, https://doi.org/10.5194/egusphere-egu26-20591, 2026.

EGU26-20735 | Posters virtual | VPS17

Effects of historical land use changes on soil carbon, nitrogen, and microbial communities in an alpine sandy region of northwestern China 

Jinhong Guan, Lei Deng, Jinlu Guo, Yuan Wang, Wenjing Li, Zhe Chen, Guilin Cao, Shixiong Wang, Huichun Xie, Xiaogang Li, and Wenying Wang

Land use change plays a crucial role in the dynamics of soil carbon and nitrogen, thereby influencing soil fertility. However, the effects of historical land use changes on deep soil carbon and nitrogen dynamics, as well as microbial community composition, in alpine sandy regions remain poorly understood. Therefore, this study aimed to investigate how different historical land-use types regulate soil carbon and nitrogen and shape microbial community structure along a deep soil profile in an alpine sandy ecosystem. The study site located at elevation of 2800 m, experiences an arid climate, with an annual mean temperature of 3.9°C, an average annual precipitation of 246.3 mm, and an annual potential evaporation of 1,716.7 mm, thereby classifying the area as an alpine arid region with predominantly sandy soils. This study investigated a 23-year-old Caragana microphylla shrub forest in the Gonghe Basin, northwestern China. Three land-use types were established: post-agricultural reforestation on sandy land (PR), where former cropland was converted to forest 23 years ago, direct afforestation on sandy land (PF), established directly on sandy land without prior agricultural use, and bare sandy land as a control (CK), which remained uncultivated and unafforested. Soil carbon, nitrogen, and microbial community structure were examined across the 0–500 cm soil profile among the three land-use types. Results indicated that historical land-use changes significantly influenced the storage of soil organic carbon (SOC), inorganic carbon (SIC), and total nitrogen (STN). Average concentrations of SOC, SIC, and STN across the 0–500 cm soil profile were highest in PR (2.40, 10.37, and 0.28 g·kg⁻¹, respectively), followed by PF (1.46, 9.53, and 0.17 g·kg⁻¹), and lowest in CK (0.89, 8.31, and 0.11 g·kg⁻¹). SOC and STN storage within each 100 cm depth increment were also greater in PR than in PF and CK. Soil water content emerged as a critical environmental factor regulating deep soil carbon and nitrogen cycling. Microbial diversity was highest in the 0–40 cm layer under PR, whereas PF exhibited greater diversity in deeper soil layers (100–500 cm). Bacterial communities were more sensitive to historical land-use changes than fungal communities. In CK, microbial communities were primarily influenced by soil physical factors, including pH, soil water content, and electrical conductivity, whereas in PF, SOC and STN were the dominant controlling factors. In PR, SIC content, soil bulk density, and soil water content played major regulatory roles. Overall, the post-agricultural reforestation model in alpine sandy regions demonstrates greater effectiveness than direct afforestation on sandy land in enhancing SOC, SIC, and STN storage across the 0–500 cm soil profile and in promoting surface soil microbial diversity. In contrast, direct afforestation on sandy land plays a distinct ecological role in maintaining microbial diversity in deeper soil layers. These findings highlight that, in sandy land restoration, consideration of the long-term legacy effects of historical land-use conversion is essential for promoting the sustainable development of desertification control strategies.

How to cite: Guan, J., Deng, L., Guo, J., Wang, Y., Li, W., Chen, Z., Cao, G., Wang, S., Xie, H., Li, X., and Wang, W.: Effects of historical land use changes on soil carbon, nitrogen, and microbial communities in an alpine sandy region of northwestern China, EGU General Assembly 2026, Vienna, Austria, 3–8 May 2026, EGU26-20735, https://doi.org/10.5194/egusphere-egu26-20735, 2026.

EGU26-21561 | Posters virtual | VPS17

Impact of different pre-crops on soil nitrogen and growth of following winter wheat 

Dennis Grunwald, Heinz-Josef Koch, and Anna Jacobs

Winter wheat yields are varying by preceding crop as shown for certain preceding crops like wheat itself, winter oilseed rape or different legumes. However, there is hardly any published data on the pre-crop effect of other economically important crops such as sugar beet and silage maize. Further, the mechanisms of the pre-crop effect are partially unknown.

In this study, winter wheat was grown after wheat, winter oilseed rape, sugar beet and silage maize over two winter wheat growing periods (harvest years 2024 and 2025) in a long-term crop rotation trial in Central Germany. Soil mineral nitrogen (SMN) in 0-90 cm soil depth was analyzed at sowing in October, in December, January and February. After the last SMN sampling, plots were split into no (N0) and regular nitrogen fertilization (Nopt). At harvest, grain yield and straw biomass were recorded as well as nitrogen uptake.

Levels of SMN at sowing in October were clearly affected by pre-crop type with higher values after oilseed rape and lowest values after silage maize and sugar beet. In December, SMN levels were similar to October, while in January differences between the pre-crops became smaller and were mostly levelled by February. At N0, in both years, wheat grain yield as well as straw biomass was clearly highest after oilseed rape with up to 100 % more total biomass than after the other pre-crops. Other pre-crops had similar effects on total biomass. At Nopt, differences between the pre-crops were overall much lower, yet highest yields were found after oilseed rape.

December SMN levels correlated with grain yields at N0 over both years, while a similar correlation was even found under Nopt conditions in one of the study years. Thus, it appears nitrogen supply originating from pre-crops affects winter wheat growth. This might be one way pre-crops affect wheat growth beyond regulation of disease pressure.

How to cite: Grunwald, D., Koch, H.-J., and Jacobs, A.: Impact of different pre-crops on soil nitrogen and growth of following winter wheat, EGU General Assembly 2026, Vienna, Austria, 3–8 May 2026, EGU26-21561, https://doi.org/10.5194/egusphere-egu26-21561, 2026.

EGU26-22150 | Posters virtual | VPS17

Basin-Scale Design of Irrigation Districts and Water Planning Strategies for Sustainable Agricultural Intensification 

Sergio Zubelzu, Mercedes Gelos, Juan Ignacio Pais, Laia Estrada, Gonzalo Medina, Juan Francisco Rosas, Miguel Carriquirry, and Rafael Navas

Uruguay is facing increasing pressure on its water resources due to a strong dependence on agricultural production and a rising frequency of droughts. These trends intensify competition between agricultural water use and environmental water requirements, highlighting the need for adaptive strategies that ensure both ecosystem integrity and agricultural productivity.


Irrigated agriculture relies on on-farm, gravity-fed systems in which water is supplied from reservoirs and distributed through open channel networks. Although effective at the field scale, this traditional approach creates challenges for water allocation control, monitoring, and basin-scale planning due to the large number of small reservoirs and users. In addition, it largely overlooks land use planning, as irrigation development tends to follow water availability rather than optimising the use of high-quality soils or avoiding areas with a high risk of nutrient runoff.


In this context, the study examines the sustainable intensification of irrigated agriculture in the Arapey Basin (northern Uruguay). The basin covers approximately 11,400 km² and contains extensive agricultural lands with high potential for crops such as rice, maize, and improved pastures. The Soil and Water Assessment Tool (SWAT) model, calibrated and validated against long-term streamflow records (30 years), was implemented to represent current and future water management scenarios, including the design of irrigation districts, reservoir operations, and their impacts on streamflow, nutrient transport, and agricultural production. The analysis includes the potential expansion of the reservoir system by seven new reservoirs, increasing total basin storage from 50 hm3 to 280 hm3 across 13 reservoirs.


Simulation results indicate that coordinated reservoir development and controlled water releases could support the expansion of irrigated agriculture while mitigating the effects of drought in the main river. Additionally, regulated reservoir operations and strategically located irrigation districts may help dilute downstream nutrient concentrations. However, the results also highlight the need for good management practices at the field scale to prevent local nutrient accumulation and degradation of water quality. The findings suggest that a basin-scale approach to irrigation development, combining expanded reservoir storage with careful management, can enable sustainable agricultural intensification in northern Uruguay while simultaneously enhancing water governance and protecting environmental resources.

How to cite: Zubelzu, S., Gelos, M., Pais, J. I., Estrada, L., Medina, G., Rosas, J. F., Carriquirry, M., and Navas, R.: Basin-Scale Design of Irrigation Districts and Water Planning Strategies for Sustainable Agricultural Intensification, EGU General Assembly 2026, Vienna, Austria, 3–8 May 2026, EGU26-22150, https://doi.org/10.5194/egusphere-egu26-22150, 2026.

EGU26-1226 | ECS | Posters virtual | VPS19

CO₂ Migration and Leakage Risk in Dyke-Dominated Basaltic Reservoirs: A Multiphase Flow Modelling Study 

Dip Das, Tummuri Pavan, and Nimisha Vedanti

CO₂ storage in basalt is considered one of the safest geological sequestration methods, as injected CO₂ reacts with basaltic minerals to form stable carbonates. Flood basalt provinces offer additional advantages, particularly their very low matrix permeability and their three-tier structure, where a vesicular or fractured zone lies between two low permeable massive units. The vesicular zone is often regarded as a suitable storage interval because of its high lateral permeability. These basalt flows are often intersected by dykes, which are commonly dominated with cooling joints. Similar dyke swarms are a characteristic feature of many basaltic terrains around the world, including the Columbia River Basalt Group, the Deccan Traps, and the Spanish Peaks. In India, such fractured dykes frequently serve as pathways for groundwater recharge during the monsoon. As the Deccan basalts in India, are now being examined as a potential large-scale CO₂ storage reservoir, the presence of tens of thousands of dykes presents a serious challenge. These dykes may act as conduits for groundwater contamination or possible leakage routes for injected CO₂. In this study, we numerically examined the effect of a fractured dyke with high vertical permeability intersecting a storage layer at 1.5 km depth using a multiphase flow model. Supercritical CO₂ was injected into a 50 m thick storage interval fully saturated with brine. The permeability of both the dyke and the host layer was derived from discrete fracture network modelling of representative field exposures. The results show that the dyke allows upward migration of CO₂, indicating a clear leakage risk that questions the practical feasibility of large-scale storage in such settings. Because sealing individual dykes is not realistic, and many serve as natural groundwater pathways, the hydrodynamics of dyke systems must be carefully evaluated before any CO₂ injection activity. The results also indicate that sills may offer a more secure storage option.

How to cite: Das, D., Pavan, T., and Vedanti, N.: CO₂ Migration and Leakage Risk in Dyke-Dominated Basaltic Reservoirs: A Multiphase Flow Modelling Study, EGU General Assembly 2026, Vienna, Austria, 3–8 May 2026, EGU26-1226, https://doi.org/10.5194/egusphere-egu26-1226, 2026.

The increasing global demand for nickel, driven by its critical role in stainless steel production and emerging battery minerals technologies, has intensified exploration efforts in geologically diverse terrains. This study focuses on the Cuddapah Basin, a Proterozoic sedimentary basin in southern India, which presents a complex geological framework with promising yet underexplored potential for nickel mineralization. Through an integrated approach combining lithological mapping, geophysical surveys, and geochemical analysis, this paper present fingerprints of geochemical and geophysical signatures to target Nickel Exploration. The preliminary findings indicate the presence of ultramafic intrusions and favourable host rocks such as picritic sills which are typically associated with nickel sulfide deposits. The western margin of the Proterozoic-aged Cuddapah Basin contains gabbro and plagioclase bearing sills within the Tadapathri formations These sills have 4-28% MgO and 30-1050ppm Ni and they are characterized by elevated Th/Nb which is indicative of contamination by upper crustal material. The low MgO mafic magmas have one to two orders of magnitude viscosity higher than the picritic sill they are emplaced all along the Cuddapah basin margin. No Ni-Sulphide mineralization is known in this belt, but trace interstitial sulphide is present. The following features of the Pulivendla-Vemula sill complex indicate that the rocks are prospective for magmatic sulfide exploration:1. Tholeiitic lavas and sills were emplaced during extensional intra-cratonic rifting at a time of major Ni ore formation at ~1.9 Ga metallogenic epoch i.e late Proterozoic-Archaean in age.2. Un-deformed fresh differentiated ultramafic sills have a range in Ni concentration over a narrow interval of forsterite content with primary olivine 3. These sills and other sills in the footprint of regional magnetic and gravity anomalies possibly contain feeders where immiscible magmatic sulfides may have formed. correlating between Werner depth estimations and seismic data, particularly in pinpointing fault zones. These zones act as critical conduits for fluid migration from the mantle to the surface, playing a vital role in both tectonic interpretation and mineralexploration4. Despite the absence of magmatic sulfide mineralization and magmatic breccias, there is untested potential within the basin stratigraphy for the development of intrusions which have a magnetic and density signal, possibly in association with a structural break as well as a diagnostic electromagnetic signal from highly conductive sulfide mineralization. However, the geological complexity, including structural deformation and metamorphic overprints, poses significant challenges in locating economically viable deposits. The study underscores the importance of advanced exploration techniques and multidisciplinary data integration to improve discovery success rates. Ultimately, this work contributes valuable insights into the Ni-mineral prospectivity of the P-V Picritic Sill in western margin of Cuddapah Basin and highlights its potential as a frontier region to relook for nickel exploration in India.

How to cite: Sunder Raju, P. V.: Fingerprints of Nickel Exploration in the Pulivendla-Vemula (P-V) sill in Cuddapah Basin:Geological Complexity and Discovery Potential, EGU General Assembly 2026, Vienna, Austria, 3–8 May 2026, EGU26-1384, https://doi.org/10.5194/egusphere-egu26-1384, 2026.

EGU26-2105 | ECS | Posters virtual | VPS19

Fracture modeling of the hydrocarbon reservoir using geostatistical and neural network methods in the SW Iran Oilfield  

Zahra Tajmir Riahi, Ali Faghih, Bahman Soleimany, Khalil Sarkarinejad, and Gholam Reza Payrovian

Abstract

Fracture characterization and modeling are essential for hydrocarbon exploration and enhanced production. To model the fracture network in the Asmari reservoir of the Rag-e-Sefid Oilfield (SW Iran), this research characterizes fracture intensity using well, fracture driver, and fracture controller data. First, these data are analyzed to estimate fracture intensity. Then, fracture intensity is modeled using geostatistical methods. The geostatistical outputs are compared and calibrated based on the structural setting of the study area and the fracture indicator. Finally, selected fracture intensity data are integrated into a single model using an artificial neural network, resulting in a comprehensive fracture intensity model for the Asmari reservoir of the Rag-e-Sefid Oilfield. The results show that fracture intensity increases near the Rag-e-Sefid and Nourooz-Hendijan-Izeh Faults and in the fold forelimb and crest. The highest fracture intensity in the Asmari reservoir is observed at the intersection of structures with the N-S Arabian trend and the NW-SE Zagros trend, where the fold axis has rotated. Generally, the northwestern part of the Rag-e-Sefid anticline has higher fracture intensity than the southeastern part. The high fracture intensity in the northwest part of the Rag-e-Sefid Oilfield is related to inversion tectonics, multi-stage reactivation along pre-existing basement structures, and an older deformation history in this area compared to its southeastern part. The Asmari reservoir in the NW part of the Rag-e-Sefid anticline contains a greater share of oil and gas in its hydrocarbon traps than the SE part. Moreover, the results of this study indicate that the simultaneous use of different data and the integration of geostatistical and artificial neural network methods can effectively predict fracture distribution in hydrocarbon reservoirs and be used as a suitable technique for fracture modeling in natural oil and gas fields. This research suggests that artificial intelligence and quantum computing techniques provide efficient solutions for characterizing and modeling the entire scale of geological fractures in hydrocarbon reservoirs.

Keywords: Fracture modeling, Geostatistical and neural network methods, Asmari reservoir, Rag-e-Sefid Oilfield, SW Iran

How to cite: Tajmir Riahi, Z., Faghih, A., Soleimany, B., Sarkarinejad, K., and Payrovian, G. R.: Fracture modeling of the hydrocarbon reservoir using geostatistical and neural network methods in the SW Iran Oilfield , EGU General Assembly 2026, Vienna, Austria, 3–8 May 2026, EGU26-2105, https://doi.org/10.5194/egusphere-egu26-2105, 2026.

EGU26-3742 | ECS | Posters virtual | VPS19

Designing cost-effective storage portfolios in decarbonizing power systems: a deficit stretch approach 

Anasuya Gangopadhyay and Ashwin K Seshadri

High wind and solar penetrations would make bulk energy storage increasingly important for electricity system reliability. We introduce a deficit stretch framework that relates the temporal structure of generation shortfalls to optimal storage configurations in a decarbonizing grid and links the intensity, duration, and frequency of deficits to storage needs and cost–reliability trade-offs. Using Karnataka (India) as a case study, we simulate wind–solar–demand scenarios to examine (i) drivers of deficit-stretch emergence, (ii) which wind–solar–storage portfolios align with available storage technologies, and (iii) how these choices map onto Pareto frontiers of cost versus reliability. We cluster deficit stretches to identify characteristic storage durations (across hours to seasons) enabling a direct mapping from variability patterns to feasible technology options. Results indicate that solar share largely controls the deficit stretch duration spectrum. The proposed framework offers an empirical approach leading from analysis of renewables variability to consideration of bulk energy storage portfolios amidst cost–reliability tradeoffs and is extendable to other regions as well.

How to cite: Gangopadhyay, A. and K Seshadri, A.: Designing cost-effective storage portfolios in decarbonizing power systems: a deficit stretch approach, EGU General Assembly 2026, Vienna, Austria, 3–8 May 2026, EGU26-3742, https://doi.org/10.5194/egusphere-egu26-3742, 2026.

EGU26-4291 | Posters virtual | VPS19

Coal fire & Mine water: two major post-mining issues 

Qiang Zeng

Coal is an important major source of energy for sustainable development and growth of economy around the world. Coal fire and mine water issues are two aspects of mining-induced safety and eco-environmental issues which occurred during and after mining. In the present presentation, the author illustrates the understanding of these two issues by employing the theoretic analysis, the experimental simulation, the numerical simulation, and the field investigation, etc. Results from this research show that the rational scientific mining methods and technologies can be used to reduce the occurrence and influence of these two phenomena which leads to the possible sustainable exploitation of coal resource.

How to cite: Zeng, Q.: Coal fire & Mine water: two major post-mining issues, EGU General Assembly 2026, Vienna, Austria, 3–8 May 2026, EGU26-4291, https://doi.org/10.5194/egusphere-egu26-4291, 2026.

Investment decisions for offshore wind-to-hydrogen (W2H) projects are often framed as “better forecasts reduce uncertainty,” but it is less clear when higher-fidelity scenario modelling meaningfully changes a financing decision versus merely narrowing outcome ranges. We address this question using a decision-coupled evaluation that scores forecast skill on propagated economic distributions and links it directly to financeability metrics.

Using 61 years of ERA5 wind data at 150 m hub height, we generate 1000 synthetic 23-year hourly wind scenarios per method and propagate them through a techno-economic model of a 375 MW offshore W2H project (development in 2024, operation in 2026-2050, base hydrogen price €8/kg, discount rate 7%). We compare three probabilistic scenario generators: historical bootstrapping, parametric Weibull fitting, and a calibrated probabilistic long short-term memory (LSTM) sequence model (used as a benchmark rather than architectural novelty).

We evaluate (a) continuous ranked probability score (CRPS) of levelized cost of hydrogen (LCOH), net present value (NPV), and internal rate of return (IRR), (b) decision bandwidths W(Y) = P95(Y) – P5(Y), (c) threshold-crossing probabilities Pr(NPV>0) and Pr(IRR>10%), and (d) a local elasticity E(Y) = dW(Y)/dCRPS that maps marginal forecast skill to risk-band compression. Finally, we run a financing price sweep to identify the minimum hydrogen offtake price that achieves a 90% probability target for NPV > 0 and the joint target NPV > 0, IRR > 10%.

Results show that improved scenario modelling can substantially reduce economic distribution error and compress risk bands: the LSTM lowers CRPS by 30% for LCOH and NPV and by 25% for IRR versus the best bootstrap/Weibull configurations. However, under base assumptions the financeability thresholds are nearly invariant across methods: the 90%-target required hydrogen price is €7.76-7.78/kg for Pr(NPV>0) and €9.16-9.18/kg for Pr(NPV>0 and IRR>10%), with cross-method spread below €0.02/kg indicates a threshold-saturated regime where better modelling mainly narrows uncertainty rather than shifting the decision boundary. Sensitivity analysis indicates decision value is highest in moderate-margin regimes (roughly €5.5-8/kg) and diminishes at high profitability where models converge.

This work reframes “better scenarios” into an investment-relevant diagnostic: use elasticity and threshold behaviour to identify when modelling improvements will shift financeability versus only compress risk bands, supporting more defensible screening and policy design.

How to cite: Aditama, P. and Zia, A. W.: When Does Better Scenario Modelling Improve Financeability? A Decision-Coupled Evaluation for Offshore Wind-to-Hydrogen, EGU General Assembly 2026, Vienna, Austria, 3–8 May 2026, EGU26-5058, https://doi.org/10.5194/egusphere-egu26-5058, 2026.

EGU26-6063 | ECS | Posters virtual | VPS19

Lifecycle Traceability System for Metal Recovery from Renewable Energy Waste in South Korea 

Junkyo Kim and Hyeong-Dong Park

South Korea depends largely on imports to secure its critical minerals. In the case of lithium, 66% of the demand is imported from China and 31% from Chile, while the price of Lithium continues to rise with the growth of the battery market. By the end of 2025, copper prices are expected to continue rising due to the supply crisis, intensifying the competition for securing resources. To address this international resource-securing crisis, this research focuses on the possibility of recovering metals from waste resources generated by domestic renewable energy facilities.

South Korea operates four Future Waste Resources Base Collection Centers to collect waste batteries from electric vehicles(EV), waste solar panel and wind turbine, conducting performance assessment and resale. However, a detailed analysis of whether waste batteries and panels are reused or recycled is not traceable, thereby limiting the accurate measurement of resource-circulation efficiency.

Although the recovery rates of waste batteries is high(about 14,000 units in 2024), but it is not traceable whether they are reused for energy storage systems(ESS) or recycled for resource recovery. To address this limitation, since 2025, the introduction of the Battery Lifecycle Management System has enabled full lifecycle tracing of EV batteries, whereas batteries from other sources remain outside the tracking system.

Since 2023, the implementation of the Extended Producer Responsibility system for waste solar panels has aimed to enhance resource-circulation efficiency. But the actual quantities recycled, reused, or simply discarded remain unclear, even if the projected amount of waste solar panels in 2025 is 14,596 tons according to the Korea Environment Institute.

While attention is often given to the recycling of wind turbine blades, wind power facilities also possess significant potential for metal resource recovery, as they contain approximately 4.3 tons of copper per MW in onshore installations and 9.6 tons per MW in offshore installations. In particular, a recovery potential of approximately 1,870 tons of copper is estimated from about 483MW of wind power facilities that are expected to reach the end of their life cycle in the early 2030s. Nevertheless, the recycling status of components other than nacelles and blades, such as towers and cables, remains entirely unverified.

Therefore, the introduction of a full-lifecycle tracing system for renewable energy waste resources is proposed. Similar to the Battery Lifecycle Management System, identification numbers are assigned to solar panels and wind power facilities so that the entire process from production to disposal and recycling can be traced, thereby visualizing the domestic circulation path of metal resources and providing a basis for enhancing the actual recycling rate.

How to cite: Kim, J. and Park, H.-D.: Lifecycle Traceability System for Metal Recovery from Renewable Energy Waste in South Korea, EGU General Assembly 2026, Vienna, Austria, 3–8 May 2026, EGU26-6063, https://doi.org/10.5194/egusphere-egu26-6063, 2026.

EGU26-6552 | ECS | Posters virtual | VPS19

Assessing future wind energy resources in the Iberian Peninsula under climate change scenarios 

Alonso García-Miguel, Carlos Calvo Sancho, Javier Díaz Fernández, Juan Jesús González Alemán, Mauricio López Reyes, Pedro Bolgiani, María Luisa Martín Pérez, and María Yolanda Luna

This study evaluates annual changes in wind power density (WPD) in a domain covering the Iberian Peninsula and adjacent areas using several CMIP6 global climate models and the ensemble mean under historical (1961-1990) and SSP5-8.5 scenarios for two-time horizons—near future (2041–2070) and far future (2071–2100).

Results from the ensemble indicate a robust and generalized decrease in WPD throughout the 21st century. The most pronounced declines occur in windows starting mid-century (2050–2055), with reductions of about -90 W m-2 century-1 persisting for up to 40-year periods. Short-lived positive trends (≈ 50 W m-2 century-1) appear around 2030 and 2045, suggesting temporary peaks before a marked decline (≈ -100 W m-2 century-1) in later decades. Comparisons between future and historical periods reveal strong WPD decreases (-70 W m-2), mainly offshore, particularly in far-future scenarios.

Inland areas may experience annual mean WPD values falling below the cut-in threshold (3 m/s, ≈ 15.5 W m-2), rendering some older wind farms economically and technically unviable. Offshore regions, despite current technological priorities, face substantial WPD reductions (up to -60 W m-2), while inland declines are significant in northeastern Spain, where major wind farms are located. These projected reductions—especially offshore (10–20%)—could challenge the financial viability of future wind energy projects.

How to cite: García-Miguel, A., Calvo Sancho, C., Díaz Fernández, J., González Alemán, J. J., López Reyes, M., Bolgiani, P., Martín Pérez, M. L., and Luna, M. Y.: Assessing future wind energy resources in the Iberian Peninsula under climate change scenarios, EGU General Assembly 2026, Vienna, Austria, 3–8 May 2026, EGU26-6552, https://doi.org/10.5194/egusphere-egu26-6552, 2026.

The contribution proposes a feasibility study for a pumped‑storage hydropower (PSH) scheme in the wider Ptolemaida lignite basin in Western Macedonia, Greece, aiming to repurpose post‑mining landscapes as multi‑functional water and energy infrastructures that support the rapid penetration of renewables into the national power system. The work is particularly relevant to the EGU community as it lies at the interface of fluvial and hydraulic engineering, energy transition, and post‑mining land and water management in a coal‑dependent region undergoing accelerated decarbonisation.
 
The study will develop and assess alternative PSH configurations using existing and planned mine pits and overburden areas as upper and lower reservoirs, constrained by local hydro‑geomorphological, geotechnical and hydrogeological conditions. A coupled hydrological–hydraulic framework will be applied to (i) quantify available storage volumes and head differences, (ii) evaluate seepage, slope stability and embankment safety under cyclic operation, and (iii) explore interactions with surface and groundwater systems at seasonal to multi‑annual time scales.
 
On the energy‑system side, the project will simulate PSH operation under different scenarios of wind and solar deployment in Western Macedonia and the wider Greek interconnected system, using high‑resolution time series of load and variable renewable generation. Key performance indicators will include round‑trip efficiency, contribution to peak‑shaving and intra‑day balancing, provision of frequency and reserve services, and impacts on curtailment of renewables during high‑production, low‑demand periods.
 
The economic feasibility assessment will combine capital and operational expenditure estimates for mine‑based PSH schemes with projected revenue streams from energy arbitrage and ancillary services, within evolving Greek and EU regulatory frameworks for storage and just transition financing. Special emphasis will be placed on uncertainty analysis with respect to future market prices, policy instruments, and potential support mechanisms for storage in former lignite regions, in line with ongoing decarbonisation and regional development strategies.
 
From an environmental and socio‑hydrological perspective, the study will investigate how PSH reservoirs can be integrated into long‑term mine‑closure and landscape‑rehabilitation plans, including water‑quality evolution, sediment management, and the creation of new aquatic and riparian habitats. The results are expected to demonstrate pathways by which PSH in Ptolemaida can simultaneously deliver grid‑scale flexibility, reduce environmental legacies of lignite mining, and support regional socio‑economic resilience, offering a transferable case study for coal regions in transition across Europe.

How to cite: Touloumenidou, L.: Pumped‑Storage Hydropower in a Post‑Mining Landscapes: A Feasibility Study for Repurposing the Ptolemaida Lignite Basin in Western Macedonia, Greece, EGU General Assembly 2026, Vienna, Austria, 3–8 May 2026, EGU26-6952, https://doi.org/10.5194/egusphere-egu26-6952, 2026.

EGU26-7454 | Posters virtual | VPS19

Spatiotemporal Patterns of Ecological Vulnerability in Malta: An Empirical Analysis Using the PVOR Model 

Lin Wang, Jichang Chi, and Xiao Xiao

Accurate assessment of ecological vulnerability in island systems under natural and anthropogenic pressures is crucial for ecosystem stability and sustainable development. Constructing an adaptive and scientific framework for evaluating ecological vulnerability in island regions remains a key challenge. This study introduces a novel Pressure–Vigor–Organization–Resilience (PVOR) model for assessing ecological vulnerability, applied to the main island of Malta. A combined weighting approach using game theory was used to determine composite indicator weights, while multi-source data (e.g., remote sensing and geospatial data) were integrated to investigate the long-term spatiotemporal evolution of ecological vulnerability from 2000 to 2020 and its driving factors.

The results show that: (1) Over 20 years, the ecological vulnerability index (EVI) of Malta fluctuated but declined from 0.65 to 0.58. From 2000 to 2015, vulnerable areas were mainly located in the eastern built-up zones. By 2020, the area of highly vulnerable zones decreased by 86% due to ecological protection policies and the COVID-19 pandemic, with minor increases in vulnerability (less than 5 km²) along the southwestern coastline. (2) Ecological vulnerability exhibited significant spatial clustering (global Moran’s I > 0.80, p < 0.01), with high-value clusters in the east and low-value clusters in the west and north. (3) Key driving factors include habitat quality, landscape fragmentation, population density, and development intensity, with interaction effects being stronger than individual factors. (4) Based on both static and dynamic vulnerability assessments, ecological zoning was defined, and targeted management strategies were proposed.

This study provides a scientific foundation for ecological restoration and sustainable development in Malta, offering a transferable framework for other island systems.

How to cite: Wang, L., Chi, J., and Xiao, X.: Spatiotemporal Patterns of Ecological Vulnerability in Malta: An Empirical Analysis Using the PVOR Model, EGU General Assembly 2026, Vienna, Austria, 3–8 May 2026, EGU26-7454, https://doi.org/10.5194/egusphere-egu26-7454, 2026.

EGU26-8851 | ECS | Posters virtual | VPS19

Unfolding the rise in cooling demand from residential buildings sector in India 

Divya Davis and Nandita Saraf

India’s buildings sector contributed to about 36% of total electricity consumption, with residential buildings comprising nearly 79% of this demand in 2025 [1]. Within residential electricity use, cooling alone accounted for about 31% of the consumption and has seen a rise by 50% over the past decade [1]. India has one of the highest cooling gaps in the world primarily driven by population growth and affordability constraints [2]. India energy security scenario (IESS) 2047 suggests that, with rising per capita income, the residential air conditioner ownership expected to increase by 1.3 folds in the next decade [3]. India Cooling Action Plan has projected that cooling electricity consumption will be doubled by 2038, however passive design strategies on building envelop can reduce the consumption by 15% [4]. V. Chaturvedi et al., (2020) and R. Khosla et al., (2021) suggested that along with passive design interventions, promoting consumer awareness also plays a crucial role in reducing the cooling energy demand [5, 6]. Despite rising cooling demand, the combined quantitative influence of consumer behaviour, climate, technology, and building characteristics on cooling electricity demand in India remains insufficiently explored. 

To address this research gap, the authors have developed a bottom-up generic model to estimate the residential cooling energy demand based on variation in ambient temperature, appliance ownership, and relative humidity. The model is applied to India as a case study and with parameters calibrated using context-specific empirical data. Cooling degree days (CDD) serve as a metric to quantify ambient temperature rise relative to a base temperature of 24ºC. The analysis estimates the sensitivity of cooling demand to ambient temperature variations, expressed as a percentage increase in electricity consumption per degree rise. By varying the base temperature from 18ºC to 26ºC, model also captures the influence of consumer behaviour on cooling energy demand. The developed model is soft linked to SAFARI, a system dynamics model, developed by Centre for Science, Technology, and Policy (CSTEP) to design low carbon pathways for India. SAFARI explores the interlinkages between demand sectors such as buildings, transport, agriculture, forest and other land use (AFOLU), industry and supply sector, i.e., power. Soft-linking will enable to generate scenarios of different combinations of climatic conditions, behavioural aspects, varying appliance penetration rate, low carbon interventions in residential building sector such as, cool roof, wall insulation, alternate construction materials etcThese scenarios will allow understand the potential possibilities of reducing the energy demand for the country and can inform policy making on demand side management measures. 

 References: 

1. CSTEP. https://safari.cstep.in/safari/ 

2. Debnath, B. K. https://doi.org/10.3390/buildings10040078 

3. NITI Aayog. https://iess.gov.in 

4. Government of India. India-Cooling-Action-Plan.pdf  

5. Chaturvedi, V. https://doi.org/10.1016/j.heliyon.2020.e05749 

6. Khosla, R. https://doi.org/10.1088/1748-9326/abecbc 

How to cite: Davis, D. and Saraf, N.: Unfolding the rise in cooling demand from residential buildings sector in India, EGU General Assembly 2026, Vienna, Austria, 3–8 May 2026, EGU26-8851, https://doi.org/10.5194/egusphere-egu26-8851, 2026.

EGU26-9067 | ECS | Posters virtual | VPS19

Safety and Sustainability in Artisanal and Small-Scale Mining Operations in Mozambique 

Luana Victorina Sá dos Santos, Maurício Ernesto Guiliche, and João Alberto Mugabe

Artisanal and small-scale mining (ASM) is an important source of livelihood in Mozambique, directly involving over 100,000 people, largely through informal and poorly regulated operations (Delve, 2020). ASM activities are concentrated in provinces with high mineral potential, including Manica, Tete, Zambézia, Niassa, Nampula and Cabo Delgado (Mapurango, 2014), and primarily involve the extraction of gold, precious and semi-precious stones, as well as construction materials. Despite its socio-economic relevance, the sector is characterised by weak technical organisation, limited regulatory integration and widespread informality.

This study examines the main safety and sustainability challenges associated with ASM in Mozambique, with particular emphasis on occupational health and safety and environmental management. The methodological approach is based on a review of secondary literature and documentary analysis of existing legal and policy frameworks. The analysis indicates that high levels of informality contribute to unsafe working conditions, inadequate use of personal protective equipment, frequent occupational accidents and significant environmental degradation, including soil and water contamination.

Recent regulatory interventions, such as the suspension of mining licences in Manica Province in October 2025 due to uncontrolled discharge of mining effluents, highlight the urgency of strengthening environmental governance and enforcement mechanisms. The results suggest that the adoption of sustainable mining principles—focused on risk management, environmental protection, decent working conditions and long-term economic viability—can substantially improve the performance of ASM operations. Practical measures include basic technical training, increased awareness campaigns on occupational health and safety, gradual adoption of appropriate technologies and progressive formalization supported by effective monitoring.

In conclusion, enhancing safety and sustainability in ASM is essential not only to reduce occupational and environmental risks but also to ensure that small-scale mining continues to positively contribute to local communities and the national economy.

How to cite: dos Santos, L. V. S., Guiliche, M. E., and Mugabe, J. A.: Safety and Sustainability in Artisanal and Small-Scale Mining Operations in Mozambique, EGU General Assembly 2026, Vienna, Austria, 3–8 May 2026, EGU26-9067, https://doi.org/10.5194/egusphere-egu26-9067, 2026.

EGU26-9664 | Posters virtual | VPS19

CO2 storage potential of contourite channels – Laboratory studies on geochemical reactions 

Edgar Berrezueta, Timea Kovács, Berta Ordóñez-Casado, Estefanía LLave, Beatriz Benjumea, Paula Canteli, Jose Mediato, Javier Hernández-Molina, and Wouter de Weger

Contourite sandstones exhibit high lateral continuity, moderate to high porosity (depending on diagenetic overprint), and are typically overlain by fine-grained marls, making them promising candidates for subsurface CO₂ storage. This study investigates contourite channel deposits of late Miocene age that outcrop in the Rifian Corridor (northern Morocco). A fine-grained, bioclastic–siliciclastic sandstone and a medium- to coarse-grained sand representing potential reservoir materials were selected for controlled CO₂–rock interaction experiments.

CO₂ exposure tests were conducted in a batch reactor at 8 MPa and 40 °C for 30 days. Textural and pore-space changes were assessed through comparative SEM imaging, and bulk-rock and brine chemical compositions were analysed before and after exposure. The first reservoir sample experienced only minor dissolution features and limited particle detachment. In contrast, the fine-grained reservoir candidate underwent pronounced physical disintegration during CO₂ exposure. Chemical alteration was modest in both lithologies, expressed mainly as slight increases in dissolved ion concentrations in the brines.

These results highlight contrasting mechanical responses of contourite channel facies to CO₂ exposure and underscore the importance of lithological variability when evaluating contourite systems for CO₂ storage applications.

This research was conducted within the ALGEMAR Project (Ref. PID2021-123825OB-I00), funded by the Plan Nacional of Spanish Ministry of Science and Innovation

How to cite: Berrezueta, E., Kovács, T., Ordóñez-Casado, B., LLave, E., Benjumea, B., Canteli, P., Mediato, J., Hernández-Molina, J., and de Weger, W.: CO2 storage potential of contourite channels – Laboratory studies on geochemical reactions, EGU General Assembly 2026, Vienna, Austria, 3–8 May 2026, EGU26-9664, https://doi.org/10.5194/egusphere-egu26-9664, 2026.

EGU26-10232 | Posters virtual | VPS19

Carbonate-rich Sandstone Reactivity to Supercritical CO₂ and Brine: A Case Study from the Guadalquivir Basin, Spain 

Berta Ordóñez-Casado, Santiago Ledesma, José Mediato, Timea Kóvacs, Darío Chinchilla, Luis González-Menéndez, and Edgar Berrezueta

This study investigates mineralogical and geochemical alterations at the matrix scale in carbonate-rich sandstone exposed to supercritical CO₂ (SC-CO₂) and formation brine. Batch experiments were conducted under reservoir conditions (≈8 MPa, 333ºK) to simulate the early stages of CO₂ injection in a deep sedimentary formation of the Guadalquivir Basin (southern Spain).

Rock samples were analysed before and after exposure using scanning electron microscopy (SEM) with microanalysis, X-ray fluorescence (XRF), and X-ray diffraction (XRD). Complementarily, chemical analyses of the brine before and after the experiments were performed. The interaction with CO₂-rich brine caused a marked pH decrease, leading to carbonate dissolution and minor alteration of clay minerals. The Ca concentration in the brine increased by about 300%, confirms active carbonate dissolution driven by CO₂-induced acidification. These reactions, together with particle detachment and micro-scale pore modification, indicate dynamic fluid-rock interactions within the calcarenite matrix.

The results show up that the studied reservoir rocks maintain overall structural integrity under CO₂-rich conditions while undergoing measurable geochemical alteration. This experimental framework provides a reproducible approach to evaluate mineral reactivity and textural evolution in carbonate-rich sandstone reservoirs, offering relevant insights to the design and assessment of CO₂ sequestration projects in comparable geological settings.

This research was conducted within the UNDERGY Project (Ref. MIG-20211018), funded by the Programa Misiones CDTI 2021 of the Spanish Ministry of Science and Innovation and the Next Generation EU Fund.

How to cite: Ordóñez-Casado, B., Ledesma, S., Mediato, J., Kóvacs, T., Chinchilla, D., González-Menéndez, L., and Berrezueta, E.: Carbonate-rich Sandstone Reactivity to Supercritical CO₂ and Brine: A Case Study from the Guadalquivir Basin, Spain, EGU General Assembly 2026, Vienna, Austria, 3–8 May 2026, EGU26-10232, https://doi.org/10.5194/egusphere-egu26-10232, 2026.

EGU26-14485 | ECS | Posters virtual | VPS19

Integrating Micro-Scale Urban Geometry with Macro-Scale Climate Projections to Improve Rooftop Photovoltaic Potential Assessment: An Application to Selected Urban Areas in the Southeastern Mediterranean 

Natalia Agazarian, Constantinos Cartalis, Konstantinos Philippopoulos, and Ilias Agathangelidis

This study presents a comprehensive methodological framework that integrates micro-scale urban geometry with macro-scale climate projections to improve the assessment of rooftop photovoltaic (PV) potential in urban environments. High-precision solar resource estimation is achieved through the use of very high–resolution Digital Surface Models (DSMs; 0.8 m) within the Solar Energy on Building Envelopes (SEBE) model, enabling detailed simulation of shading effects in dense urban fabrics.

Historical and present-day atmospheric inputs—including surface solar radiation, cloud cover, and aerosol optical depth—are obtained from the Copernicus Atmosphere Monitoring Service (CAMS) and combined with meteorological variables from ERA5-Land. Future rooftop PV potential is projected using a multi-model ensemble of CMIP6 climate simulations under the SSP2–4.5 and SSP5–8.5 emission scenarios. Statistical downscaling techniques are applied to translate large-scale climate projections to local urban conditions.

In addition, the study evaluates PV system performance during specific atmospheric episodes, quantifying the effects of dust intrusions and compound events—defined as the co-occurrence of high temperatures and elevated dust concentrations—on energy yield. Finally, cluster analysis is performed on the urban building stock of selected southeastern Mediterranean cities using key performance indicators, including received solar radiation, total energy yield, rooftop area, and building height.

The results demonstrate that integrating micro-scale urban morphology with macro-scale climate projections is critical for accurately estimating rooftop PV potential, particularly in regions characterized by complex urban structures and climate-sensitive atmospheric processes.

How to cite: Agazarian, N., Cartalis, C., Philippopoulos, K., and Agathangelidis, I.: Integrating Micro-Scale Urban Geometry with Macro-Scale Climate Projections to Improve Rooftop Photovoltaic Potential Assessment: An Application to Selected Urban Areas in the Southeastern Mediterranean, EGU General Assembly 2026, Vienna, Austria, 3–8 May 2026, EGU26-14485, https://doi.org/10.5194/egusphere-egu26-14485, 2026.

EGU26-16152 | ECS | Posters virtual | VPS19

 4D Multi-Physics Forward Modelling for CO2 Storage Monitoring in the Hewett Field 

Jing Yang and Mads Huuse

Long-term geological CO2 sequestration relies on quantitative time-lapse geophysical monitoring to assess storage integrity. In this study, we present a multi-physics forward modelling framework for 4D monitoring of CO2 storage and demonstrate its application through a case study in the Hewett Field, a depleted gas field in the Southern North Sea. The case study focuses on a 30-year CO2 injection scenario into the Bunter sandstone. Seismic, controlled-source electromagnetic (CSEM) and gravity methods are combined within this multi-physics framework to provide complementary information.

The modelling workflow includes geological modelling, CO2 injection modelling, rock-physics modelling, and 4D geophysical forward simulations. The modelling starts from a static geological model describing the structural framework of the reservoir. This model is used in the dynamic CO2 injection simulations, which predict the CO2 saturation and pressure evolution during CO2 injection and post-injection migration. The resulting dynamic properties are converted into velocity, resistivity and density changes through rock-physics modelling. Based on these physical properties, 4D geophysical forward modelling is performed for seismic, CSEM and gravity methods to simulate time-lapse geophysical responses associated with CO2 plume development.

By comparing the simulated time-lapse responses of seismic, CSEM and gravity data, the integrated 4D modelling framework uses the Hewett Field as a case study to develop and test a site-specific monitoring strategy.

How to cite: Yang, J. and Huuse, M.:  4D Multi-Physics Forward Modelling for CO2 Storage Monitoring in the Hewett Field, EGU General Assembly 2026, Vienna, Austria, 3–8 May 2026, EGU26-16152, https://doi.org/10.5194/egusphere-egu26-16152, 2026.

Groundwater-induced subsurface collapse presents a critical geotechnical hazard in karst terrains, which poses heavy risks to global public safety and infrastructure. Despite the substantial economic impact, predicting these failures remains challenging due to sparse subsurface monitoring and the difficulty of integrating indirect, multi-modal satellite data into traditional models. To address the challenge of low observability, we present a physics-informed neural network (PINN)-based digital twin for simulating coupled hydro-mechanical processes. The framework integrates NASA GPM (IMERG) precipitation data and Sentinel-1 InSAR surface deformation measurements to constrain subsurface dynamics. Implemented in the West-Central Florida Karst Belt, the model represents a three-dimensional domain of unconsolidated overburden overlying a weathered limestone aquifer. Subsurface dynamics are governed by transient Darcy flow and an effective stress relationship, while progressive material weakening is captured through a continuous damage variable, d, which evolves via stress redistribution and pore-pressure diffusion. Through minimizing the residuals of these governing equations, the PINN identifies the start of collapse, defined as the point where localized damage exceeds a critical threshold. Our results indicate that the digital twin produces physically consistent fields with 25–30% lower error in pore pressure and damage predictions compared to simulations that are uncoupled. Predicted collapse initiation times, Tc, remained within 18–23% of benchmark solutions, capturing time-accelerated failure during intense recharge events. Sensitivity analysis reveals that hydraulic conductivity, K, accounts for over 63% of damage variance, highlighting the model's physical interpretability. This framework provides a scalable approach for real-time hazard assessment in data-poor karst regions globally.

How to cite: Korada, S. and Liu, W.: PINN-Based Digital Twins for Modeling Groundwater-Induced Subsurface Collapse under Low-Observability Hydro-Mechanical Conditions, EGU General Assembly 2026, Vienna, Austria, 3–8 May 2026, EGU26-16204, https://doi.org/10.5194/egusphere-egu26-16204, 2026.

EGU26-18202 | ECS | Posters virtual | VPS19

Material Selection for Vortex-Induced Vibration Energy Harvesting in Water Systems: Environmental and Performance Insights from the Verona Case Study in Italy 

Monica Siviero, Bjarnhéðinn Guðlaugsson, Francesco Nascimben, David Christian Finger, Alberto Benato, and Giovanna Cavazzini

Wastewater treatment plants are essential environmental infrastructures that operate continuously and require considerable electrical energy, while simultaneously conveying persistent flows that dissipate low-grade hydraulic energy. Recovering even a fraction of this overlooked resource could support decarbonisation targets and provide autonomous power for environmental monitoring and digital water services, without additional land take or large hydropower installations. Within the Horizon Europe project H-HOPE – Hidden Hydro Oscillating Power for Europe – this study investigates how the selection of structural materials affects the performance of vortex-induced vibration energy harvesters (VIV-EH) deployed in controlled water environments. Rather than optimising device geometry or control strategies, the analysis focuses on how broad material classes influence feasibility, energy potential, and environmental suitability when integrating harvesters into existing wastewater infrastructure. Operational records from a municipal wastewater treatment plant in northern Italy were analysed. A validated one-dimensional modelling framework was used as a comparative tool to estimate annual energy production for harvesters manufactured from widely available metallic and composite materials under realistic operating conditions.

Results show a consistent trend: lighter materials with favourable stiffness-to-mass ratios generate larger oscillation amplitudes and substantially higher harvested energy. Fibre-reinforced composites achieve the highest performance, with an estimated annual production of approximately 800–875 kWh/year for the specific case study. Aluminium alloys produce slightly lower yields (≈800 kWh/year) while retaining advantages in recyclability and manufacturability. In contrast, high-density metals such as structural and stainless steel, typically yield 450–480 kWh/year, highlighting how increased mass suppresses the vortex-induced response. These differences arise solely from material choice, without modifying hydraulic conditions, device geometry, or plant operation.

From a renewable-energy perspective, these results indicate that material-driven design is a practical lever for scaling small, autonomous generators across water networks, providing reliable power for sensors, process control and digital water management. Because devices exploit existing hydraulic infrastructure, they can be replicated modularly and integrated alongside other renewables as part of distributed energy portfolios, supporting resilience and local self-sufficiency. However, performance advantages must be considered alongside environmental trade-offs. Composites show limited recyclability and higher embodied energy compared with metals such as aluminium and stainless steel, which favour circularity but offer lower energy conversion. The study relies on a simplified modelling framework and a single representative site, broader validation under different hydraulic regimes and long-term material ageing will require pilot-scale deployment. Despite this, the comparative trends provide robust guidance for design and prioritisation.

Overall, the study demonstrates that targeted material selection can unlock “hidden hydropower” within wastewater systems, delivering incremental yet scalable renewable generation aligned with European decarbonisation goals while enhancing the sustainability and reliability of essential water services.

How to cite: Siviero, M., Guðlaugsson, B., Nascimben, F., Finger, D. C., Benato, A., and Cavazzini, G.: Material Selection for Vortex-Induced Vibration Energy Harvesting in Water Systems: Environmental and Performance Insights from the Verona Case Study in Italy, EGU General Assembly 2026, Vienna, Austria, 3–8 May 2026, EGU26-18202, https://doi.org/10.5194/egusphere-egu26-18202, 2026.

EGU26-19216 | ECS | Posters virtual | VPS19

Selective recovery of copper from mine tailings using a green leaching agent 

Gabriele Baldassarre, Vittorio Zasa Courtial, Rossana Bellopede, and Paola Marini

The growing demand for Critical and Strategic Raw Materials (CRMs, SRMs) and the limited availability of primary resources in Europe have renewed regulatory and scientific interest in mine waste and tailings as secondary raw material sources (European Critical Raw Materials Act 2023; Hool et al. 2024). Accordingly, efficient and environmentally sustainable extraction technologies are necessary to minimize both environmental impact and processing costs (Whitworth et al. 2022). Among emerging solutions to conventional acidic leaching, glycine has been attracting attention as a non-toxic and biodegradable amino acid capable of forming stable complexes with calcophile elements under alkaline conditions and low temperatures, enabling low-cost, possible industrial applications for recovering precious and critical metals from mine waste and tailings (O’Connor et al. 2018; Barragán-Mantilla et al. 2024; Eksteen et al. 2018). This study investigated the application of glycine leaching as a green chemical approach for the recovery of copper from fine-grained historical tailings samples from the Fenice–Capanne mine, Tuscany, Italy.

Historical tailings samples were preliminarily characterised in terms of granulometry, geochemical and mineralogical composition using multiple methodologies, such as ICP-MS, HH-XRF, SEM-EDS and SEM-MLA for the definition of metal grades and the identification of metal-bearing minerals. Batch leaching tests were conducted using a glycine solution under controlled conditions, including alkaline pH, a constant liquid-to-solid ratio, and progressively increasing leaching times. The performance of glycine as a lixiviant was evaluated in terms of metal extraction efficiency and selectivity using HH-XRF on solid residues and ICP-OES on leaching liquors. Particular focus was addressed on Cu and associated Zn extraction. As a term of comparison, the same samples were leached using sulphuric acid leaching.

Preliminary results indicated that glycine leaching enabled the selective extraction of Cu and minor Zn while limiting the dissolution of Fe, and competitive recovery rates when compared to traditional sulphuric acid leaching. It highlighted its potential as an environmentally friendly leaching agent. The outcomes of this study could contribute to the assessment of sustainable options for the recovery of CRMs and SRMs from mine tailings within a sustainable and circular economy approach.

How to cite: Baldassarre, G., Zasa Courtial, V., Bellopede, R., and Marini, P.: Selective recovery of copper from mine tailings using a green leaching agent, EGU General Assembly 2026, Vienna, Austria, 3–8 May 2026, EGU26-19216, https://doi.org/10.5194/egusphere-egu26-19216, 2026.

EGU26-19295 | Posters virtual | VPS19

Assessing and Designing a Pilot Aquathermal System on the TU Delft Campus 

Michiel Fremouw, Alexis Koulidis, and Martin Bloemendal

An aquathermal energy system is a sustainable heating and cooling technology for buildings by utilizing low-grade thermal energy from water sources. This contribution presents a full scale pilot at the TU Delft campus that investigates and show-cases the potential of a campus pond to supply thermal energy to the Firma van Buiten (FvB) building, which is a restaurant/meeting location.

The contribution focuses on sensor integration and data acquisition, heat balance modeling, and design considerations for an aquathermal system. Initially, a field campaign was conducted to assess the pond's dimensions, collect bathymetric data, and install temperature sensors at various locations and depths.

The heat balance model uses data from the pond and a nearby weather station to quantify temperature effects on the surface water system. By performing a heat balance of the water body, considering various factors, including solar radiation, wind speed, air temperature, and heat fluxes, the study evaluates the extractable thermal energy from the pond and assesses its suitability for low-temperature heating and cooling applications.

Finally, a design analysis of the pilot aquathermal system is presented, considering technical feasibility, integration with existing building energy systems, and potential scalability across the campus. The contribution also provides recommendations for implementing a more sophisticated data acquisition and monitoring system.

The findings provide practical insights for advancing sustainable energy solutions in dense urban environments and support the broader implementation of aquathermal technologies in the Netherlands.

How to cite: Fremouw, M., Koulidis, A., and Bloemendal, M.: Assessing and Designing a Pilot Aquathermal System on the TU Delft Campus, EGU General Assembly 2026, Vienna, Austria, 3–8 May 2026, EGU26-19295, https://doi.org/10.5194/egusphere-egu26-19295, 2026.

Underground coal gasification (UCG) offers a viable approach for extracting deep-seated coal deposits with minimal surface disruption. The thermomechanical behavior of adjacent rock formations, particularly shale, which typically acts as a ceiling or floor rock, has a significant impact on the success of UCG operations. This study examines the pore structure evolution of shale samples at increased temperatures from room temperature to 800 °C, approximating the thermal range experienced during UCG procedures. The primary goal is to understand how high-temperature exposure changes the porosity and microstructure of shale, altering gas movement, confinement, and overall system stability.

Shale samples were collected from Jharia Basin, India, and were heated in a muffle furnace at gradually increasing temperatures. The pore properties were assessed by Low-Pressure Gas Adsorption (LPGA), Helium Pycnometry, and Scanning Electron Microscopy (SEM). SEM imaging showed considerable microcrack formation and intergranular pore growth at temperatures above 300 °C. LPGA data showed a shift from microporous to meso- and macroporous materials as temperature increased, implying gradual pore coalescence. The Helium Pycnometer results verified a temperature-dependent increase in apparent porosity, which corresponded well to the observed physical degradation. The findings show a non-linear rise in total porosity and considerable microstructural disintegration of shale at high temperatures, which can improve gas flow paths but may expose the confining layers' stability. These thermal changes are critical to UCG operations because they affect both gas recovery efficiency and subsurface safety. The work sheds light on the thermal behavior of shale under UCG-relevant conditions, emphasizing the importance of complete thermomechanical studies in site selection and operational planning for UCG projects.

Keywords: Underground Coal Gasification, LPGA, Permeability, temperature, Porosity.

How to cite: Sahoo, S. S.: Temperature-Induced Pore Structure Evolution in Shale: Implications for Underground Coal Gasification Applications , EGU General Assembly 2026, Vienna, Austria, 3–8 May 2026, EGU26-19786, https://doi.org/10.5194/egusphere-egu26-19786, 2026.

The global energy transition is accelerating due to the climate crisis, with nations aiming for net-zero emissions as outlined in the “UAE Consensus” from the 28th United Nations Climate Change Conference (COP28). Sub-Saharan Africa must balance climate resilience and economic growth. Geothermal energy, a low-carbon, under-explored alternative to fossil fuels, can help Nigeria meet expanding energy needs. The study which aims to aims to develop an integrated, multi-scale approach for assessing geothermal resource potential employed a multi-criteria decision-making framework combining Fuzzy AHP and TOPSIS to assess geothermal potential across Nigeria’s 37 states. Fuzzy AHP provided weighted criteria, while TOPSIS calculated performance scores based on each state’s proximity to the ideal solution. Initial findings suggest that most of the highest-ranked states for geothermal potential align within regions influenced by the most recent magmatic activities in Nigeria, which occurred during the Tertiary period The analysis showed a wide spread of results, reflecting significant regional variability in geothermal conditions. Nasarawa, Bauchi, and Benue ranked highest, indicating strong geothermal suitability. Lagos, Gombe, and Ogun ranked lowest, while states such as Rivers, Katsina, and Niger showed moderate potential. Meanwhile, we will undertake targeted fieldwork in high-prospect states to map structural features at outcrop scale and conduct geochemical analysis.

How to cite: Yohanna, O.: Integrated Approach for Low-Enthalpy Geothermal Resource Appraisal and Assessment in Nigeria: Implications for Net-Zero Target , EGU General Assembly 2026, Vienna, Austria, 3–8 May 2026, EGU26-20884, https://doi.org/10.5194/egusphere-egu26-20884, 2026.

Accurate forecasting of surface solar irradiance is needed, as it helps in PV power system planning, particularly under extreme weather conditions. Deterministic and persistence-based forecasting methods generally fail under extreme weather conditions. The present study develops a hierarchical Bayesian spatio-temporal model to forecast solar radiation in the Tucson Electric Power (TEP) region, Arizona, United States. Satellite-derived (CERES SYN1deg) and reanalysis (MERRA-2) solar radiation data have been used in the present study to identify variability across the four TEP stations. The hierarchical Bayesian spatio-temporal model outperformed the persistent model. The findings also highlight that, instead of focusing on point forecasts, we should focus on uncertainty-aware forecasts.


How to cite: Singh, J.: Hierarchical Bayesian Modeling of Solar Irradiance under Extreme Weather in the Tucson Electric Power Region, EGU General Assembly 2026, Vienna, Austria, 3–8 May 2026, EGU26-22088, https://doi.org/10.5194/egusphere-egu26-22088, 2026.

EGU26-221 | ECS | Posters virtual | VPS20

Induced Diffusion of Interacting Internal Gravity Waves 

Yue Cynthia Wu and Yulin Pan

Induced diffusion (ID), an important mechanism of spectral energy transfer due to interacting internal gravity waves (IGWs), plays a significant role in driving turbulent dissipation in the ocean interior. In this study, we revisit the ID mechanism to elucidate its directionality and role in ocean mixing under varying IGW spectral forms, with particular attention to deviations from the standard Garrett-Munk spectrum. The original interpretation of ID as an action diffusion process, as proposed by McComas et al., suggests that ID is inherently bidirectional, with its direction governed by the vertical-wavenumber spectral slope σ of the IGW action spectrum, n ~ mσ. However, through the direct evaluation of the wave kinetic equation, we reveal a more complete depiction of ID, comprising both a diffusive and a scale-separated transfer rooted in the energy conservation within wave triads. Although the action diffusion may reverse direction depending on the sign of σ (i.e., red or blue spectra), the net transfer consistently leads to a forward energy cascade at the dissipation scale, contributing positively to turbulent dissipation. This supports the viewpoint of ID as a dissipative mechanism in physical oceanography. This study presents a physically grounded overview of ID and offers insights into the specific types of wave-wave interactions responsible for turbulent dissipation.

How to cite: Wu, Y. C. and Pan, Y.: Induced Diffusion of Interacting Internal Gravity Waves, EGU General Assembly 2026, Vienna, Austria, 3–8 May 2026, EGU26-221, https://doi.org/10.5194/egusphere-egu26-221, 2026.

EGU26-767 | ECS | Posters virtual | VPS20

Seasonal evolution of supraglacial lakes in Northeast Greenland 

Gopika Das K, Saurabh Vijay, and Sushil Kumar Singh

Supraglacial lakes form seasonally on the Greenland Ice Sheet (GIS) during the melt season as surface meltwater accumulates in topographic depressions. These lakes are dynamic, rapidly draining through supraglacial channels or discharging via hydrofractures, contributing to surface runoff and triggering cascading drainage of nearby lakes. Quantifying the spatial and temporal variability of their area, depth and drainage patterns is critical for understanding GIS hydrology and their role in modulating ice sheet behavior. Here we present a quantitative comparison of supraglacial lake evolution and rapid drainage cascade dynamics between contrasting melt years on Northeast Greenland Ice Stream. We analyzed Sentinel-2 observations from the 2019 and 2020 melt seasons using an automated Otsu thresholding approach combining dual water indices such as NDWIice and NDWIGN with topographic depressions from ArcticDEM to map the lakes. Lake depths and volumes were estimated using an empirical relationship between Sentinel-2 reflectance and lake depth calibrated with ICESat-2 ATL03 photon altimetry. We identified rapid drainage events and quantified their spatial and temporal clustering into cascade sequences.

The analysis revealed distinct interannual contrasts in the timing, persistence, and areal extent of supraglacial lakes, reflecting the influence of seasonal temperature variability. In 2019, warmer conditions favored more sustained lake development and prolonged persistence, whereas cooler conditions of 2020 year led to a more rapid rise-and-fall pattern with reduced total storage. Lake formation exhibited a clear elevation dependence, initiating earlier at lower elevations and progressing upward as the melt season advanced. Mid-elevation zones such as  800 to 1000m acted as key reservoirs storing 80% of the total lake volume, hosting the most persistent and voluminous lakes, suggesting their importance in surface-to-bed meltwater routing. Rapid drainage events were different between years despite similar lake inventories. A total of approximately 600 drainage events were identified across both years. Among these approximately 30% of drainage events participated in cascades. Rapid drainage events were concentrated at lower elevations typically below 800m, with a substantial proportion occurring as part of cascading drainage sequences.
Overall, our results demonstrate that variations in melt-season intensity could modulate supraglacial lake persistence, drainage behavior, and cascading dynamics. These findings emphasize the importance of mid-elevation lakes as critical nodes in meltwater transfer and provide new insights into understanding of surface lake water storage and surface-to-bed hydrological connectivity across the NEGIS sector.

How to cite: Das K, G., Vijay, S., and Singh, S. K.: Seasonal evolution of supraglacial lakes in Northeast Greenland, EGU General Assembly 2026, Vienna, Austria, 3–8 May 2026, EGU26-767, https://doi.org/10.5194/egusphere-egu26-767, 2026.

EGU26-1083 | ECS | Posters virtual | VPS20

Glacial lakes in permafrost terrain and downstream hazards 

Abhinav Alangadan and Ashim Sattar

A permafrost probability index (PPI) based on rock glacier inventory and machine learning models, including random forest, support vector machine, artificial neural network, and logistic regression, was generated for Kinnaur district, Himachal Pradesh, India. Intact rock glaciers were considered the dependent variable, and elevation, slope, aspect, and potential incoming solar radiation were used as independent variables to generate a spatially distributed, high-resolution permafrost probability index. Daily weather station data and daily multitemporal MODIS satellite data were used to train a linear regression model to predict the annual 0℃ isotherm in the region for the period of 2023-24, aiming to understand potential degradation by overlaying the isotherm on permafrost distribution. The random forest technique produced the best results with an overall accuracy of 89.43%. Seven glacial lakes were identified as located in potentially permafrost-degraded slopes, and the Kashang glacial lake was selected for detailed downstream glacial lake outburst flood process chain modeling based on its size, moraine-dammed proglacial setting, and potential downstream impact. The volume of the lake was estimated to be 8.6 × 10⁶  m3 by extrapolating the contours from overdeepening of the main glacier. Three sources of avalanches were identified based on permafrost degradation and slopes greater than 30 degrees. Subsequently, three scenario-based process chains for glacial lake outburst floods were modeled. We simulate avalanche initialization, displacement wave generation, overtopping, moraine erosion, and downstream flooding. The modelling results revealed that the potential GLOF can cause a peak discharge of 16,167 ms⁻¹, and floodwater can reach the Kashang, where a hydropower is located, within 16 minutes  in the high-magnitude scenario. The findings can give important insights into GLOF hazard mitigation in the valley and can aid as preliminary data for various stakeholders working towards mitigating glacier-related hazards.

Keywords: Permafrost, GLOF, machine learning, r.avaflow, Himalaya

How to cite: Alangadan, A. and Sattar, A.: Glacial lakes in permafrost terrain and downstream hazards, EGU General Assembly 2026, Vienna, Austria, 3–8 May 2026, EGU26-1083, https://doi.org/10.5194/egusphere-egu26-1083, 2026.

EGU26-3225 | ECS | Posters virtual | VPS20

Primary Factors Driving Extreme 2024 Early-spring Marine Heatwaves in the Tropical Atlantic: Shortwave Radiation and Mixed Layer Depth 

Jun-Chao Yang, Shenglong Li, Ingo Richter, Yi Liu, Yu Zhang, Ziguang Li, and Xiaopei Lin

The boreal early-spring of 2024 witnessed unprecedented marine heatwaves across the tropical Atlantic, setting a satellite-era record for basin-averaged marine heatwave intensity. Based on observational and reanalysis datasets and a mixed layer heat budget analysis, we identify three region-specific drivers. In the north (20°N–3°N), the event began in fall 2023 and was maintained by sustained positive shortwave radiation anomalies due to reduced cloudiness. Equatorial warming (3°N–3°S) was primarily driven by wind-driven ocean wave processes, amplified by a shallower mixed layer. In the south (3°S–20°S), the key mechanism was wind-driven mixed layer shoaling. The reduced cloudiness over the northern tropical Atlantic is linked to remote El Niño forcing, and the wind anomalies over the equatorial and southern tropical Atlantic are partly attributable to the concurrent South Atlantic Subtropical Dipole. Our findings clarify the multifaceted origins of such extreme marine heatwaves, offering crucial insights for improving their seasonal prediction.

How to cite: Yang, J.-C., Li, S., Richter, I., Liu, Y., Zhang, Y., Li, Z., and Lin, X.: Primary Factors Driving Extreme 2024 Early-spring Marine Heatwaves in the Tropical Atlantic: Shortwave Radiation and Mixed Layer Depth, EGU General Assembly 2026, Vienna, Austria, 3–8 May 2026, EGU26-3225, https://doi.org/10.5194/egusphere-egu26-3225, 2026.

EGU26-3528 | Posters virtual | VPS20

Litter detection and mapping from the combined use of multispectral UAV imagery and Deep Learning: A case study from Greece 

Christina Mitsopoulou, George P. Petropoulos, Spyridon E. Detsikas, Christina Lekka, Konstantinos Grigoriadis, Vassilios Polychronos, Elisavet-Maria Mamagiannou, Christos Gkotsikas, Konstantinos Chardavellas, and Evina Katsou

Litter pollution has grown to be the most prominent threat to the coastal ecosystems, affecting both the environment and the local communities. An important step towards the mitigation of coastal pollution is the effective monitoring of the issue. The rapid evolution of Remote Sensing has offered many new techniques for the detection of beach litter, and Unmanned Aerial Vehicles (UAVs), especially, have proven to be invaluable tools. In this study, different approaches of beach litter detection are evaluated in order to determine which ones yield the most promising results. The data used were collected in the area of Palio Faliro, Greece and included RGB and Multi-spectral images. For the detection of the litter from the UAV images, two Deep Learning (DL) models were utilized, namely the Mask R-CNN and the YOLOv3. The accuracy of these two DL models in beach litter detection and also explore the potential challenges that may arise while trying to monitor the coastal environment with UAV methods. Our study findings suggest that the combined use of DL methods and UAV imagery can provide a cost-effective and scalable solution in litter detection and can assist relevant decision-making actions. Future work will focus on evaluating different DL methods under other experimental settings as well which will help towards assessing the wider applicability of the combined use of drone imagery and DL approaches in litter detection in coastal areas.

KEYWORDS: Remote Sensing, coastal little, UAVs, drones, deep learning, ACCELERATE project

Acknowledgements 

This study is financially supported by the ACCELERATE MSCA SE program of the European Union’s Horizon research and innovation program under grant agreement No. 101182930

How to cite: Mitsopoulou, C., Petropoulos, G. P., Detsikas, S. E., Lekka, C., Grigoriadis, K., Polychronos, V., Mamagiannou, E.-M., Gkotsikas, C., Chardavellas, K., and Katsou, E.: Litter detection and mapping from the combined use of multispectral UAV imagery and Deep Learning: A case study from Greece, EGU General Assembly 2026, Vienna, Austria, 3–8 May 2026, EGU26-3528, https://doi.org/10.5194/egusphere-egu26-3528, 2026.

EGU26-3596 | ECS | Posters virtual | VPS20

Coastal Features Segmentation and Assessing their dynamics Using Machine Learning: Random Forest 

Prashant Kumar Makhan, Naresh Kumar Goud Lakku, Manasa Ranjan Behera, and Srineash Vijaya Kumar

Estuaries represent complex morphodynamic systems where interactions between tides, waves, and sediment processes control coastal stability and its ecological resilience. One such estuary, located along the bank of the Purna River in Navsari District, Gujarat, India, is currently experiencing severe erosion, with nearly two-thirds of the estuarine coastline affected.  Understanding spatio-temporal evolution of key coastal features is essential, including tidal flats, salt marshes, mangrove cover, and anthropogenic infrastructures within the study region. In this study, the coastal features segmentation is performed using the Random Forest on derived Landsat satellite imagery spectral indices spanning 2005–2024. The results indicate that over the past two decades, mangrove cover has increased by more than twofold, particularly near the estuary mouth. In contrast, tidal flat areas exhibited significant spatial variability, while salt marshes showed a considerable decline.

Shoreline change analysis shows extensive coastal erosion with the Net Shoreline Movement (NSM) exceeding 150 m in certain stretches, while the End Point Rate (EPR) ranged from 1.5 to 17 m/year (mean: 9.5 m/year). The analysis further indicates significant accretion in the estuaryward region and pronounced erosion along the seaward coast near its mouth. Further the coupled tide-wave numerical modelling was carried to attribute the observed changes. Overall, the findings highlight the complex interplay between natural coastal processes and anthropogenic pressures in this dynamic estuarine coastal system and provide valuable baseline information for coastal zone management and conservation planning.

Keywords: Estuary Dynamics, Random Forest, Shoreline changes, Tide Modelling, Wave Modelling, Remote Sensing.

How to cite: Makhan, P. K., Goud Lakku, N. K., Behera, M. R., and Vijaya Kumar, S.: Coastal Features Segmentation and Assessing their dynamics Using Machine Learning: Random Forest, EGU General Assembly 2026, Vienna, Austria, 3–8 May 2026, EGU26-3596, https://doi.org/10.5194/egusphere-egu26-3596, 2026.

EGU26-3616 | ECS | Posters virtual | VPS20

Hybrid spectral downscaling and climate-driven variability of multimodal wave systems in the Gulf of Panama 

Ruby Vallarino-Castillo, Gabriel Bellido, Laura Cagigal, Vicente Negro-Valdecantos, Jesús Portilla-Yandún, Fernando Méndez, and José A. A. Antolínez

The Gulf of Panama is a semi-enclosed tropical basin where coastal processes are driven by a multimodal wave climate with pronounced interannual-to-decadal variability (Vallarino-Castillo, 2026). Offshore wave conditions were characterized at three spectral locations near the Gulf entrance using GLOSWAC-5 spectral data (Portilla-Yandún and Bidlot, 2025), revealing dominant wave systems with distinct directional origins and seasonal variability. A persistent Southern Ocean swell dominates year-round from the south–southwest, while northerly wind-seas associated with the Panama Low-Level Jet prevail during the dry season (December–April). Their opposing directions lead to frequent crossing-sea conditions, particularly along the western Gulf entrance, where partial blocking by the Azuero Peninsula enhances directional spreading. In contrast, more exposed central-eastern locations exhibit consistently multimodal spectra, whereas sheltered eastern areas show reduced northerly wind-sea influence and narrower directional ranges. During the wet season (May–November), additional southerly swell components linked to subtropical trade winds and the Chocó Low-Level Jet reinforce low-frequency energy, while episodic North Pacific swell incursions further increase spectral complexity. Building on these offshore patterns, we analyze how wave systems transform as they propagate across the Gulf’s complex basin geometry.

To resolve coastal wave conditions efficiently, we applied a hybrid spectral downscaling framework across the Gulf. Remote swell was reconstructed using BinWaves (Cagigal et al., 2024), which disaggregates each offshore spectrum into frequency–direction bins and propagates them individually with SWAN, assuming linear wave superposition over the nearshore of the Gulf of Panama, such that nonlinear wave–wave interactions are neglected during propagation. Nearshore spectra are then reassembled using precomputed propagation coefficients that account for coastal geometry. Locally generated seas were reconstructed with HyXSeaSpec, which extracts dominant atmospheric modes via multivariate dimensionality reduction, projects SWAN spectra onto a reduced EOF/PCA space and learns the nonlinear mapping between atmospheric modes and spectral coefficients using radial basis functions (RBFs). During prediction, new wind fields are projected into the reduced space to recover full directional spectra through inverse transforms. The hybrid workflow generates a 3-hourly directional wave spectrum hindcast (1969–2023) that combines remote swell and locally generated wind-sea contributions throughout the basin.

The ongoing nearshore analysis uses the reconstructed spectra to identify dominant variability patterns and coherent wave regimes, assessing how energy is redistributed within the gulf and how nearshore conditions respond to seasonal and interannual atmospheric forcing.

References:

Vallarino-Castillo R, Antolínez JAA, Negro-Valdecantos V, Portilla-Yandún J (2026). “Beyond understanding the role of far-field climate in the Gulf of Panama coastal dynamics: an analysis of long-term and seasonal variability of wave systems”. Climate Dynamics. https://doi.org/10.1007/s00382-025-08007-w

Portilla-Yandún J, Bidlot J-R (2025). “A global ocean spectral wave climate based on ERA-5 data: GLOSWAC-5”. Journal of Geophysical Research: Oceans. https://doi.org/10.1029/2025JC022629

Cagigal, L., Méndez, F.J., Ricondo, A., Gutiérrez-Barceló, D. & Bosserelle, C. (2024). “BinWaves: An additive hybrid method to downscale directional wave spectra to near-shore areas” en Ocean Modelling. 84, 102346.

How to cite: Vallarino-Castillo, R., Bellido, G., Cagigal, L., Negro-Valdecantos, V., Portilla-Yandún, J., Méndez, F., and A. A. Antolínez, J.: Hybrid spectral downscaling and climate-driven variability of multimodal wave systems in the Gulf of Panama, EGU General Assembly 2026, Vienna, Austria, 3–8 May 2026, EGU26-3616, https://doi.org/10.5194/egusphere-egu26-3616, 2026.

EGU26-4605 | ECS | Posters virtual | VPS20

Quantifying impacts of ENSO and internal variability on the Indian Ocean Dipole 

Lianyi Zhang, Yan Du, and Yuhong Zhang

The Indian Ocean Dipole (IOD) is an intrinsic climate mode in the Indian Ocean that typically peaks during boreal fall and influences weather and climate across surrounding regions. It is influenced by both the El Niño–Southern Oscillation (ENSO) and internal variability within the Indian Ocean. However, the relative contributions of the two ENSO types—namely, Eastern Pacific (EP) and Central Pacific (CP) ENSO—and internal variability to the IOD remain poorly quantified. Here, we employ a binary combined linear regression approach to isolate and quantify the contributions of these three factors. The results show that internal variability is the dominant driver of IOD-related sea surface temperature (SST) anomalies, explaining over 60% of the variance. ENSO accounts for approximately one-third of the variance, primarily through the CP type, whereas the EP type tends to influence the IOD mainly during extreme events. Their underlying mechanisms differ. ENSO primarily modulates the Indian Ocean wind field through the Walker circulation, whose effectiveness depends on the longitudinal position of the equatorial Pacific warming—eastern for EP events and central for CP events. In contrast, internal variability generates SST anomalies through local ocean–atmosphere feedbacks that sustain the IOD. Because El Niño tends to persist longer, co-occurring positive IOD events are more likely to evolve into basin-wide Indian Ocean warming in the following spring, a transition to which El Niño contributes more than 70%. Although internal variability shows no significant statistical association with this transition, a strong positive IOD alone still has the potential to trigger the basin-wide warming in the subsequent spring. These findings enhance our understanding of climate modes and inter-basin interactions.

How to cite: Zhang, L., Du, Y., and Zhang, Y.: Quantifying impacts of ENSO and internal variability on the Indian Ocean Dipole, EGU General Assembly 2026, Vienna, Austria, 3–8 May 2026, EGU26-4605, https://doi.org/10.5194/egusphere-egu26-4605, 2026.

             The variability in the circulation of the Northern Ionian Gyre (NIG) during 1988-2020 is assessed via dynamic-height fields in the upper layer (0-120 m and 0-398 m) derived from the monthly-averaged temperature and salinity fields of the Copernicus reanalysis data. The yearly-averaged dynamic-height fields agree with the corresponding fields of altimetric sea-surface topography used in previous studies that found, at the area of the NIG, a maximum-variability mode in the sea-surface topography of the Ionian Sea. In the present results, the NIG coincides with the area of a) the variability maxima of the dynamic-heights, existing on the standard-deviation (std) maps of the yearly-averaged dynamic heights during 1988-2020, b) the std maxima of the averaged density in the upper layer and c) the std maxima of the averaged salinity in the upper layer; the density-salinity correlation coefficients in the upper-layer within the NIG range from 0.87 to 0.74.

            Moreover, the std maxima of the precipitation fluxes, which have the dominant role on the evaporation-minus-precipitation (E-P) budget, are also located on the NIG area.   The 5-year running-averaged values of yearly E-P and salinity in the upper-layer of the NIG, which filter out the variability in less that ~5-6 years while they preserve the dominant variability in the periodicities (~8-10 years) of the NIG-circulation, have statistically significant correlations ranging from 0.53 for the period 1990-2018 to 0.73 for the period 1997-2018. After ~2005, the two timeseries resemble to each other even more.  In the upper layer, the area to the east-southeast of the NIG has statistically significant correlations in salinity (correlation coefficients: ~0.68-0.8) with the NIG area. This area can feed its higher-salinity signal to the NIG via northward transfer during the cyclonic circulation mode of the NIG.

How to cite: Kontoyiannis, H., Tsiaras, K., Iona, A., and Ballas, D.: The role of the air-sea water fluxes and the lateral influence on salinity in the bimodal circulation variability of the Northern Ionian Gyre in the period 1988-2020, EGU General Assembly 2026, Vienna, Austria, 3–8 May 2026, EGU26-5203, https://doi.org/10.5194/egusphere-egu26-5203, 2026.

The Karakoram is known for its numerous surge glaciers and associated hazards from ice-dammed lake outburst floods. However, significant discrepancies persist in our understanding of surge trends and flood frequency. Therefore, this study aims to clarify the surge behaviour and related glacial lake outburst flood (GLOF) history for the Kumdan group of glaciers (Chong Kumdan, Kichik Kumdan, and Aktash). The study analysed historical archives, high-resolution satellite imagery, elevation changes derived from digital elevation models (DEMs), and glacier surface velocity from the ITS_LIVE dataset. Based on an in-depth review of historical records and cross-verified with multi-temporal satellite imagery, 16 GLOFs have been documented from this group since 1835, primarily originating from Chong Kumdan and Kichik Kumdan. The Aktash Glacier has surged several times but has not formed any ice-dammed lake due to efficient subglacial drainage, which prevents river blockages. Chong Kumdan and Aktash glaciers exhibit longer active phases (~7-10 years), whereas Kichik Kumdan Glacier shows shorter phases (~2 years). Out of all three Kumdan glaciers, the Chong Kumdan has produced the most devastating floods in 1835, 1926 and 1929. This glacier comprises two tributaries (a and b) and main trunk. Tributary ‘a’ follows a ~77-year surge cycle, and tributary ‘b’ and the main trunk exhibit asynchronous surge records. The surge cycle duration of Kichik Kumdan Glacier decreased from 33 years (1833–1866) to 27 years (1970–1997) due to climate warming. The last GLOFs from Chong Kumdan and Kichik Kumdan occurred in 1934 and 1903, respectively. DEM analysis from 2015 to 2022 reveals thickening in the reservoir areas of Chong Kumdan (~22 m) and Kichik Kumdan (~20 m), suggesting potential future surge but with a low probability of GLOF events. Overall, our study observed a decline in surge-generated GLOFs due to climate warming, reduced mass accumulation and weakening of ice dams. These insights will help downstream communities and risk management authorities better understand future risks and develop effective mitigation strategies.

How to cite: Halder, S. and Bhambri, R.: Impact of climatic warming on glacier surges and associated ice-dammed lake outburst floods in the Eastern Karakoram, EGU General Assembly 2026, Vienna, Austria, 3–8 May 2026, EGU26-5669, https://doi.org/10.5194/egusphere-egu26-5669, 2026.

EGU26-6312 | Posters virtual | VPS20

Water flux from the Andaman Sea to the South China Sea 

Zunya Wang, Peifeng Ma, Xingkun Xu, and Pavel Tkalich

Andam Sea to South China Sea (SCS) transient mesoscale water flux through the Singapore Strait, defined as reflux, reverses the annual SCS-Malacca Strait throughflow. Despite its dynamical significance, this process has received little attention. This study comprehensively examines its climatic features, driving factors and underlying mechanisms. Results indicate that reflux mainly occurs in summer and is rare in winter. Three types - WCE-, CE-, and E-type - are classified based on the extent of eastward intrusion across the Strait. The proposed physical mechanism is as follows: strong westerly winds drive surface water eastward, causing water accumulation along the western coasts of the Malay Peninsula and Sumatra and thereby elevating sea surface height (SSH) in the Malacca Strait. As SSH increases, the SSH gradient across the Strait reverses, initiating eastward flux. Meanwhile, strong westerly winds blocked by Sumatra deflect the southeastward flow northwestward around the Sunda Strait, intensifying the northward current at the eastern exit of the Singapore Strait, which enhances local Ekman transport and facilitates reflux. Although the same physical process operates in both seasons, the causes of strong westerly winds over the tropical eastern Indian Ocean differ. Summer reflux is favoured by the intensified southwest monsoon, whereas wintertime events are modulated by La Niña conditions, when warm waters and atmospheric heating near Sumatra induce a Gill-type low-level response to the equatorially symmetric heat source. Furthermore, while the considered three reflux types share the same fundamental mechanism, stronger atmospheric and oceanic forcing generates more intense and spatially extensive reflux events.

How to cite: Wang, Z., Ma, P., Xu, X., and Tkalich, P.: Water flux from the Andaman Sea to the South China Sea, EGU General Assembly 2026, Vienna, Austria, 3–8 May 2026, EGU26-6312, https://doi.org/10.5194/egusphere-egu26-6312, 2026.

As one of the world’s largest bunkering hubs, Singapore is actively preparing for the transition to low- and zero-carbon marine fuels such as ammonia and methanol. While these fuels offer distinct decarbonisation benefits, their use raises environmental safety concerns in the densely trafficked and ecologically sensitive waters of the Singapore Strait. Unlike conventional oil fuels, spills of ammonia and methanol behave primarily as dissolved plumes, with distinct physicochemical behaviour and toxicity pathways that challenge current environmental impact assessment (EIA) and spill response practices.

This study proposes an integrated EIA framework tailored to upcoming low-carbon fuels in Singapore’s coastal waters. Drawing on international practice, the local regulatory context, and scientific evidence, the framework integrates hazard identification, hydrodynamic and water quality modelling of spill scenarios, ecotoxicological risk assessment, and spatial sensitivity mapping of key marine receptors, including coral reefs, mangroves, aquaculture zones, and coastal water intakes. Ammonia and methanol are evaluated within the same framework to illustrate fuel-specific risks: methanol presents short-term toxicity risks despite rapid biodegradation, whereas ammonia exhibits both acute and chronic toxicity with complex speciation dynamics under tropical conditions.

How to cite: Shen, H., Wang, Z., and Tkalich, P.: An Environmental Impact Assessment Framework for Ammonia and Methanol as Future Marine Fuels in Singapore Coastal Waters, EGU General Assembly 2026, Vienna, Austria, 3–8 May 2026, EGU26-6313, https://doi.org/10.5194/egusphere-egu26-6313, 2026.

EGU26-8164 | Posters virtual | VPS20

Development of a Fine-Scale (1/648°) Nested Ocean Forecasting Model for the Tunisian Shelf 

Maher Bouzaiene and Milena Menna
A high-resolution forecasting nested hydrodynamic model has been developed for the Tunisian continental shelf to improve the representation of coastal circulation processes that are poorly resolved by basin-scale models. The fine-scale configuration employs a horizontal resolution of approximately 1/648° (~170 m) and is dynamically nested within a parent model of the central Mediterranean Sea. Initial and open boundary conditions are provided by the Mediterranean Sea Physics analysis at 1/24° resolution, while atmospheric forcing is derived from hourly GFS analysis data.
The enhanced spatial resolution enables a more realistic simulation of key coastal processes, including tidal dynamics, shelf currents, and nearshore circulation features. Model performance is evaluated against available in situ observations and Copernicus Marine Environment Monitoring Service (CMEMS) model products, demonstrating a substantial improvement in the representation of coastal hydrodynamics compared to lower-resolution configurations.
The developed forecasting modeling framework provides a robust tool for investigating physical processes on the Tunisian shelf and offers a valuable foundation for coastal management, environmental monitoring, and hazard assessment (e.g., storm surges and coastal flooding).

How to cite: Bouzaiene, M. and Menna, M.: Development of a Fine-Scale (1/648°) Nested Ocean Forecasting Model for the Tunisian Shelf, EGU General Assembly 2026, Vienna, Austria, 3–8 May 2026, EGU26-8164, https://doi.org/10.5194/egusphere-egu26-8164, 2026.

EGU26-10227 | ECS | Posters virtual | VPS20

Analysis of the mechanisms underlying the low-frequency variability of the low-salinity tongue in the southeastern Indian Ocean 

pang yanran, qiwei sun, yuhong zhang, ying zhang, jianwei chi, and yan du

Ocean salinity serves as a key indicator of the global water cycle and exerts important controls on oceanic circulation, sea level, and stratification, thereby playing a critical role in marine thermodynamic and dynamic processes. In recent years, salinity variability in the tropical Indian Ocean, particularly its dynamic mechanisms and climatic effects, has attracted growing scientific interest. Using 31 years of satellite observations, in-situ data sets, and model reanalysis data, this study investigates the decadal variability and formation mechanisms of the low salinity tongue in the South Indian Ocean between the equator and 20°S. The results indicate that both the volume and mean salinity of the low-salinity tongue exhibit a quasi-12-year oscillation, which is primarily associated with the Interdecadal Pacific Oscillation (IPO). Further analysis reveals that on decadal timescales, variability in the volume of the upper 50 m low-salinity tongue is mainly driven by local precipitation. Through anomalous atmospheric circulation, sea surface temperature anomalies in the tropical Pacific lead to multi-year precipitation anomalies in the southeastern Indian Ocean, which subsequently alter the westward extension of the surface low-salinity tongue and ultimately govern its volume variability in the upper 50 m. However, in the subsurface layer (50 to 200 m), variability in the volume and average salinity of the low salinity tongue is dominated by freshwater transport associated with the Indonesian Throughflow (ITF). During negative IPO phases, wind anomalies over the tropical Pacific trigger oceanic wave adjustments, which enhance the ITF salinity transport. This process subsequently leads to an expansion of the low salinity tongue and a decrease in its average salinity in the southeastern Indian Ocean. Based on the three-dimensional variability of the low salinity tongue, this study reveals the relationships between the volume and average salinity of the tongue at different depths and local freshwater forcing, as well as salinity transport by the ITF, thereby contributing to an improved understanding of how regional water mass changes respond to long-term climate variability.

How to cite: yanran, P., sun, Q., zhang, Y., zhang, Y., chi, J., and du, Y.: Analysis of the mechanisms underlying the low-frequency variability of the low-salinity tongue in the southeastern Indian Ocean, EGU General Assembly 2026, Vienna, Austria, 3–8 May 2026, EGU26-10227, https://doi.org/10.5194/egusphere-egu26-10227, 2026.

EGU26-10444 | Posters virtual | VPS20

Influence of Offshore Wind Farm Monopiles on Multi-Scale Hydrodynamics and Sediment Transport in a Wave-Current Environment 

Seyed Taleb Hosseini, Johannes Pein, Joanna Staneva, Emil Stanev, and Y. Joseph Zhang

The rapid expansion of offshore wind energy infrastructure represents a major anthropogenic modification of coastal and marginal seas, yet the physical interactions between monopile foundations, hydrodynamics, and sediment transport remain insufficiently quantified. This study investigates the impact of monopile foundations at the Meerwind offshore wind farm (German Bight, North Sea) on local and regional coastal dynamics. Using a high-resolution coupled wave-current-sediment transport model, we analyze hydrodynamic and sediment processes with mesh refinement of ~2 m near the structures to capture turbulent wake effects.

Our results demonstrate that monopile arrays act as significant sinks for wave energy: monthly mean significant wave heights (Hs) and mid-depth velocities decrease by ~5%, while turbulent kinetic energy increases by up to 70% near the foundations. Dominant westerly wind-driven waves modulate tidal asymmetry on the leeward (eastern) side of the piles, generating asymmetric turbulent wakes and altering bottom shear stress patterns.

Reduced wave-induced bottom stress enhances localized sediment deposition, increasing surface suspended sediment concentration (SSC) while reducing near-bottom loads. On a regional scale, wave attenuation leads to a ~1% decrease in depth-averaged SSC over a 20 km east of the piles. In consequence, the presence of the wind farm reduces the net inflowing sediment flux by ~25% within a 5 km radius during March 2020, linked to a ~2 cm attenuation of Hs.

These findings highlight how large-scale offshore energy infrastructure can reorganize sediment budgets and coastal morphodynamics under changing human activities, providing critical insights for the sustainable management of multi-use ocean spaces. Further work, including additional wind farms and extended simulation periods, is planned to substantiate these initial findings and better quantify cumulative impacts, particularly in light of ongoing erosion challenges in the Wadden Sea under sea-level rise.

How to cite: Hosseini, S. T., Pein, J., Staneva, J., Stanev, E., and Zhang, Y. J.: Influence of Offshore Wind Farm Monopiles on Multi-Scale Hydrodynamics and Sediment Transport in a Wave-Current Environment, EGU General Assembly 2026, Vienna, Austria, 3–8 May 2026, EGU26-10444, https://doi.org/10.5194/egusphere-egu26-10444, 2026.

EGU26-11166 | ECS | Posters virtual | VPS20

Improving coastal monitoring and forecasting systems through interoperable OGC API EDR-based data services 

Telmo Dias, Cesário Videira, Victor Lobo, Ana Cristina Costa, and Márcia Lourenço Baptista

Effective coastal monitoring and forecasting systems rely on the availability and timeliness of interoperable, standardized, and accessible marine data across observational, modelling and service layers. Fragmented data formats, legacy infrastructures, and non-standardized access mechanisms remain significant barriers to the seamless integration of ocean observations into operational monitoring and forecasting systems and downstream applications.

This study presents the development of a standards-based data workflow designed to enhance interoperability, scalability, and facilitate marine data integration, through the adoption of international standards and best practices. The proposed approach focuses on establishing robust data flows that transform, validate, and harmonize heterogeneous datasets (e.g., in situ near-real-time observations and numerical model outputs) into NetCDF format. Standardized and programmatic access to these datasets is enabled though the OGC API Environmental Data Retrieval protocol, implemented using the pygeoapi platform. By adopting open standards and service-oriented architectures, this framework enables efficient spatio-temporal querying of ocean variables, facilitating their assimilation into forecasting systems, decision-support tools, and customized applications. In parallel, geoportal interfaces were updated to integrate the new OGC API EDR services, ensuring that interoperable data access is available both through machine-to-machine interfaces and user-friendly graphical tools, supporting a broad range of user profiles and promoting citizen involvement and ocean literacy.

By addressing interoperability at the data, service, and user-interface levels, this work demonstrates how standardized data infrastructures are key enablers for improved, scalable, and sustainable coastal monitoring and forecasting capabilities.

How to cite: Dias, T., Videira, C., Lobo, V., Costa, A. C., and Lourenço Baptista, M.: Improving coastal monitoring and forecasting systems through interoperable OGC API EDR-based data services, EGU General Assembly 2026, Vienna, Austria, 3–8 May 2026, EGU26-11166, https://doi.org/10.5194/egusphere-egu26-11166, 2026.

Dynamic sea-level change (ΔDSL) is a key process in shaping the pattern of future sea-level rise. CMIP6 models predict a range of ΔDSL under 1% increase of CO2 per year. We analyse this CMIP6 spread into contributions from: 1) surface flux change (dF) and 2) model sensitivity to it (Φ). Specifically, we perturb the pre-industrial simulation of an ocean model with space- and time-varying dF diagnosed from different CMIP6 models (one at a time). The CMIP6 spread is thus decomposed into a flux-driven spread and a residual; the latter is linked to model spread of Φ. We improve upon previous studies by: (a) deriving the perturbed forcing ensemble using an ocean-only setup and (b) comparing it with the CMIP6 ensemble for both variance and correlation. This reveals distinct roles of surface forcing in driving the CMIP6 spread in different regions. In the North Pacific, differences in windstress forcing primarily explain the CMIP6 spread, while in the North Atlantic, differences in model sensitivity are more important. For the latter region, although buoyancy forcing drives a ΔDSL spread there, it correlates poorly with the CMIP6 spread. In the Southern Ocean, differences in forcing and sensitivity are both important for explaining the CMIP6 spread. The surface forcing affects the spread along 40°S via windstress and the spread around the Antarctic via buoyancy flux. In addition to ΔDSL analysed here, the perturbed forcing ensemble can be used to analyse future changes in other ocean variables, such as temperature, salinity and the Atlantic meridional overturning circulation. The full ensemble data is openly available online and can be freely used for future studies.

How to cite: Wu, Q. and Gregory, J.: Surface flux contributions to CMIP6 spread of dynamic sea-level change vary across regions: insights from an ocean-only perturbed forcing ensemble, EGU General Assembly 2026, Vienna, Austria, 3–8 May 2026, EGU26-11315, https://doi.org/10.5194/egusphere-egu26-11315, 2026.

EGU26-11635 | ECS | Posters virtual | VPS20

Monitoring post-GLOF moraine dynamics at South Lhonak lake using satellite radars 

Utkarsh Verma and Ashim Sattar

The South Lhonak Lake (SLL) Glacial Lake Outburst Flood (GLOF) cascade event of 3-4 October 2023 triggered widespread devastation across Sikkim and the downstream region of Bangladesh, causing significant loss of lives and property. The post-disaster research shows that the GLOF event was triggered by a moraine failure, creating tsunami waves in the lake, eventually leading to the breach of the frontal moraine. Despite partial drainage of the lake in the 2023 event, the hazard potential of the lake needs further investigation. This makes it extremely important to continuously monitor the surrounding regions to identify unstable slopes that can potentially fail and impact the lake. The present study utilises a Sentinel-1 Small Baseline Subset (SBAS) workflow performed in the ASF OpenSARLab environment to analyse the condition of the moraines post-SLL disaster. Post-disaster analysis spanning October 2023 to September 2025 reveals continued moraine instability, characterised by an actively deforming zone along the right flank of the failed zone. This region shows a maximum LOS displacement rate of approximately -4 cm yr-1, with a maximum cumulative LOS displacement reaching around -6 cm in the ascending track and -5 cm in the descending track. The results indicate persistent post-failure deformation and ongoing slope instability in the moraines of South Lhonak. The study provides a critical insight into the temporal behaviour of moraine slopes. This study aimed at strengthening the disaster management strategies by integrating satellite-based deformation monitoring for early warning and risk reduction measures.

How to cite: Verma, U. and Sattar, A.: Monitoring post-GLOF moraine dynamics at South Lhonak lake using satellite radars, EGU General Assembly 2026, Vienna, Austria, 3–8 May 2026, EGU26-11635, https://doi.org/10.5194/egusphere-egu26-11635, 2026.

El Niño and the Southern Oscillation (ENSO) have a worldwide impact on seasonal to yearly climate. However, there are decadal variations in the seasonal prediction skill of ENSO in dynamical and statistical models; in particular, ENSO prediction skill has declined since 2000. The shortcomings of models mean that it is very important to study ENSO seasonal predictability and its decadal variation using observational/reanalysis data. Here we quantitatively estimate the seasonal predictability limit (PL) of ENSO from 1900 to 2015 using Nonlinear local Lyapunov exponent (NLLE) theory with an observational/reanalysis dataset and explore its decadal variations. The mean PL of sea surface temperature (SST) is high in the central/eastern tropical Pacific and low in the western tropical Pacific, reaching 12–15 and 7–8 months, respectively. The PL in the tropical Pacific varies on a decadal timescale, with an interdecadal standard deviation of up to 2 months in the central tropical Pacific that has similar spatial structure to the mean PL. Taking the PL of SST in the Niño 3.4 region as representative of the PL in the central/eastern tropical Pacific, there are clearly higher values in the 1900s, mid-1930s, mid-1960s, and mid-1990s, and lower values in the 1920s, mid-1940s, and mid-2010s. Meanwhile, the PL of SST in the Niño 6 region—whose average value is 7 months—is in good agreement with the PL of most regions in the western tropical Pacific, with higher values in the 1910s, 1940s, and 1980s and lower values in the 1930s, 1950s, and mid-1990s.In the framework of NLLE theory, the PL is determined by the error growth rate (representing the dissipation rate of the predictable signal) and the saturation value of relative error (representing predictable signal intensity). We reveal that the spatial structure of the mean PL in the tropical Pacific is determined mainly by the error growth rate. The decadal variability of PL is affected more by the variation of the saturation value of relative error in the equatorial Pacific, whereas the error growth rate cannot be ignored in the PL of some regions. As an important source of predictability in ENSO dynamics, the relationship between warm water volume and SST in the Niño 3.4 region has a critical role in the decadal variability of PL in the tropical Pacific through the error growth rate and saturation value of relative error. This strong relationship reduces the error growth rate in the initial period and increases the saturated relative error, contributing to the high PL.

How to cite: Hou, Z. and Li, J.: Investigating decadal variations of the seasonal predictability limit of sea surface temperature in the tropical Pacific, EGU General Assembly 2026, Vienna, Austria, 3–8 May 2026, EGU26-12134, https://doi.org/10.5194/egusphere-egu26-12134, 2026.

EGU26-13664 | ECS | Posters virtual | VPS20

 Use of δ15N and macroalgae as indicators of the level of anthropogenic intervention in the Colombian Pacific. 

Ray Steven Arce-Sánchez, Diana Medina-Contreras, and Alberto Sánchez-González

Coastal ecosystems are highly vulnerable to nutrient-driven eutrophication from anthropogenic sources such as urbanization, wastewater discharge, and industrial development, among others, which alters their ecosystem services. In order to determine nitrogen sources, the nitrogen isotopic composition (δ15N) was analyzed in the macroalgae Boodleopsis verticillata and Bostrychia spp., collected between 2014 and 2016 at four localities with different degrees of anthropogenic disturbance: Valencia – Very Low Intervention (MBI-VA), Chucheros – Low Intervention (BAI-CHU), San Pedro – Moderate Intervention (MOI-SP), and Piangüita – High Intervention (ALI-PI) in the Colombian Pacific. The δ15N values ranged between 0.3 and 2.4‰ in MBI-VA, 1.8 and 3.4‰ in BAI-CHU, 2.3 and 5.5‰ in MOI-SP, and 2.3 and 10.16‰ in ALI-PI. Since the assumptions of normality and homogeneity of variances were not met (p < 0.05), a non-parametric Kruskal–Wallis test was applied, revealing significant differences in δ15N among localities (p < 0.0001). Dunn’s test indicated that MBI-VA and BAI-CHU differed significantly from MOI-SP and ALI-PI (p < 0.05). Three nitrogen sources were defined: atmospheric deposition, oceanic waters, and wastewater. Both species (B. verticillata andBostrychia spp.) showed a decreasing gradient of atmospheric deposition (87% ± 3% to 52% ± 7% and 82% ± 6% to 21% ± 11%, respectively) from MBI to ALI, in contrast to an increase in oceanic waters (8% ± 4% to 37% ± 13% and 12% ± 7% to 38% ± 21%) and wastewater contributions (5% ± 2% to 12% ± 6% and 7% ± 3% to 41% ± 12%). This pattern was more evident in Bostrychia spp., suggesting greater sensitivity to variations in nitrogen sources. Linear regression between δ15N and nitrate concentration yielded coefficients of determination of R2 = 0.71 for B. verticillata and R2 = 0.89for Bostrychia spp., indicating that isotopic variability was explained by nitrate. The potential of macroalgae as bioindicators of anthropogenic intervention in coastal ecosystems of the Colombian Pacific is suggested.

How to cite: Arce-Sánchez, R. S., Medina-Contreras, D., and Sánchez-González, A.:  Use of δ15N and macroalgae as indicators of the level of anthropogenic intervention in the Colombian Pacific., EGU General Assembly 2026, Vienna, Austria, 3–8 May 2026, EGU26-13664, https://doi.org/10.5194/egusphere-egu26-13664, 2026.

EGU26-15143 | ECS | Posters virtual | VPS20

Holocene Sea Ice and Organic Matter Dynamics in the Southern Chukchi Sea Revealed by Lipid Biomarkers 

Kuang Jin, Anne de Vernal, Robert S. Pickart, Mickey Chen, Gerard Otiniano, and Trevor Porter

Arctic sea ice plays a critical role in regulating global climate and marine primary production, yet long-term records documenting its natural variability remain sparse in the Pacific sector of the Arctic Ocean. This limitation hampers our ability to establish a regionally coherent understanding of how sea ice responds to climatic and oceanographic forcing on centennial to millennial timescales. Here, we present a new biomarker-based reconstruction of Holocene sea ice and environmental change from the southern Chukchi Sea, north of the Bering Strait.

A 519-cm sediment core (SKQ-VC29) was recovered using a vibracorer and spans the last ~8.6 kyr, based on 17 AMS radiocarbon dates from shells and terrestrial macrofossils. Downcore concentrations of highly branched isoprenoids (HBIs) and sterols were quantified to reconstruct sea-ice conditions, marine productivity, and terrestrial organic matter (OM) inputs. Seasonal sea ice presence is inferred from IP25, a mono-unsaturated HBI produced by sea-ice diatoms, while open-water conditions and phytoplankton productivity are tracked using HBI III, brassicasterol, and dinosterol. These proxies are combined using the PIP25 index to provide a semi-quantitative reconstruction of sea-ice cover. Terrestrial inputs are assessed using vascular-plant sterols (campesterol and β-sitosterol), alongside bulk δ¹³C and C:N ratios.

The record indicates predominantly open-water conditions during the early to mid-Holocene, followed by the reappearance of seasonal sea ice at ~2.5 kyr BP—substantially later than in more northerly Arctic records. This delayed signal suggests that Neoglacial sea-ice expansion in the Pacific Arctic was spatially heterogeneous. Bulk OM proxies and declining β-sitosterol concentrations indicate a progressive reduction in terrestrial OM delivery through the Holocene, while marine productivity remains relatively stable. A pronounced shift at ~4 ka BP marks reduced organic carbon accumulation and broader environmental reorganization.

Together, these results improve spatial coverage of Holocene sea-ice reconstructions in the Pacific Arctic and highlight the complex, regionally variable nature of sea-ice evolution in a climatically sensitive gateway region.

How to cite: Jin, K., de Vernal, A., Pickart, R. S., Chen, M., Otiniano, G., and Porter, T.: Holocene Sea Ice and Organic Matter Dynamics in the Southern Chukchi Sea Revealed by Lipid Biomarkers, EGU General Assembly 2026, Vienna, Austria, 3–8 May 2026, EGU26-15143, https://doi.org/10.5194/egusphere-egu26-15143, 2026.

EGU26-16248 | Posters virtual | VPS20

Explainable Expert-in-the-loop sea-ice classification with statistical models 

Corneliu Octavian Dumitru, Chandrabail Karmakar, and Stefan Wiehle

Sea ice classification is often a crucial step to predict climatic insights and ensure safe marine navigation. In the last few decades, satellite information has been widely used to classify sea ice in broad areas for practical applications. However, common problems are:

1) Low resolution of satellite images to provide precise classification,

2) High computational need, and

3) Scarcity of general models to discover unknown patterns in the data, especially those that enable free selection of satellite sensors to fit the application at hand.

We propose an explainable unsupervised model to integrate ice-experts’ inputs to models so that the problem of having low-resolution data can be overcome. In other words, the results of the models, given as semantic maps, can be further refined using inputs from ice-experts.

Model explainability and visual interpretation of models serve as tools to talk to’ domain experts. The use of Explainable AI in such vital activities ensures trust and easy detection of error. We present an example from a sea ice classification with Sentinel-1 time-series in the scope of the Horizon 2020 project ExtremeEarth.

A further example from the Horizon Europe project dAIEdge demonstrates the use of these explainable models for ‘on-the-edge’ inference.

How to cite: Dumitru, C. O., Karmakar, C., and Wiehle, S.: Explainable Expert-in-the-loop sea-ice classification with statistical models, EGU General Assembly 2026, Vienna, Austria, 3–8 May 2026, EGU26-16248, https://doi.org/10.5194/egusphere-egu26-16248, 2026.

EGU26-16935 | Posters virtual | VPS20

Dust in the Arctic: feedbacks and interactions between climate change, aeolian dust and ecosystems 

Outi Meinander, Andreas Uppstu, Pavla Dagsson-Waldhauserova, Christine Groot-Zwaaftink, Christian Juncher Jørgensen, Alexander Baklanov, Adam Christenson, Andreas Massling, and Mikhail Sofiev

Dust in the Arctic is an emerging topic related to climate and environmental impacts. The United Nations (UN) General Assembles and the UN Coalition to Combat Desertification (UNCCD) have reiterated that the global frequency, intensity, and duration of Sand and Dust Storms (SDS) have increased in the last decade and that SDS have natural and human causes that can be exacerbated by desertification, land degradation, drought, biodiversity loss, and climate change. UNCCD and FAO have also highlighted that emerging SDS source areas have been associated with the warming of the Arctic and high latitude regions, the seasonal or permanent drying of inland waters and river deltas, or are following large-scale deforestation and wildfires, or even the ploughing of a single field. Loss of snow cover, retreat of glaciers, and increase in drought intensity due to climate change can lead to surface conditions that increase the likelihood of creation, continuation and expansion of SDS source areas.

Climatic feedback mechanisms and ecosystem impacts related to dust in the Arctic include direct radiative forcing (absorption and scattering), indirect radiative forcing (via clouds and cryosphere), semi-direct effects of dust on meteorological parameters, effects on atmospheric chemistry, as well as impacts on terrestrial, marine, freshwater, and cryosphere ecosystems. Here we give an overview of our recent understanding on dust emissions and their long-range transport routes, deposition, and ecosystem effects in the Arctic as presented in Meinander et al. (2025), part of the series of review papers of the Arctic Council Working Group AMAP (Arctic Monitoring and Assessment Program) and CAFF (Conservation of Arctic Flora and Fauna), where the target audience is the scientific community focusing on the Arctic. Additional audiences include policy advisers and other staff in environmental-related ministries.

We conclude that the multiple mechanisms related to dust emissions, transport and deposition both cool and warm the climate system, with an uncertain net effect. Dust plays a significant role in terrestrial and aquatic ecosystems, e.g., by providing nutrients, and with impacts on the availability of light and water. Due to Arctic warming, HLD dust emissions can be expected to increase. The contributions of LLD and HLD complicates the interpretation of how much different sources contribute to the dust loadings and corresponding temporal and spatial deposition patterns. Another challenge is that low latitude dust source emissions of road and agricultural dust is barely characterized.

Reference:

Meinander O, Uppstu A, Dagsson-Waldhauserova P, Groot Zwaaftink C, Juncher Jørgensen C, Baklanov A, Kristensson A, Massling A and Sofiev M (2025). Dust in the arctic: a brief review of feedbacks and interactions between climate change, aeolian dust and ecosystems. Front. Environ. Sci. Sec. Interdisciplinary Climate Studies, Volume 13 – 2025. doi: 10.3389/fenvs.2025.1536395. CAFF-special issue.


How to cite: Meinander, O., Uppstu, A., Dagsson-Waldhauserova, P., Groot-Zwaaftink, C., Juncher Jørgensen, C., Baklanov, A., Christenson, A., Massling, A., and Sofiev, M.: Dust in the Arctic: feedbacks and interactions between climate change, aeolian dust and ecosystems, EGU General Assembly 2026, Vienna, Austria, 3–8 May 2026, EGU26-16935, https://doi.org/10.5194/egusphere-egu26-16935, 2026.

EGU26-17453 | ECS | Posters virtual | VPS20

A Non-Stationary Multivariate Framework for Assessing Compound Coastal Hazards at Global Scales 

Mohammad Hadi Bahmanpour, Lorenzo Mentaschi, Alois Tilloy, Michalis Vousdoukas, Ivan Federico, Giovanni Coppini, and Luc Feyen

Coastal regions are increasingly exposed to compound hazards driven by the joint occurrence of extreme sea levels, waves, river discharge, and atmospheric forcing, with risks further amplified by long-term sea-level rise. Accurately quantifying these low-probability, high-impact events requires statistical frameworks capable of representing both multivariate dependence and non-stationary behavior across space and time. Here, we present an integrated approach for global to regional coastal hazard assessment that combines non-stationary extreme value analysis with multivariate dependency modeling. The framework builds on transformed-stationary representations of evolving marginal extremes and incorporates time-varying dependence structures to capture changes in cross-hazard relationships under shifting climate conditions. Event-based sampling strategies and statistical diagnostics are used to isolate relevant extremes and assess the significance of observed trends and uncertainties. Applied to large-scale datasets of coastal and hydrometeorological variables, the methodology reveals substantial temporal and spatial variability in compound hazard characteristics, highlighting the limitations of stationary and univariate assumptions. Ongoing developments extend the framework toward a unified multihazard modeling chain that consistently integrates oceanic, atmospheric, and terrestrial drivers. By embedding diverse physical processes within a coherent statistical structure, this work advances the representation of compound coastal extremes and provides a robust foundation for next-generation hazard assessments. The proposed approach supports the development of more realistic risk scenarios, offering critical insights for adaptation planning and resilience strategies under present and future climate conditions.

How to cite: Bahmanpour, M. H., Mentaschi, L., Tilloy, A., Vousdoukas, M., Federico, I., Coppini, G., and Feyen, L.: A Non-Stationary Multivariate Framework for Assessing Compound Coastal Hazards at Global Scales, EGU General Assembly 2026, Vienna, Austria, 3–8 May 2026, EGU26-17453, https://doi.org/10.5194/egusphere-egu26-17453, 2026.

Accelerated glacier retreat in the Western Himalaya has led to rapid expansion of glacial lakes and increasing concern over Glacial Lake Outburst Flood (GLOF) hazards. This study presents a basin-scale assessment of glacial lake evolution, potential future lake formation, and GLOF susceptibility in the Chenab Basin, integrating multi-temporal remote sensing, terrain analysis, and probabilistic exposure modelling. A decadal inventory of glacial lakes was developed for five time periods (1990, 2000, 2010, 2020 and 2025) using Landsat and Sentinel-2 imagery, combined with semi-automated extraction and geomorphological classification. Results reveal a consistent increase in both lake number and total area over the last three decades. Potential future glacial lakes were identified using various ice-thickness modeling approach applied to current glacier extents. This analysis presents an inventory of the future glacial lake in the entire basin giving special emphasis to determining the characteristics of the future lake including maximum extent of the future lakes and volume of the future glacial lakes. GLOF susceptibility of existing lakes was evaluated using a multi-criteria framework to identify critical lakes requiring priority monitoring. Downstream exposure was further assessed using the Monte Carlo Least Cost path approach, explicitly accounting for uncertainty in breach location and flood routing parameters to delineate probable impact corridors. The framework provides new insights into evolving cryospheric hazards in the Chenab Basin and demonstrates the utility of combining lake dynamics, future lake potential, susceptibility assessment, and probabilistic exposure analysis for improved GLOF risk prioritization in the Western Himalayas.

How to cite: Das, D. R. and Sattar, A.: Evolution of present and potential future glacial lakes and implications for GLOF hazard in the Chenab Basin, Western Himalaya, EGU General Assembly 2026, Vienna, Austria, 3–8 May 2026, EGU26-17889, https://doi.org/10.5194/egusphere-egu26-17889, 2026.

EGU26-20743 | Posters virtual | VPS20

Machine Learning based Seasonal Streamflow Forecasting in Cold-Region Catchments: Insights from LamaH-Ice dataset 

Golda Prakasam, Mikko Strahlendorff, Anni Kröger, and Andri Gunnarsson

Machine learning (ML) remains one of the best approaches for long-term seasonal streamflow forecasting in cold regions owing to its capacity to capture nonlinearity between inputs and outputs, as well as its scalability across hydroclimatic regimes. ML’s main advantage lies in the generalizability of these models when applied to heavily glacierized catchments. In this data-driven study, we mainly utilize the Extreme Gradient Boosting (XGBoost) regression to train and test seasonal streamflow predictions using the LArge-SaMple DAta for Hydrology and Environmental Sciences for Iceland (LamaH-Ice). This new dataset for Iceland, published in 2024 consists of topographic, hydroclimatic, land cover, vegetation, soil, geological, and glaciological attributes that are essential for understanding cryosphere–hydrology processes in cold regions. For more than 100 basins, time series information on meteorological forcings and variables relevant to cold-region hydrology, such as MODIS (Moderate Resolution Imaging Spectroradiometer) snow cover, glacier albedo are also available. The majority of gauged rivers in LamaH-Ice are reported to have minimal human disturbances, making the dataset particularly unique. The XGBoost model demonstrates strong predictive skill across the study basins, as indicated by Kling-Gupta Efficiency (KGE) and Nash-Sutcliffe Efficiency (NSE) metrics exceeding 0.98. Ultimately high-precision streamflow forecasting is needed to track hydrometeorological hazards and to aid our ability to manage water resources in cold regions, which are a source for irrigation and hydropower.

References

Helgason, Hordur Bragi, and Bart Nijssen. “LamaH-Ice: LArge-SaMple DAta for Hydrology and Environmental Sciences for Iceland.” Earth System Science Data, vol. 16, no. 6, 13 June 2024, pp. 2741–2771, doi:10.5194/essd-16-2741-2024. 

Strahlendorff, Mikko, et al. “Forestry Climate Adaptation with HarvesterSeasons Service—a Gradient Boosting Model to Forecast Soil Water Index SWI from a Comprehensive Set of Predictors in Destination Earth.” Frontiers in Remote Sensing, vol. 5, 20 Dec. 2024, doi:10.3389/frsen.2024.1360572.

How to cite: Prakasam, G., Strahlendorff, M., Kröger, A., and Gunnarsson, A.: Machine Learning based Seasonal Streamflow Forecasting in Cold-Region Catchments: Insights from LamaH-Ice dataset, EGU General Assembly 2026, Vienna, Austria, 3–8 May 2026, EGU26-20743, https://doi.org/10.5194/egusphere-egu26-20743, 2026.

EGU26-21419 | ECS | Posters virtual | VPS20

Variability of Black Sea Physical Processes from 1950 to 2100 

Bükem Belen, Deniz Dişa, Ali Osman Acar, Sinan Arkın, Mustafa Yücel, Bettina Fach, and Barış Salihoğlu

Climate change and climate variability have significant effects on atmospheric and oceanic processes, with semi-enclosed basins such as the Black Sea being particularly vulnerable due to their unique physical and chemical structure. In recent decades, the basin has experienced pronounced changes in temperature, salinity, and circulation, with important consequences for its biogeochemical and ecological functioning. Understanding the mechanisms driving these changes and their future evolution is therefore essential. This study investigates the historical and projected variability of key physical processes in the Black Sea over the period 1950-2100 using a high-resolution regional ocean model (NEMO). Temperature, salinity, mixed layer depth, and Cold Intermediate Layer (CIL) dynamics are analyzed, using atmospheric forcings from reanalysis data (ERA5) and a regional climate model (MAR) forced by a global climate model (EC-Earth). Future projections are conducted under two IPCC Shared Socioeconomic Pathways (SSP1-2.6 and SSP5-8.5). The historical simulations (1950-2020) are validated against in situ CTD observations and satellite-derived sea surface temperature and sea surface height, demonstrating good skill in reproducing the observed thermal and haline structure of the basin. Results from the historical simulations show a progressive weakening of the CIL and a shift toward stronger upper sea stratification. Future simulations aim to quantify how different climate change pathways will modify temperature and salinity dynamics. Together, the results provide new insight into the atmospheric drivers controlling Black Sea hydrodynamics and offer projections of regional climate change impacts on this highly sensitive system.

How to cite: Belen, B., Dişa, D., Acar, A. O., Arkın, S., Yücel, M., Fach, B., and Salihoğlu, B.: Variability of Black Sea Physical Processes from 1950 to 2100, EGU General Assembly 2026, Vienna, Austria, 3–8 May 2026, EGU26-21419, https://doi.org/10.5194/egusphere-egu26-21419, 2026.

EGU26-21809 | ECS | Posters virtual | VPS20

D-PERSEUS: A Drone Radar Mission to Study a Debris-Covered Glacier on Mars 

Reed Spurling, Stefano Nerozzi, and Roberto Aguilar

Near-surface water ice in Phlegra Montes, Mars, could support human exploration and settlement. Orbital sounding radar provides strong evidence for the existence of this ice, as does morphology consistent with debris-covered glaciers. Impact excavation of these glacier-like features has exposed ice, visible in HiRISE images, but the distribution and quantity of this ice is uncertain, necessitating further evaluation for its potential to support human exploration. We are developing the Prototype Radar Sounding Experiment for Unveiling the Subsurface (PERSEUS) instrument to study debris-covered glaciers on Earth and Mars, and we propose D-PERSEUS, a mission to study a debris-covered glacier in Phlegra Montes using a drone-based Ground Penetrating Radar like this one. This mission could verify the presence of water ice in-situ and improve characterization of water ice resources, which could serve as exploratory work ahead of a potential Mars Life Explorer mission.

How to cite: Spurling, R., Nerozzi, S., and Aguilar, R.: D-PERSEUS: A Drone Radar Mission to Study a Debris-Covered Glacier on Mars, EGU General Assembly 2026, Vienna, Austria, 3–8 May 2026, EGU26-21809, https://doi.org/10.5194/egusphere-egu26-21809, 2026.

EGU26-22059 | ECS | Posters virtual | VPS20

Indirect assimilation of remote sensing reflectance: case study in the Liguria Sea 

Carlos Enmanuel Soto Lopez, Paolo Lazzari, Fabio Anselmi, and Anna Teruzzi

The dataset with the most spatial coverage for data assimilation of biogeochemical models in operational systems is the satellite-derived data. Nevertheless, variables derived from Remote Sensing Reflectance (RSR), like the sea surface chlorophyll concentration, for regions like coastal areas, can reach big errors if compared with in situ measurements. For this reason, a suggestion with the aim of improving the assimilated results comes from the direct assimilation of Remote Sensing Reflectance, removing the error derived from inferring the biogeochemical variable before assimilating. In this work, we focus on a case study, using the Biogeochemical Flux Model (BFM) merged with a hydrological model, we study the effects of the direct and indirect assimilation of RSR in a region located in the Ligurian Basin of the northwestern Mediterranean Sea.  For both assimilation experiments, the algorithm used was an Error Subspace Kalman Filter. To assess the results, we compared them with climatologies computed with in situ measurements, highlighting the advantages and disadvantages of both approaches. 

How to cite: Soto Lopez, C. E., Lazzari, P., Anselmi, F., and Teruzzi, A.: Indirect assimilation of remote sensing reflectance: case study in the Liguria Sea, EGU General Assembly 2026, Vienna, Austria, 3–8 May 2026, EGU26-22059, https://doi.org/10.5194/egusphere-egu26-22059, 2026.

Data-driven global weather models, such as GraphCast, have revolutionized medium-range forecasting but often exhibit systematic limitations in quantitative precipitation forecasting (QPF). Specifically, these models tend to produce over-smoothed blurry rainfall fields and underestimate localized extremes , primarily due to the inherent uncertainties in their reanalysis training data (e.g., ERA5) and the use of mean-squared-error-based loss functions.

To bridge the gap between coarse-resolution global AI forecasts and the need for precise, high-impact weather prediction, we introduce SynQPF-Net, a deep learning framework designed to synergize GraphCast’s dynamical background fields with high-resolution observational analyses. The model employs a dual-stream spatiotemporal encoder to process heterogeneous inputs: the 0.25o dynamical forecasts from GraphCast and the 0.0625o precipitation analyses from the China Meteorological Administration Land Data Assimilation System (CLDAS) . A specialized hybrid loss function, combining classification (Dice) and regression (Weighted MSE) objectives, is utilized to jointly optimize the spatial structure and intensity of precipitation.

Evaluated on warm-season events in Southern China, our approach demonstrates significant skill improvements. SynQPF-Net effectively sharpens the forecast, doubling the Critical Success Index (CSI) for heavy rainfall (>=10 mm) at the 6-hour lead time compared to the raw GraphCast output. Crucially, interpretability analysis reveals that the model learns physically consistent meteorological principles: it predominantly relies on extrapolating recent observational patterns for short lead times (<=12 h) and dynamically shifts its focus to large-scale circulation and moisture variables (e.g., 700 hPa specific humidity) as the forecast horizon extends. This work provides a validated pathway for correcting and downscaling global AI weather models, offering a robust solution for short-range extreme precipitation forecasting.

How to cite: Chen, D.: Bridging Global AI Models and Local Extremes: A Dual-Stream Framework for Correcting and Downscaling GraphCast Rainfall Predictions, EGU General Assembly 2026, Vienna, Austria, 3–8 May 2026, EGU26-1413, https://doi.org/10.5194/egusphere-egu26-1413, 2026.

EGU26-5340 | ECS | Posters virtual | VPS21

A Multi-Objective Cost Minimization Framework for Managed Aquifer Recharge Integrating Pareto Optimization and Least-Cost Path Analysis 

Rahma Fri, Andrea Scozzari, Souad Haida, Malika Kili, Jamal Chao, Abdelaziz Mridekh, and Bouabid El Mansouri

In arid and semi-arid regions, pressure on groundwater resources has reached critical levels. Long-term over-pumping has depleted many aquifers, and climate change is intensifying this process. Rising temperatures increase evaporation from rivers and reservoirs, reducing the amount of surface water available for infiltration and natural recharge. Under these conditions, the use of surface water during periods of availability and its storage underground represents a key mechanism of managed aquifer recharge, effectively avoiding evaporation losses.

In this study, a practical framework is developed and tested to identify feasible ways to transfer accumulated surface water toward stressed aquifers. Rather than relying on complex ranking approaches, the locations of existing water infrastructure specifically wells and traditional khettara systems are used as reference points. These features indicate where aquifers are accessible and provide realistic spatial anchors for planning recharge at the regional scale.

The method combines satellite imagery to map surface water, geographic information systems (GIS) to identify cost-effective transfer pathways across the landscape, and multi-objective optimization to evaluate trade-offs between competing objectives. Feasibility is assessed through a cost function that accounts for terrain slope, elevation differences, transfer distance, pumping energy requirements, infrastructure costs, and potential water treatment needs.

The approach is applied to the Draa Oued Noun Basin in southern Morocco, a region strongly affected by water scarcity, high evaporation rates, and declining groundwater levels. Several surface water sources are examined, and feasible conveyance routes toward aquifers supplying key wells and khettara systems are identified.

The results show substantial variations in cost between water sources. Available water volume, transfer distance, and especially elevation lift emerge as the main cost drivers. Trade-off analysis helps identify the most cost-effective projects under limited budgets. The results also highlight opportunities for cost reduction: where gravity-driven transfer is possible, costs are significantly lower, and where pumping is required, solar energy offers a viable option for reducing long-term operational expenses.

Overall, this work provides a spatially explicit and realistic basis for planning artificial groundwater recharge, while respecting economic constraints and supporting sustainable groundwater management in highly water-stressed regions.


How to cite: Fri, R., Scozzari, A., Haida, S., Kili, M., Chao, J., Mridekh, A., and El Mansouri, B.: A Multi-Objective Cost Minimization Framework for Managed Aquifer Recharge Integrating Pareto Optimization and Least-Cost Path Analysis, EGU General Assembly 2026, Vienna, Austria, 3–8 May 2026, EGU26-5340, https://doi.org/10.5194/egusphere-egu26-5340, 2026.

EGU26-11154 | ECS | Posters virtual | VPS21

Choosing an I/O approach for Earth system models: lessons learned from a modular I/O server for MESSy 

Aleksandar Mitic, Patrick Jöckel, Astrid Kerkweg, Kerstin Hartung, Bastian Kern, and Moritz Hanke

Modern Earth system models increasingly hit I/O limits—not only in performance, but also in reproducibility, maintainability, and developer productivity. As data volumes and workflows evolve, tightly coupled, file-centric I/O approaches can become hard to scale and hard to extend.

We present the design and lessons learned from introducing an asynchronous, modular I/O server concept in the Modular Earth Submodel System (MESSy). I/O operations were decoupled from the Fortran-based scientific core and implemented as separate Python services, where the communication between the two components was implemented using the Yet Another Coupler (YAC) library. This architecture was chosen to improve flexibility and long-term maintainability, while enabling heterogeneous workflows and evolving storage backends.

Using MESSy as a case study, we discuss practical decision criteria for selecting an I/O concept in large models (e.g., scaling behavior, accessibility for developers, testing and CI strategies, and reproducibility).  We conclude with lessons learned from bridging Fortran and Python communities and from lowering entry barriers for user-developers in a large modeling system.

How to cite: Mitic, A., Jöckel, P., Kerkweg, A., Hartung, K., Kern, B., and Hanke, M.: Choosing an I/O approach for Earth system models: lessons learned from a modular I/O server for MESSy, EGU General Assembly 2026, Vienna, Austria, 3–8 May 2026, EGU26-11154, https://doi.org/10.5194/egusphere-egu26-11154, 2026.

EGU26-13270 | Posters virtual | VPS21

Integrating Participatory Perception-Mapping Data and Stochastic Image Analysis for Urban Landscape Assessment 

Stavroula Kopelia, Nikos Tepetidis, Julia Nerantzia Tzortzi, G.-Fivos Sargentis, and Romanos Ioannidis

Modern digital technologies and geoinformatics have experienced rapid growth, offering powerful tools to bridge the gap between scientific communities and society in landscape assessment and mapping. This research details the application of a crowdsourcing scheme that utilizes a dedicated mobile application to facilitate direct public participation in quantifying perceptions of urban landscapes and architecture. Initially developed as an educational tool, the methodology has been tested by university students across Italy, Greece, and France, providing a foundational phase for assessing landscape quality and urban typologies. Building upon these educational pilot studies, the work explores the evolution of this methodology into a broader, multicultural citizen science initiative designed to improve the quality and quantity of available landscape perception data.

A significant technical advancement in this research involves the integration of automated image analysis to process the novel data generated by participants from any location. The photographic material was examined using stochastic image analysis based on climacograms, in which images are treated as two-dimensional grayscale intensity fields and analyzed across multiple spatial scales. The method enables the comparison of image patterns based on the visual complexity of the uploaded photographs. A primary challenge addressed was the algorithm's performance when processing real-world, non-curated smartphone images. The analysis began an assessment on how the methodology handles environmental noise, such as sky, trees, and unconventional capture angles, which are inherent to bottom-up crowdsourcing schemes.

The early results indicate that the method can reveal group-level tendencies associated with differing architectural characteristics, particularly in relation to visual complexity, while not supporting reliable classification at the level of individual image. In detail, the findings indicate a trend towards two categorizations: firstly, between modernist-type movements, characterized by minimal elements, and secondly between eclectic or decorative movements, which exhibited higher measured complexity; however, this this behaviour was not observed universally on all analyzed movements The stochastic analysis also indicated theoretical overlaps between certain movements, such as Postmodernism and Eclecticism, based on shared decorative patterns. While the results highlight that environmental factors can influence the analysis of individual photographs, the method utilized presents potential for distinguishing movement trends with logical consistency even from unfiltered data.

Scientifically, this yield of quantitative data sets the groundwork for improved research in the humanities and culture, showing a strong correlation with established landscape quality indices. Socially, the project provides a scalable model for participatory mapping that fosters critical thinking about urban quality, creating new conditions for communication between universities and the broader public. Overall, the presented work reports on the early-stage results of this methodological exploration and aims to evaluate the combined use of participatory mobile data collection and exploratory image-based analysis for landscape and architectural studies, while identifying key challenges related to data quality, interpretation, and future methodological refinement.

How to cite: Kopelia, S., Tepetidis, N., Tzortzi, J. N., Sargentis, G.-F., and Ioannidis, R.: Integrating Participatory Perception-Mapping Data and Stochastic Image Analysis for Urban Landscape Assessment, EGU General Assembly 2026, Vienna, Austria, 3–8 May 2026, EGU26-13270, https://doi.org/10.5194/egusphere-egu26-13270, 2026.

EGU26-13783 | Posters virtual | VPS21

Monitoring Land Cover Dynamics in Bahr Qarun District, Egypt, via Remote Sensing Data  

Abdelrahman Elsehsah, Abdelazim Negm, Eid Ashour, and Mohammed Elsahabi

Accurate monitoring of land cover is essential for sustainable environmental management and urban planning in arid regions. However, rapid changes in land use often make it difficult to distinguish between different surface types, such as urban areas and bare soil, using standard satellite data alone. This research examines land-use changes in the Bahr Qarun district of Fayoum, Egypt, during 2019, 2021, and 2023. The study used Sentinel-2 and Landsat OLI 8 satellite images taken each April to ensure data consistency. We applied the Maximum Likelihood (ML) method to classify Sentinel-2 images. They used 30 training samples for each land category to guide the process. The results achieved a Kappa coefficient above 75%, indicating a reliable level of accuracy. We measured vegetation using the Normalized Difference Vegetation Index (NDVI) and urban areas using the Normalized Difference Built-up Index (NDBI). A comparative analysis revealed that NDVI results were closely aligned with those obtained from supervised classification, reflecting its strong capability in accurately identifying vegetated areas. In contrast, NDBI exhibited a tendency to overestimate urban extent, primarily due to spectral confusion between built-up surfaces and bare soil within individual pixels. The study concludes that NDVI is an effective tool for mapping the green cover in this area.

Keywords: Land Cover Change, Sentinel-2, Landsat OLI 8, Supervised Classification,  Spectral Indices (NDVI & NDBI), Bahr Qarun, Egypt.

How to cite: Elsehsah, A., Negm, A., Ashour, E., and Elsahabi, M.: Monitoring Land Cover Dynamics in Bahr Qarun District, Egypt, via Remote Sensing Data , EGU General Assembly 2026, Vienna, Austria, 3–8 May 2026, EGU26-13783, https://doi.org/10.5194/egusphere-egu26-13783, 2026.

EGU26-13852 | ECS | Posters virtual | VPS21

Monitoring Shallow Water Depths: A Review of Satellite-Derived Bathymetry Methods 

Mohamed H. Abdalla, Hassan Elhalawany, Saad M. Abdelrahman, Abdelazim Negm, and Andrea Scozzari

Satellite-Derived Bathymetry (SDB) offers a cost-effective alternative to traditional shipborne surveys for mapping large coastal areas. This technique utilizes optical remote sensing data from multispectral sensors to estimate water depth. The fundamental principle relies on the behavior of light as it travels through the water column; as depth increases, light intensity decreases due to absorption and scattering. Different wavelengths penetrate to varying degrees, with blue light reaching the greatest depths while red light is absorbed quickly. By analyzing these spectral features, researchers can calculate underwater topography. Currently, SDB techniques are categorized into two primary groups: physically based (analytical) models, which simulate light propagation without needing local in-situ depth calibration, and statistical (empirical) models, which correlate satellite data with known depth measurements from nautical charts, ship-based acoustic surveys or airborne LiDAR.

While both approaches provide extensive spatial coverage at a lower cost, they are generally limited to clear, shallow waters, typically reaching depths of less than 20 meters. Analytical models are highly accurate but complex and data-intensive, whereas empirical models are more accessible but rely heavily on the quality of reference data. Recent advancements in machine learning have significantly improved the automation and performance of these empirical methods. This study evaluates the core concepts, advantages, and limitations of various SDB approaches, with a focus on Landsat-8 and Sentinel-2 data. Furthermore, the research details essential processes for empirical model calibration, validation, and detecting model bias. The findings emphasize that rigorous evaluation and bias correction are critical for ensuring the reliability of depth data in diverse coastal environments.

Keywords: Satellite-Derived Bathymetry, Remote Sensing, Empirical Models, Stumpf Algorithm, Coastal Waters, Model Bias Detection and Correction.

How to cite: Abdalla, M. H., Elhalawany, H., Abdelrahman, S. M., Negm, A., and Scozzari, A.: Monitoring Shallow Water Depths: A Review of Satellite-Derived Bathymetry Methods, EGU General Assembly 2026, Vienna, Austria, 3–8 May 2026, EGU26-13852, https://doi.org/10.5194/egusphere-egu26-13852, 2026.

EGU26-19784 | Posters virtual | VPS21

Operationalising Semantic Interoperability for Cross-domain Discovery with LUMIS 

Julien Homo, Christelle Pierkot, Kévin Darty, and Hakim Allem

Significant heterogeneity in metadata schemas, vocabularies, and ontologies hinders the discovery, reuse, and integration of European environmental data infrastructures across national and disciplinary boundaries. Recent initiatives have identified semantic interoperability as a vital enabler of FAIR data flows between infrastructures, paving the way for sophisticated, AI-driven, large-scale analyses.

Powered by OntoPortal technology, EarthPortal is a specialised catalogue of semantic resources (ontologies, thesauri and controlled vocabularies) for Earth and environmental sciences. It provides navigation, multi-ontology searching, mapping management, text annotation and recommendation services via web interfaces and REST APIs. These support data catalogues and repositories in an interoperable way.

EOSC LUMEN builds an interoperable discovery ecosystem across multiple domains (including Earth System Science, Social Sciences and Humanities, and Mathematics) to enable cross-platform search and meaningful reuse across communities. Rather than focusing only on metadata aggregation, LUMEN targets the practical enablers of interoperability that make resources discoverable and machine-actionable across infrastructures.

LUMIS (LUMEN Infrastructure for Semantics) is the shared semantic layer of LUMEN. It supports the end-to-end lifecycle of semantic artefacts (ontologies and controlled vocabularies, including SKOS resources) from scoping and requirements to implementation, publication and long-term maintenance. LUMIS focuses on governance, provenance, versioning and quality checks, while adopting an integration-first strategy: it connects and orchestrates established community tools (deployed services and/or API-based components) into coherent workflows, so that semantic resources can be created, aligned, validated and delivered in reusable forms for discovery platforms.

Integrating EarthPortal into LUMIS links a domain-specific semantic catalogue to a cross-domain discovery ecosystem. This enables repositories to annotate metadata using EarthPortal resources, while making use of LUMIS’s lifecycle-driven workflows and FAIR-aligned governance and quality checks.

In this presentation, we will demonstrate how integrating EarthPortal into the LUMIS platform supports more consistent semantic interoperability and FAIR-aligned practices across European Earth System Science infrastructures. We will showcase practical data workflows to enhance interdisciplinary research.

How to cite: Homo, J., Pierkot, C., Darty, K., and Allem, H.: Operationalising Semantic Interoperability for Cross-domain Discovery with LUMIS, EGU General Assembly 2026, Vienna, Austria, 3–8 May 2026, EGU26-19784, https://doi.org/10.5194/egusphere-egu26-19784, 2026.

EGU26-20391 | Posters virtual | VPS21

A Scalable, FAIR‑Aligned Data Lake Architecture for Earth System Modelling: From Heterogeneous Raw Archives to Curated, Metadata‑Rich, Analysis‑Ready Climate Data 

Bushra Amin, Jakob Zscheischler, Luis Samaniego, Jian Peng, Almudena García-García, and Toni Harzendorf

Modern Earth system research relies on integrating heterogeneous datasets such as reanalysis, satellite observations, in situ measurements, climate model ensembles, and reforecasts, yet these data are often stored in fragmented, inconsistent, and difficult to reuse forms. This limits reproducibility, slows modelling workflows, and constrains the development of operational digital twins for water and climate risk management.

This contribution presents a scalable, FAIR aligned data lake architecture implemented on the EVE high performance computing environment. The system transforms a large, unstructured source pool of more than two million files into a curated, duplication free, metadata rich repository designed for hydrological modelling, machine learning, and climate analytics. The architecture follows a four stage lifecycle: raw, curated, database ready, and ancillary GIS layers, reflecting data governance practices used by major climate centres.

A reproducible ingestion workflow classifies, deduplicates, and standardizes datasets from ERA5, ERA5 Land, MERRA 2, PRISM, E OBS, GPM IMERG, CMIP6, ISIMIP3, ECMWF reforecasts, MODIS, CHIRPS, GFED, GRDC, GSIM, and other sources. A Python based metadata extractor, built on CF convention standards, automatically captures variables, units, dimensions, spatial resolution, temporal coverage, coordinate reference systems, and checksums. Metadata are stored both as dataset level JSON and as a global inventory, enabling transparent provenance tracking and rapid dataset discovery.

The curated data hub is implemented under /data/db/earth_system and organized by scientific domain, temporal resolution, spatial extent, and processing stage. The system supports SLURM based workflows, HPC native processing, and cloud optimized formats such as Zarr.

This work demonstrates how a single researcher can design and operationalize a modern, HPC native data infrastructure that accelerates hydro climate research and forms the backbone of an emerging Digital Hydro Twin. The approach is transferable to institutions seeking to modernize their data ecosystems and improve reproducibility in environmental modelling.

How to cite: Amin, B., Zscheischler, J., Samaniego, L., Peng, J., García-García, A., and Harzendorf, T.: A Scalable, FAIR‑Aligned Data Lake Architecture for Earth System Modelling: From Heterogeneous Raw Archives to Curated, Metadata‑Rich, Analysis‑Ready Climate Data, EGU General Assembly 2026, Vienna, Austria, 3–8 May 2026, EGU26-20391, https://doi.org/10.5194/egusphere-egu26-20391, 2026.

Urban heat risk assessments increasingly require land surface temperature (LST) and near-surface air temperature at spatial scales that resolve microclimatic drivers such as material heterogeneity, shading, and complex terrain. While satellite thermal products and stationary air temperature observations provide essential regional and temporal context, their spatial resolution and coverage, as well as satellite revisit frequency, limit the quantification of surface thermal variability within urban blocks and campus-scale environments. Unmanned aerial vehicle (UAV) thermal imagery can bridge this scale gap, but quantitative LST retrieval remains sensitive to radiometric calibration, emissivity assumptions, local viewing geometry, geolocation accuracy, and acquisition-time atmospheric conditions.

This contribution develops and demonstrates a reproducible UAV thermal remote sensing workflow that converts raw thermal imagery into georeferenced LST mosaics over complex urban surfaces. Using a DJI Matrice 4T thermal sensor over a university campus in Sheffield, UK, thermal data were collected through multiple field surveys combining UAV flights with ground measurements collected alongside the flights. UAV flights were conducted in late June 2025, with flight planning targeting approximately 80% forward and side overlap. Raw thermal imagery derived from UAV was batch-converted using documented acquisition parameters informed by on-site conditions. Key factors include target distance, relative humidity, emissivity, and reflected apparent temperature,  applied consistently within each survey to support cross-frame comparability.  This research: (1) converts raw thermal imagery to georeferenced thermal outputs using ground-informed acquisition parameters (i.e. distance, humidity, emissivity, and reflected apparent temperature) to stabilise cross-frame temperature consistency; (2) reduces spatial distortions through co-registration with high-resolution basemaps, with a digital terrain model (DTM) used as an additional terrain reference; (3) accounts for surface emissivity variability by integrating land use/land cover and material proxies derived from complementary geospatial datasets, with high-resolution RGB orthomosaics used to derive land cover or material proxies (e.g., vegetation and pavements) that inform thermal processing parameters and support consistent interpretation of microscale thermal patterns.

The workflow delivers thermal remote sensing products at centimetre-level ground sampling distances and is designed to be transferable to other urban sites using standard UAV surveys and widely available geospatial datasets. By foregrounding calibration, emissivity handling, and quality control, this study strengthens the methodological basis for integrating UAV thermal observations into environmental remote sensing in urban settings, enabling more robust cross-scale interpretation of urban thermal patterns and supporting evidence-based decision making.

How to cite: Wang, J.: UAV thermal remote sensing for land surface temperature mapping in complex urban environments, EGU General Assembly 2026, Vienna, Austria, 3–8 May 2026, EGU26-21586, https://doi.org/10.5194/egusphere-egu26-21586, 2026.

EGU26-21793 | Posters virtual | VPS21

Hydrological Modelling of the Upper Senegal River Basin Using SWAT: Assessing the Impact of Multi-Source Precipitation Data on Model Performance 

Sidi Mohamed Boussabou, Soufiane Taia, Bouabid El Mansouri, Aminetou Kebd, Abdallahi Mohamedou Idriss, Hamza Legsabi, and Lamia Erraioui

The Upper Senegal River Basin is a strategic water resource system supporting agriculture, hydropower generation, and essential ecosystem services in West Africa. However, a comprehensive understanding of its hydrological dynamics remains constrained by the limited availability of in situ hydroclimatic observations. This study applies the Soil and Water Assessment Tool (SWAT) to simulate hydrological processes in the basin, with a particular emphasis on the influence of precipitation data sources on model performance and uncertainty. Hydrological simulations were conducted at six representative gauging stations (Bakel, Kayes, Gourbassy, Oualia, Bafing Makana, and Daka Saidou) over the period 1983–2021, using a combination of ground-based observations, satellite precipitation products, and reanalysis datasets (ERA5, MERRA-2, PERSIANN, and CHIRPS). Model calibration demonstrated satisfactory performance, with Nash–Sutcliffe Efficiency (NSE) values reaching up to 0.74 at upstream stations, while reduced performance was observed downstream. Validation results showed a moderate decline in model efficiency, highlighting the sensitivity of SWAT outputs to precipitation inputs and data uncertainty. The comparative analysis of precipitation datasets reveals substantial variability in simulated streamflow and water balance components, underscoring the importance of precipitation data selection in data-scarce regions. These findings highlight the need for robust, multi-source hydroclimatic data integration to improve hydrological modelling reliability and support informed water resource management decisions.

Keywords: Upper Senegal River, SWAT, Hydrological modelling, Precipitation uncertainty; Satellite rainfall; Reanalysis data.

How to cite: Boussabou, S. M., Taia, S., El Mansouri, B., Kebd, A., Mohamedou Idriss, A., Legsabi, H., and Erraioui, L.: Hydrological Modelling of the Upper Senegal River Basin Using SWAT: Assessing the Impact of Multi-Source Precipitation Data on Model Performance, EGU General Assembly 2026, Vienna, Austria, 3–8 May 2026, EGU26-21793, https://doi.org/10.5194/egusphere-egu26-21793, 2026.

EGU26-21965 | Posters virtual | VPS21

An EOSC Node Ireland Pilot Study: Bridging European and National e-Infrastructures for Reproducible Sentinel-2 Data Ingestion in Quarry Applications 

Flaithri Neff, Roberto Sabatino, Alfredo Arreba, and Jerry Sweeney

The establishment of the European Open Science Cloud (EOSC) places renewed emphasis on the role of national e-infrastructures in enabling standards-based, interoperable, and reusable research workflows in the EU. Within the context of Ireland’s EOSC Node, there is particular interest in demonstrating how European-scale open-data services can be digested by national research clouds, transformed into analysis-ready assets, and made available for both open research and applied industry use-cases. Earth Observation (EO) provides a strong test case, given the volume and complexity of the data involved, and its growing role in scalable environments that support operational decision-making.

This pilot project, QuarryLink, presents a Phase-1 study focused on building a reproducible EO data ingestion workflow that connects the Copernicus Data Space Ecosystem with the HEAnet Research Cloud, operating on the SURF Research Cloud platform. Through a real-world quarry case-study in the Dublin region (Ireland), the work demonstrates how EOSC-aligned principles, including auditable machine-readable workflows, can be applied from the outset of the EO research process. We will demonstrate how precise spatial boundaries can be defined and validated; how modern OAuth-based authentication mechanisms can be integrated into research cloud workflows; and how Sentinel-2 Level-2A products can be programmatically discovered, retrieved, and prepared for downstream analysis using current Copernicus services.

By executing the ingestion workflow on the HEAnet Research Cloud using open-source geospatial tooling, the pilot aims to establish an analytics-ready foundation for working with Sentinel-2 data in a reproducible research cloud environment. The resulting data products are structured to support downstream analysis, with compute resources accessed dynamically through the HEAnet Research Cloud workspace as required. Building on this foundation, Phase 2 will focus on developing time-series analyses, EO data cubes, and derived environmental indicators to support both research-driven investigation and applied monitoring scenarios in European quarry environments.

More broadly, the pilot seeks to illustrate how EOSC-aligned integration across data ingestion and compute layers can support open research practices while enabling scalable, real-world EO-enabled industrial applications, providing a practical pathway for national EOSC Nodes to translate open data into shareable analytics and societal impact.

How to cite: Neff, F., Sabatino, R., Arreba, A., and Sweeney, J.: An EOSC Node Ireland Pilot Study: Bridging European and National e-Infrastructures for Reproducible Sentinel-2 Data Ingestion in Quarry Applications, EGU General Assembly 2026, Vienna, Austria, 3–8 May 2026, EGU26-21965, https://doi.org/10.5194/egusphere-egu26-21965, 2026.

EGU26-22084 | ECS | Posters virtual | VPS21

Monitoring Groundwater Quality and Improvement in the Kima Area, Aswan 

Marwa Khairy, Ahmed S. Nour-Eldeen, Hickmat Hossen, Ismail Abd-Elaty, and Abdelazim Negm

Groundwater in arid regions is highly sensitive to human activity, especially when untreated wastewater interacts with shallow aquifers. This study evaluates the hydrogeochemical response of the Kima aquifer in Aswan, Egypt, following the Kima Drain Covering Project. The research uses an integrated framework of field measurements, geospatial analysis, and multi-criteria decision-making. The team analyzed groundwater samples from 2020 and 2025. They tested eleven physicochemical parameters and six irrigation indices. Spatial interpolation through Inverse Distance Weighting (IDW) helped map temporal variations and identify contamination hotspots. To classify water suitability, the study standardized values according to WHO and Egyptian guidelines. The Analytical Hierarchy Process (AHP) was used to determine the importance of various drinking and irrigation indicators. Finally, a Weighted Linear Combination (WLC) generated composite Groundwater Quality Index (GWQI) maps. The results show a significant improvement in groundwater quality after the drain was covered. Levels of TDS, chloride, sulfate, sodium, and magnesium decreased substantially across the area. The ionic balance shifted toward a more favorable calcium-magnesium-bicarbonate facies. Irrigation indices also improved, with most parameters falling into safe or excellent ranges. The 2025 GWQI map reveals a transition from "good–permissible" to "excellent–safe" zones. This confirms that eliminating direct seepage from the drain had a positive environmental impact. This integrated AHP–GIS–IDW approach is an effective tool for monitoring groundwater changes. It provides a robust decision-support system for managing water resources in arid urban environments.

How to cite: Khairy, M., S. Nour-Eldeen, A., Hossen, H., Abd-Elaty, I., and Negm, A.: Monitoring Groundwater Quality and Improvement in the Kima Area, Aswan, EGU General Assembly 2026, Vienna, Austria, 3–8 May 2026, EGU26-22084, https://doi.org/10.5194/egusphere-egu26-22084, 2026.

EGU26-3080 | ECS | Posters virtual | VPS22

Multibranch Adaptive Feature Fusion for Hyperspectral Image Classification 

Chen Li and Baoyu Du

Hyperspectral image (HSI) classification often struggles with feature interference across different scales and the inherent challenges of data imbalance and sample scarcity. While deep learning models have significantly advanced the field, traditional single-branch architectures often suffer from scale-related noise, where features from different receptive fields interfere with one another. To address this, we propose the Multibranch Adaptive Feature Fusion Network (MBAFFN). Our approach utilizes three parallel branches to independently extract scale-specific features, effectively decoupling the multiscale information to prevent interference. This architecture is enhanced by two specialized modules: Global Detail Attention (GDA) for capturing broad contextual dependencies and Distance Suppression Attention (DSA) for refining local pixel-level discrimination. Furthermore, a pixel-wise adaptive fusion mechanism is introduced to dynamically weigh and integrate these features, prioritizing the most relevant scales for final classification. The performance of MBAFFN was validated on four benchmark datasets: Indian Pines (IP), Pavia University (PU), Longkou (LK), and Hanchuan (HC). Compared to current state-of-the-art methods, our model improved Overall Accuracy (OA) by 0.91%, 1.71%, 0.86%, and 3.16% on the IP, PU, LK, and HC datasets, respectively. The significant improvement on the HC and PU datasets underscores the model’s robustness in scenarios with limited training samples and complex class distributions. These results, supported by detailed ablation studies, demonstrate that adaptive fusion and scale-specific branching are effective strategies for mitigating feature interference in hyperspectral analysis.

How to cite: Li, C. and Du, B.: Multibranch Adaptive Feature Fusion for Hyperspectral Image Classification, EGU General Assembly 2026, Vienna, Austria, 3–8 May 2026, EGU26-3080, https://doi.org/10.5194/egusphere-egu26-3080, 2026.

EGU26-3363 | ECS | Posters virtual | VPS22

In-situ Thermal Infrared Monitoring in an Urban Area: A Case Study of Micro-scale Thermal Transitions during Hot Weather Conditions in Athens, Greece. 

Odysseas Gkountaras, Chryssoula Georgakis, Thiseas Velissaridis, and Margarita Niki Assimakopoulos

Characterizing the thermal state of urban surfaces is fundamental for mitigating the impacts of the Surface Urban Heat Island (SUHI) effect. This study presents an intensive in-situ thermal infrared monitoring campaign in the high-density urban core of Athens, Greece. Utilizing a calibrated handheld TIR sensor (7.5–14 μm), surface temperatures were recorded across strategic locations in the center of Athens during hot weather conditions. The methodology emphasizes the critical role of material-specific parameterization, where thermographic data were post-processed to account for emissivity (ε) variations and surface temperature, ensuring high-fidelity measurements.

Experimental results reveal extreme thermal stress, with maximum surface temperatures reaching 56.0°C on conventional paving materials, while the mean ambient air temperature was close to 35.0°C during peak solar hours (13:00–18:00LT). Spatial analysis and visualization of the results were performed using QGIS, correlating thermal signatures with urban geometry, shading conditions, and vegetation density. The aim of this study was to highlight the significant cooling potential of specific urban materials and nature-based solutions.

How to cite: Gkountaras, O., Georgakis, C., Velissaridis, T., and Assimakopoulos, M. N.: In-situ Thermal Infrared Monitoring in an Urban Area: A Case Study of Micro-scale Thermal Transitions during Hot Weather Conditions in Athens, Greece., EGU General Assembly 2026, Vienna, Austria, 3–8 May 2026, EGU26-3363, https://doi.org/10.5194/egusphere-egu26-3363, 2026.

EGU26-3619 | ECS | Posters virtual | VPS22

Democratizing landslide detection for vulnerable regions beyond resource-intensive foundation models 

Rodrigo Uribe-Ventura, Willem Viveen, Ferdinand Pineda-Ancco, and César Beltrán-Castañon

Landslides claim thousands of lives and cause billions in economic losses annually, with impacts disproportionately concentrated in developing regions across Asia, Africa, and Latin America. Paradoxically, the current trajectory of artificial intelligence in geohazard detection—characterized by billion-parameter foundation models requiring substantial computational infrastructure—risks widening, rather than closing, the gap between technological capability and operational deployment where it is needed most. We argue that this paradigm requires fundamental reconsideration, proposing domain adaptation on strategically curated geological datasets as a more equitable and effective path toward globally accessible landslide detection systems.

Foundation models like the Segment Anything Model (SAM), pre-trained on over one billion masks, demand computational resources—312 million parameters, 1,376 GFLOPs per inference, specialized GPU infrastructure—that remain inaccessible to disaster management agencies in resource-constrained regions. Beyond these practical constraints, we contend that the apparent generalization capabilities of such models reflect pattern coverage in training data rather than emergent understanding transferable to geological contexts. The SA-1B dataset, despite its scale, was not curated to systematically represent landslide morphological diversity, creating coverage gaps for rare failure types, unusual triggering mechanisms, and underrepresented terrain configurations precisely where robust detection is operationally critical.

Given these limitations, we propose that effective generalization for geological applications emerges not from architectural scale but from strategic coverage of domain-relevant pattern space. We developed and tested GeoNeXt, a lightweight architecture that exploits the hierarchical transferability of geological features through targeted domain adaptation. Low-level representations (edges, spectral gradients) transfer universally across sensors and terrain; mid-level patterns (drainage networks, slope morphology) require adaptation to local expressions; and high-level configurations (failure geometries, trigger signatures) demand targeted training. Our results showed that this approach outperformed SAM-based methods across three independent benchmarks while requiring 10× fewer parameters (32.2M versus 312.5M) and a 62% reduction in computational cost. Zero-shot transferability to geographically distinct test sites (74–78% F1 score) emerged from the training dataset's systematic morphological diversity rather than parameter count. Inference at 10.6 frames per second on standard hardware, versus 3.0 frames per second for foundation model alternatives, transforms theoretical capability into deployable technology for resource-constrained environments. These findings suggest that strategic domain adaptation, rather than architectural scale, offers the most viable path toward operational landslide detection in vulnerable regions.

How to cite: Uribe-Ventura, R., Viveen, W., Pineda-Ancco, F., and Beltrán-Castañon, C.: Democratizing landslide detection for vulnerable regions beyond resource-intensive foundation models, EGU General Assembly 2026, Vienna, Austria, 3–8 May 2026, EGU26-3619, https://doi.org/10.5194/egusphere-egu26-3619, 2026.

EGU26-6022 | ECS | Posters virtual | VPS22

Geo2Gmsh: A Scalable Workflow for Automated Mesh Generation of Geological Models Using Gmsh 

Harold Buitrago, Juan Contreras, and Florian Neumann

Numerical modeling is a fundamental tool for understanding physically driven processes in geosciences. In multiparametric settings, the Finite Element Method is widely used because it can accommodate irregular geometries and complex boundary conditions. However, this advantage critically depends on the quality of the computational mesh, which must faithfully represent geological features such as faults, stratigraphic interfaces, and wells. In practice, mesh generation remains a major bottleneck, requiring specialized expertise and significant manual effort. We present Geo2Gmsh, an automated, lightweight workflow built on Gmsh (Geuzaine & Remacle, 2009), that generates geological meshes directly from simple text‐based descriptions of topological elements, including surfaces, lines, and points. These elements correspond to geologically meaningful features, allowing users to define faults, horizons, wells, and domain boundaries in a transparent, reproducible, and solver‐independent way. The workflow is demonstrated using two contrasting case studies: (1) Ringvent, an active sill‐driven hydrothermal system in the Guaymas Basin, and (2) the Eastern Llanos Basin, a foreland basin in eastern Colombia. To evaluate solver compatibility, we solved the heat equation in SfePy (https://sfepy.org/doc-devel/index.html) using the Eastern Llanos Basin model as the computational domain. Although the simulation is illustrative and not calibrated to observations, it confirms that meshes produced by Geo2Gmsh can be readily incorporated into numerical solvers. By explicitly embedding wells, faults, and geological interfaces in the mesh, Geo2Gmsh enables boundary conditions to be applied directly to physically meaningful features and allows model outputs to be extracted along them, simplifying both model setup and post‐processing. Meshes can be exported in standard formats (e.g., VTK, MSH, and Exodus via meshio), ensuring broad interoperability. Overall, Geo2Gmsh provides a lightweight, scalable, and reproducible workflow that dramatically lowers the technical barrier to geological mesh generation. This contribution establishes a practical foundation for reproducible, open-source numerical modeling in geosciences, facilitating the integration of geological knowledge into high-fidelity computational simulations.

How to cite: Buitrago, H., Contreras, J., and Neumann, F.: Geo2Gmsh: A Scalable Workflow for Automated Mesh Generation of Geological Models Using Gmsh, EGU General Assembly 2026, Vienna, Austria, 3–8 May 2026, EGU26-6022, https://doi.org/10.5194/egusphere-egu26-6022, 2026.

EGU26-6232 | Posters virtual | VPS22

Application of advanced lossy compression in the NetCDF ecosystem for CONUS404 data 

Shaomeng Li, Allison Baker, and Lulin Xue

Many geoscientific datasets, such as those produced by climate and weather models, are stored in the NetCDF file format.  These datasets are typically very large and often strain institutional data storage resources. While lossy compression methods for scientific data have become more studied and adopted in recent years, most advanced lossy approaches do not work easily and/or transparently with NetCDF files. For example, they may require a file format conversion or they may not work correctly with “missing values” or “fill values” that are often present in model outputs.  While lossy quantization approaches such at BitRound and Granular BitRound have built-in support by NetCDF and are quite easy to use, such approaches are generally not able to reduce the data size as much as more advanced compressors (for a fixed error metric), like SPERR, ZFP, or SZ3.

We are particularly interested in reducing the data size of the CONUS404 dataset.  CONUS404 is a publicly available unique high-resolution hydro-climate dataset produced by Weather Research and Forecasting (WRF) Model simulations that cover the CONtiguous United States (CONUS) for 40 years at 4-km resolution (a collaboration between NSF National Center for Atmospheric Research the U.S. Geological Survey Water Mission Area). 

Here, we investigate one advanced lossy compressor, SPERR [1], together with its plugin for NetCDF files, H5Z-SPERR [2], in a Python-based workflow to compress and analyze CONUS404 data.  SPERR is attractive due to its support for quality control in terms of both maximum point-wise error (PWE) and peak signal-to-noise ratio (PSNR), enabling easy experimenting of storage-quality tradeoffs. Further, given a target quality metric, previous work has shown that SPERR likely produces the smallest compressed file size compared to other advanced compressors. It leverages the HDF5 dynamic plugin mechanism to enable users to stay in the NetCDF ecosystem with minimal to no change to existing analysis workflows, whenever a typical NetCDF file is able to be read. And, importantly for our work, the SPERR plugin supports efficient masking of “missing values,” which are common to climate and weather model output.  The support for missing values enables compression on many variables which are not naturally handled by other advanced compressors that rely on HDF5 plugins. Further, because H5Z-SPERR directly handles missing values, they can be stored in a much more compact format (and are restored during decompression), further improving compression efficiency. (Note that built-in NetCDF quantization approaches can work with missing values.) 

Our experimentation demonstrates the benefit of enabling advanced lossy (de)compression in the NetCDF ecosystem: adoption friction is kept at the minimum with little change to workflows, while storage requirements are greatly reduced.


[1] https://github.com/NCAR/SPERR

[2] https://github.com/NCAR/H5Z-SPERR

How to cite: Li, S., Baker, A., and Xue, L.: Application of advanced lossy compression in the NetCDF ecosystem for CONUS404 data, EGU General Assembly 2026, Vienna, Austria, 3–8 May 2026, EGU26-6232, https://doi.org/10.5194/egusphere-egu26-6232, 2026.

EGU26-11945 | Posters virtual | VPS22

SEPNET: a multi-task deep learning framework for SEP forecasting 

Yang Chen, Yian Yu, Lulu Zhao, Kathryn Whitman, Ward Manchester, and Tamas Gombosi

Solar phenomena such as flares, coronal mass ejections (CMEs), and solar energetic particles (SEPs) are actively monitored and assessed for space weather hazards. In recent years, machine learning has demonstrated considerable success in solar flare forecasting. Accurate SEP forecasting remains challenging in space weather monitoring due to the complexity of SEP event origins and propagation. We introduce SEPNET, an innovative multi-task neural network that integrates forecasting of solar flares and CME summary statistics into the SEP prediction model, leveraging their shared dependence on space-weather HMI active region patches (SHARP) magnetic field parameters. SEPNET incorporates long short-term memory and transformer architectures to capture contextual dependencies. The performance of SEPNET is evaluated on the state-of-the-art SEPVAL SEP dataset and compared with classical machine learning methods and current state-of-the-art pre-eruptive SEP prediction models. The results show that SEPNET achieves higher detection rates and skill scores while being suitable for real-time space weather alert operations.

How to cite: Chen, Y., Yu, Y., Zhao, L., Whitman, K., Manchester, W., and Gombosi, T.: SEPNET: a multi-task deep learning framework for SEP forecasting, EGU General Assembly 2026, Vienna, Austria, 3–8 May 2026, EGU26-11945, https://doi.org/10.5194/egusphere-egu26-11945, 2026.

EGU26-12633 | Posters virtual | VPS22

Monitoring Long-term Vegetation Phenology across Europe Using Satellite NDVI Time Series (PKU GIMMS) 

Caterina Samela, Vito Imbrenda, Rosa Coluzzi, and Maria Lanfredi

Large-scale and long-term satellite observations are essential for environmental monitoring and for detecting gradual ecosystem responses to climate variability and land-use change.

This study presents a remote sensing–based framework to characterize vegetation phenology and its stability across Europe over four decades (1982–2022), using the temporally consistent and cross-sensor-calibrated PKU GIMMS NDVI dataset. The framework integrates NDVI time-series analysis with a newly developed Phenology Variability Index (PVI), designed to assess phenological stability at climatic scales and to complement established methods. Monthly NDVI time series are analyzed using non-parametric statistical tests and long-term mean seasonal profiles to delineate phenologically coherent regions through spatial clustering. Land Surface Phenology (LSP) metrics and the Phenology Variability Index are subsequently derived to characterize seasonal timing, trends, and phenological stability within and across regions. In this way, we integrate spatially explicit, pixel-level NDVI statistics and PVI-based evaluations with analyses of phenologically homogeneous clusters, providing a comprehensive understanding of vegetation dynamics across ecosystems.

Five spatially coherent clusters were identified, each characterized by distinct seasonal signatures linked to major European eco-climatic zones. Results reveal pronounced spatial and temporal heterogeneity, with consistent greening trends in temperate, montane, and Mediterranean regions, weaker and seasonally constrained greening in semi-arid areas, and largely stable winter NDVI conditions in mountainous forests and continental regions. LSP metrics indicate shifts in the timing and duration of the growing season, reflecting combined effects of climate variability and land-use change. The PVI further highlights higher phenological stability in Mediterranean and semi-arid landscapes, contrasted with greater variability in temperate and montane ecosystems.

Overall, this study demonstrates how long-term, high-temporal-resolution satellite data can support ecosystem assessment and environmental monitoring across continental scales. The proposed framework provides a transferable and robust methodological basis for analyzing vegetation dynamics, contributing to remote sensing–driven environmental monitoring and climate change research.


Keywords:
Remote sensing; Environmental monitoring; Vegetation dynamics; NDVI time series; Europe; Phenology Variability Index (PVI); Monthly trend analysis; Land Surface Phenology.

How to cite: Samela, C., Imbrenda, V., Coluzzi, R., and Lanfredi, M.: Monitoring Long-term Vegetation Phenology across Europe Using Satellite NDVI Time Series (PKU GIMMS), EGU General Assembly 2026, Vienna, Austria, 3–8 May 2026, EGU26-12633, https://doi.org/10.5194/egusphere-egu26-12633, 2026.

EGU26-13611 | ECS | Posters virtual | VPS22

Evaluating the combined potential of VSWIR and Thermal Infrared data for soil characterisation. 

Francesco Rossi, Raffaele Casa, Luca Marrone, Saham Mirzaei, Simone Pascucci, and Stefano Pignatti

Quantifying soil properties such as Soil Organic Carbon (SOC), texture, and Calcium Carbonate (CaCO3) is essential for assessing soil health and ensuring food security. While Visible, Near Infrared, and Short Wave Infrared (VSWIR) remote sensing is a standard operational tool, the Longwave Infrared (LWIR, 8-14 μm) offer complementary information on mineralogy and moisture that are still not yet fully explored for this specific application. This study investigates the synergy between VSWIR and LWIR data that will be available with future hyperspectral satellite missions. Among them, the European Space Agency's Copernicus Expansion missions that will add to the EO capacity the Hyperspectral Imaging Mission for the Environment (CHIME) and Land Surface Temperature Monitoring (LSTM) mission. Alongside are the NASA's Surface Biology and Geology (SBG and SBG-TIR) missions.

The research focuses on Jolanda di Savoia (Italy), an agricultural landscape resulting from land reclamation projects in the late 19th century. Ground truth data were collected during a field campaign on June 22, 2023, providing 59 topsoil samples further analysed for SOC, texture, and CaCO3. Field campaign was coincident with an airborne survey carried out with the LWIR Hyperspectral Thermal Emission Spectrometer (HyTES) sensor. HyTES captured data across 256 spectral bands from 7.5 to 11.5 μm, providing a pixel size of approximately 2.3 meters.

To evaluate the multi-frequency potential, we developed a workflow combining a soil composite from PRISMA (VSWIR) satellite time-series with simulated SBG-TIR (LWIR) data. The SBG-TIR simulation chain included as input a surface emissivity map derived from the airborne HyTES survey. To cover the LWIR wide spectral range (up to 12 µm), the emissivity spectrum was extended using an autoencoder neural network procedure trained on the ECOSTRESS Soil Spectral Library. Top-Of-Atmosphere (TOA) radiance was then simulated using the Radiative Transfer for the TIROS Operational Vertical Sounder (RTTOV-14) model, incorporating the optical depth and cloud/aerosol optical properties coefficients specific to SBG-TIR. Furthermore, these simulated data were atmospherically corrected to produce the target satellite emissivity products according to the TES algorithm.

Soil properties prediction models were developed using supervised machine learning algorithms. We benchmarked two scenarios: 1) the proposed combined approach using PRISMA and the simulated SBG-TIR L2 emissivity product; and 2) a VSWIR-only approach using PRISMA. A quantitative assessment by 10-fold cross-validation using common literature metrics (R², RMSE, RPD) highlighted the benefits of the multi-sensor approach. For SOC retrieval, the standalone VSWIR (PRISMA) model yielded an R2 of 0.55 (RPD = 1.5), while the synergistic integration of PRISMA with simulated SBG-TIR data improved the retrieval accuracy, reaching an R2 of 0.65 and increasing the RPD to 1.69. This work indicates that, on the agricultural test site of Jolanda di Savoia, the combined use of SVWIR and LWIR spectral range slightly improves the SOC retrieval. Further validation across diverse agricultural scenarios will be essential to test the real advantage of combining next-generation imaging spectroscopy missions.

How to cite: Rossi, F., Casa, R., Marrone, L., Mirzaei, S., Pascucci, S., and Pignatti, S.: Evaluating the combined potential of VSWIR and Thermal Infrared data for soil characterisation., EGU General Assembly 2026, Vienna, Austria, 3–8 May 2026, EGU26-13611, https://doi.org/10.5194/egusphere-egu26-13611, 2026.

EGU26-14855 | Posters virtual | VPS22

Benchmarking UAV multispectral sensors and machine learning for water quality estimation 

Caio Mello, Daniel Salim, Bernardo Souza, Gabriel Pereira, and Camila Amorim

The sustainable management of water resources in anthropogenic contexts requires a holistic transition from mere monitoring to comprehensive assessments of water habitats. Urban reservoirs are particularly vulnerable ecosystems, where pressures such as agricultural runoff and untreated sewage discharge drive eutrophication, compromising water quality. Traditional monitoring methods often lack the spatiotemporal resolution required to capture the complex dynamics of these environments. To address this gap, this study evaluates the efficacy of close-range remote sensing combined with Machine Learning (ML) and Explainable Artificial Intelligence (XAI) for estimating optically active water quality parameters (turbidity, chlorophyll-a, and phycocyanin). The research was conducted at the Ibirité Reservoir (Minas Gerais, Brazil), a highly eutrophic urban system serving as a petrochemical industry water supply. Ten monthly field campaigns (August 2024 to May 2025) were conducted, covering both dry and wet seasons, to capture seasonal variability. Data acquisition employed Unmanned Aerial Vehicles (UAVs) equipped with two distinct multispectral sensors: the DJI Phantom 4 Multispectral (P4M – 5 bands) and the MicaSense RedEdge Dual-P (MSR – 10 bands). This setup allowed for a comparative analysis of spectral resolution impacts on model performance. The methodology tested three ML algorithms: Random Forest, CatBoost, and XGBoost. To ensure physical consistency, SHAP (SHapley Additive exPlanations) values were used to interpret the models. This ML-XAI approach assessed: (1) the comparative performance of each sensor and algorithm; and (2) the robustness of the models by identifying the most influential spectral bands for each parameter. Results indicate that ensemble learning algorithms, specifically Random Forest and CatBoost, consistently outperformed others across datasets. The MSR sensor achieved the highest overall accuracy, particularly for Phycocyanin estimation using Random Forest (R² = 0.93), compared to the P4M's best result for the same parameter (R² = 0.90). Explainable AI analysis revealed the physical drivers behind this performance: for Phycocyanin, the MicaSense models relied heavily on the specific 717 nm and 705 nm (RedEdge) bands. This explains the superior performance, as these narrow bands better resolve the specific spectral features of cyanobacteria compared to the single RedEdge band available on the DJI sensor. Conversely, for Chlorophyll-a, the NIR (842 nm) and Red (650 nm) bands were the dominant predictors. Since both sensors possess these bands, the performance gap was narrower (R² = 0.79 for MSR vs. 0.77 for P4M), validating the cost-effectiveness of the 5-band sensor for general pigment monitoring. However, for Turbidity, the additional spectral resolution of the MSR (specifically the 717 nm band) proved decisive, raising accuracy to R² = 0.84 compared to 0.78 for the P4M. Findings demonstrate that integrating high-resolution multispectral sensing with interpretable ensemble learning offers a scalable and physically consistent tool for monitoring water habitat health, supporting data-driven decision-making in complex urban environments.

How to cite: Mello, C., Salim, D., Souza, B., Pereira, G., and Amorim, C.: Benchmarking UAV multispectral sensors and machine learning for water quality estimation, EGU General Assembly 2026, Vienna, Austria, 3–8 May 2026, EGU26-14855, https://doi.org/10.5194/egusphere-egu26-14855, 2026.

Accurate high resolution wind field prediction is essential for wind resource as-
sessment, renewable energy planning, and regional weather analysis. Although
Numerical Weather Prediction (NWP) models such as the Weather Research
and Forecasting (WRF) model provide physically consistent wind forecasts, their
outputs often suffer from systematic biases arising from uncertainties in surface
characteristics, simplified physical parameterizations, and resolution limitations.
Furthermore, increasing model resolution to the kilometer scale significantly
raises computational cost. To address these challenges, this study presents a
machine learning–based framework for bias correction of WRF-simulated wind
fields over the Southern Tamil Nadu region, with particular focus on the Mup-
pandal wind farm area.
An extensive validation of WRF configurations was first performed using mul-
tiple physics scheme combinations and domain setups, evaluated against ERA5
reanalysis data. The optimal configuration was identified and used to gener-
ate three years (2023–2025) of wind simulations at 3 km × 3 km resolution.
Significant biases were observed in the raw WRF outputs, motivating the appli-
cation of an Artificial Neural Network (ANN) based bias correction approach.
A Random Forest algorithm was employed for feature selection, followed by
Principal Component Analysis (PCA) to reduce dimensionality while retaining
95% of the variance. A feedforward neural network with multiple hidden layers
was trained to correct the U10 and V10 wind components, with the hyperbolic
tangent activation function yielding the best performance. The bias-corrected
wind fields exhibited substantial improvement in mean and extremes, achieving low error metrics and
strong correlation with ERA5 data.
The results demonstrate that combining physically based NWP simulations with
machine learning driven bias correction provides an accurate and computation-
ally efficient approach for generating high-resolution wind fields. This hybrid
framework offers significant potential for wind energy assessment and localized
meteorological applications in data-sparse regions.

How to cite: Pm, V. and Chakravarthy, B.: Bias Correction of Numerical Weather PredictionWind Fields in Southern Tamil Nadu RegionUsing Machine Learning Techniques, EGU General Assembly 2026, Vienna, Austria, 3–8 May 2026, EGU26-16232, https://doi.org/10.5194/egusphere-egu26-16232, 2026.

EGU26-22048 | Posters virtual | VPS22

Virtual Research Environment initiatives as part of ODATIS, the French Ocean data cluster 

Cyril Germineaud, Gwenael Caer, and Jean-François Piollé

As part of the French Ocean data cluster ODATIS (from the Data Terra Research Infrastructure), we will showcase the Virtual Research Enviroment (VRE) tools and services offered by CNES and Ifremer. In particular, we will present the CNES JupyterHub platform for hosting projects (high computing power with CPU and GPU capacities, very fast and optimized remote access to data products, etc.) together with altimetry specific Pangeo-based libraries, powerful tools, dedicated tutorials to illustrate simple use cases (intercomparison with different satellite data, cyclone monitoring, coastal water quality applications, etc.) and a technical support (helpdesk) for smooth sailing on the platform. In addition, the synergy between satellite and in-situ data will be also illustrated for several applications, such as surface currents, and comparisons between (BGC-)Argo profiling float observations and satellite matchups.

How to cite: Germineaud, C., Caer, G., and Piollé, J.-F.: Virtual Research Environment initiatives as part of ODATIS, the French Ocean data cluster, EGU General Assembly 2026, Vienna, Austria, 3–8 May 2026, EGU26-22048, https://doi.org/10.5194/egusphere-egu26-22048, 2026.

EGU26-4129 | ECS | Posters virtual | VPS23

Rapid Turbulence Evolution Resulting from Stable Shear layer and Atmospheric Gravity Wave Interactions 

Abhiram Doddi, David Fritts, and Thomas Lund

Early laboratory experiments of shear flow by Thorpe (Thorpe, 2002) provided evidence of Kelvin-Helmholtz Instability (KHI) billow interactions either due to misaligned adjacent billow cores or varying phases along the adjacent billow axes. Similar evidence has been found in the observations of tropospheric clouds, airglow, and Polar Mesospheric Clouds (PMC) imagery data in the mesosphere. Initial High-Resolution Direct Numerical Simulations (DNS) studies performed at Reynolds Number of 5000 (Fritts et al., 2021a, Fritts et al., 2021b) have demonstrated the that misaligned KH billow cores exhibit strong and complex vortex interactions inducing ‘Tubes and Knots’ (T&K) structures (Thorpe, 2002). These T&K structures were observed to accelerate transition to small-scale turbulence in contrast to previously known notable transitional mechanisms such as secondary KHI and convective instabilities emerging in individual KH billows. Also, the KHI T&K dynamics evidently yield intense turbulence dissipation rates contrasting that of secondary KHI and convective instabilities in billow cores.

More recent high-resolution imaging of OH airglow (Hecht et al., 2021) provide concrete evidence of KHI billows with wavelength ranging between 7-10 km modulated by atmospheric Gravity Waves (GWs) of dominant horizontal wavelengths ∼ 30km and oriented orthogonal to KH billow axes and propagate along the billow cores which result in apparent T&K dynamics rapidly driving KH billow breakdown. Similar evidence has been found in recent PMC imaging. This is the central theme of the idealized DNS discussed in this talk.

We conducted DNS studies to demonstrate the turbulence energetics of KHI billow interactions when subject to modulations due to monochromatic atmospheric gravity waves of small perturbation amplitudes and intrinsic frequency of N/5 (where N is the background Brunt-Vaisala Frequency). Preliminary analyses of our DNS results indicate that GW modes with modest amplitudes promote KHI billow misalignments resulting in complex multi-scale T&K dynamics fixed at specific GW phases. An increase in the GW amplitude resulted in noticeable reduction of KHI billow wavelengths further promoting KH billow misalignments. The resulting turbulence is expected to consist of broader scale ranges of intense turbulence dissipation rate and diffusivity.

References
[Fritts et al., 2021a] Fritts, D. C., Wang, L., Lund, T. S., and Thorpe, S. A. (2021a). Multi-Scale Dynamics of Kelvin-Helmholtz Instabilities . Part 1 : Secondary Instabilities and the Dynamics of Tubes and Knots. pages 1–27.

[Fritts et al., 2021b] Fritts, D. C., Wang, L., Thorpe, S. A., and Lund, T. S. (2021b). Multi-Scale Dynamics of Kelvin-Helmholtz Instabilities . Part 2 : Energy Dissipation Rates , Evolutions , and Statistics. pages 1–39.

[Hecht et al., 2021] Hecht, J. H., Fritts, D. C., Gelinas, L. J., Rudy, R. J., Walterscheid, R. L., and Liu, A. Z. (2021). Kelvin-Helmholtz Billow Interactions and Instabilities in the Mesosphere Over the Andes Lidar Observatory: 1. Observations. Journal of Geophysical Research: Atmospheres, 126(1):e2020JD033414. Publisher: John Wiley & Sons, Ltd.

[Thorpe, 2002] Thorpe, S. A. (2002). The axial coherence of Kelvin–Helmholtz billows. Quarterly Journal of the Royal Meteorological Society, 128(583):1529–1542. Publisher: John Wiley & Sons, Ltd.

How to cite: Doddi, A., Fritts, D., and Lund, T.: Rapid Turbulence Evolution Resulting from Stable Shear layer and Atmospheric Gravity Wave Interactions, EGU General Assembly 2026, Vienna, Austria, 3–8 May 2026, EGU26-4129, https://doi.org/10.5194/egusphere-egu26-4129, 2026.

EGU26-4184 | ECS | Posters virtual | VPS23

A Multi-Criteria GIS Framework for Socio-Economic Drought Risk Assessment across India 

Arun kumar Beerkur and Hussain Palagiri

Socio-economic drought represents the stage at which water stress translates into tangible disruptions to livelihoods, infrastructure, and economic systems, often preceding severe physical water shortages. In India, pronounced climatic variability combined with extreme physiographic heterogeneity leads to strong spatial contrasts in socio-economic vulnerability to drought. Despite this, most drought assessments in the country remain dominated by hydro-meteorological indicators, with limited integration of socio-economic exposure, sensitivity, and adaptive capacity.
This study develops a spatially explicit socio-economic drought risk assessment framework for India by integrating multi-dimensional climatic, environmental, and socio-economic indicators within a Geographic Information System (GIS). Thirteen indicators capturing water availability, agricultural productivity, infrastructure, population pressure, economic activity, and social deprivation are compiled from multi-source datasets and harmonized to a common spatial resolution. The indicators include available soil water, agricultural yield, livestock density, road density, population density, biomass, electricity consumption, Gross Domestic Product (GDP), global surface water availability, digital elevation model, groundwater availability, land use/land cover, and relative deprivation. Indicator weights are objectively derived using the Analytic Hierarchy Process (AHP), with consistency of expert judgments ensured through the consistency ratio criterion (CR < 0.1). A GIS-based weighted overlay approach is then employed to generate a composite socio-economic drought risk index, which is classified into four risk categories to identify spatial patterns and hotspots.
The resulting risk map reveals pronounced regional disparities, highlighting drought-prone agrarian and socio-economically marginalized regions as areas of elevated risk. The proposed framework offers a transferable and scalable decision-support tool for integrating socio-economic dimensions into drought monitoring and preparedness. By explicitly linking water stress to livelihood and infrastructure vulnerability, the study provides actionable insights for risk-informed planning, targeted mitigation, and long-term drought resilience in India.

How to cite: Beerkur, A. K. and Palagiri, H.: A Multi-Criteria GIS Framework for Socio-Economic Drought Risk Assessment across India, EGU General Assembly 2026, Vienna, Austria, 3–8 May 2026, EGU26-4184, https://doi.org/10.5194/egusphere-egu26-4184, 2026.

EGU26-4200 | ECS | Posters virtual | VPS23

Performance of Tapered Submerged Vanes in Mitigating Local Scour Around Bridge Piers 

Karmishtha Karmishtha, Rajesh Kumar Behera, and Gopal Das Singhal

Scour, defined as the erosion or removal of sediment from around bridge piers due to flowing water, remains one of the primary causes of hydraulic structure failures worldwide. Local scour around bridge piers poses a serious threat to bridge stability, particularly during high-flow events, as the development of downflow, horseshoe vortices, and wake vortices at the pier base leads to intense sediment removal and foundation instability. To address this challenge, the present study investigates the hydrodynamic behaviour and scour reduction performance of tapered submerged vanes installed upstream of a cylindrical bridge pier as an effective countermeasure against local scour. A combined numerical and experimental approach was adopted to evaluate the influence of tapered submerged vanes on flow structure and scour characteristics. Numerical simulations were carried out using FLOW-3D Hydro to analyse the three-dimensional flow field around the pier–vane system under steady clear-water conditions. The simulations focused on assessing velocity distribution, near-bed shear stress, vortex dynamics, and secondary flow patterns generated by the tapered vanes. Particular attention was given to the formation of leading-edge vortices (LEVs) and their role in modifying erosive flow structures near the pier foundation. Based on the numerical insights, a series of physical model experiments were conducted in a laboratory flume to quantify the scour reduction achieved by the tapered vanes. The experiments aimed to optimize the longitudinal and transverse placement of the vanes relative to the pier. The vanes were installed at a fixed longitudinal distance upstream of the pier, while transverse spacing was systematically varied to examine its effect on sediment transport and scour depth. Bed elevation profiles and maximum scour depths were measured after equilibrium scour conditions were attained. The results demonstrate that tapered submerged vanes significantly alter the near-bed flow field by generating localized leading-edge vortices that effectively deflect high-energy flow away from the pier base. This flow redirection weakens the horseshoe vortex and reduces near-bed shear stress in the vicinity of the pier. Among the tested configurations, the vane arrangement with a longitudinal spacing of 1.5D and transverse spacing of 2D exhibited the best performance, resulting in a 56% reduction in maximum scour depth compared to the no-vane case. Additionally, localized sediment deposition was observed upstream and downstream of the pier, indicating favourable redistribution of sediment induced by the vane-generated secondary currents. By integrating numerical modelling with experimental validation, this study provides valuable insights into the flow mechanisms and optimal placement strategies of tapered submerged vanes. The findings highlight their potential as a practical, efficient, and sustainable solution for mitigating local scour around bridge piers in alluvial channels.

Keywords: Scour, Submerged Vane, Horseshoe Vortices, Wake Vortices, Leading-Edge Vortex (LEV)

How to cite: Karmishtha, K., Behera, R. K., and Singhal, G. D.: Performance of Tapered Submerged Vanes in Mitigating Local Scour Around Bridge Piers, EGU General Assembly 2026, Vienna, Austria, 3–8 May 2026, EGU26-4200, https://doi.org/10.5194/egusphere-egu26-4200, 2026.

EGU26-4951 | ECS | Posters virtual | VPS23

CFD-Based Comparative Analysis of Conventional and Modified Piano Key Weirs for Improved Discharge Efficiency 

Anil Kumar, Ellora Padhi, and Surendra Kumar Mishra

The Piano Key Weir (PKW) has earned recognition for its adaptability for large discharges across weir types of varying heights and with small footprints. Therefore, it has the potential to be a substitute for linear weirs (space being a factor), Ouamane and Lempérière, (2006). Even with the above-mentioned advantages of PKWs, other geometries leave much to be desired. The rectangular PKW and the trapezoidal PKW illustrate a most common inefficiency example. Standard literature describes construction and operational shortfalls such as flowing separation at the inlet key, varying discharge and uneven velocities along the crest, vortex shedding and formation at the key intersections, dead zones in the inlet-outlet, zones of intensified energy dissipation, and lowering weir versatility at high flows. These challenges are combined to mean loss of efficiency in weir discharge capability. In response to these challenges, the present study introduces the Modified Piano Key Weir (MPKW) to assess its performance using 3D computational hydraulic modeling. The Volume of Fluid (VOF) methodology for free surface tracking and the Reynolds-Averaged Navier Stokes (RANS) for turbulence closure modeling characterize pressure gradients, flow accelerations in the several dimensions, and eddies. A systematic numerical investigation was conducted to compare the discharge efficiency of RPKW, TPKW, and MPKW across a range of steady inflow discharges: 0.030, 0.060, 0.090, 0.120, and 0.160 m³·s⁻¹. The MPKW demonstrated consistently superior discharge efficiency over both RPKW and TPKW for all tested cases, without requiring an increase in structural footprint or crest length. The highest relative improvement was observed at 0.060 m³·s⁻¹, which was therefore selected as a representative discharge for in-depth flow diagnostics. Discharge at 0.060 m³·s⁻¹ was applied to determine vorticity structures, turbulent kinetic energy (TKE), and energy dissipation to better understand the flow mechanisms that explain the efficiency of the weir. The MPKW design, with refined geometry and improved inlet–outlet design, rounded key transitions, and adjustable wall skew, was successful in mitigating flow separation at the key inlets and reducing the large-scale vortex formation at the key junctions. The modified sidewall skewed the internal recirculation, and as a consequence, TKE in the stagnation zones was less, and recirculation was more along the crests of the weir, thereby nullifying turbulent structures. While the breakdown of turbulence resulted in localized energy dissipation, the stabilization of the approach flow was improved because the process converted rotational energy of large eddies with a low energy loss to rapidly decaying eddies which do not sustain and produce a recycling of energy. Thus, less energy was concentrated in the vortex cells at the key junctions, the loss due to flow contraction was less, and the nappe cohesion over the crests was improved. MPKW, relative to other configurations, was characterized by a lower level of turbulence and vorticity at the junctions, a greater effective utilization of the crest, and improved pressure recovery. The results confirm MPKW as a hydraulically efficient and economically feasible solution for both new installations and retrofit applications under head or footprint constraints.

How to cite: Kumar, A., Padhi, E., and Mishra, S. K.: CFD-Based Comparative Analysis of Conventional and Modified Piano Key Weirs for Improved Discharge Efficiency, EGU General Assembly 2026, Vienna, Austria, 3–8 May 2026, EGU26-4951, https://doi.org/10.5194/egusphere-egu26-4951, 2026.

EGU26-5098 | ECS | Posters virtual | VPS23

A Geospatial and AHP-Based Approach for Delineating Groundwater Potential Zones in Vulnerable Groundwater Systems 

Pavithra Belluti Nanjundagowda and Vamsi Krishna Vema

Groundwater is the second largest reserve of fresh water and is an important resource that supports agriculture, industrial and domestic water supplies. Groundwater is facing unsustainable impacts by human activities over the years in different forms. The situation is aggravated by climate change which aggravates groundwater stress through variable precipitation leading to reduced recharge. Thus, highlighting the importance of assessing aquifer potential for sustainable groundwater management. The analysis was carried out in the Manjra and Maner sub-basins, of Godavari river basin, India where data-driven assessments remain limited. In this regard, the present research employs a Multi-Criteria Decision Analysis (MCDA) framework that integrates Geographic Information Systems (GIS) and the Analytical Hierarchy Process (AHP) to define groundwater potential zones (GWPZ) in the Manjra and Maner sub-basins. In a GIS environment, eight thematic layers—geology, land use/land cover, lineament density, drainage density, rainfall, soil, and slope—were examined. These factors were weighted using AHP, and combined using weighted overlay analysis. Area under the Curve (AUC), Receiver Operating Characteristic (ROC) analysis, and groundwater inventory data were used to validate the final GWPZ map. Five classifications of groundwater potential were identified for the research area: very low, low, moderate, high, and very high. The research region's predominance of moderate (45%) to high potential (28%) zones suggests that groundwater availability is generally fair to good. Priority locations for sustainable groundwater development and management are indicated by the high and very high potential zones.

How to cite: Belluti Nanjundagowda, P. and Vema, V. K.: A Geospatial and AHP-Based Approach for Delineating Groundwater Potential Zones in Vulnerable Groundwater Systems, EGU General Assembly 2026, Vienna, Austria, 3–8 May 2026, EGU26-5098, https://doi.org/10.5194/egusphere-egu26-5098, 2026.

EGU26-5765 | ECS | Posters virtual | VPS23

Research on the mechanical behaviors of multi-fractured blocky rock masses 

Kuan Jiang, Chengzhi Qi, and Xiaoyue Hu

Deep rock masses have complex internal structures, which results in significant discreteness and blocky structures. With the increase in the depth of engineering construction and energy extraction, the unique pendulum-type waves emerge in deep blocky rock masses under the action of dynamic loads from mining and blasting, and they are characterized by low frequency, low velocity, large displacement amplitude and high kinetic energy, distinguishing them fundamentally from conventional seismic waves. Pendulum-type waves can induce alternating stress states of relative compression and separation within blocky rock masses, and may lead to rockburst disasters and even engineering-induced seismicity, thus posing great challenges to the safety of underground engineering such as tunnel construction and mining. In this paper, experimental research is conducted on the mechanical behaviors and typical characteristics of pendulum-type waves of multi-fractured blocky rock masses under static and dynamic loads. Firstly, the strength, deformation and failure mode were analysized based on uniaxial compression tests. The weak structural layers will significantly reduce the uniaxial compressive strength and enhance the ultimate deformation capacity of rock masses. Fractured rock masses have significant nonlinear deformation and may develop macroscopic fractures (vertical splitting failure, with the failure mode transitioning from brittle failure to ductile failure) at the stress level significantly lower than their uniaxial compressive strengths. Subsequently, based on the dynamic impact tests, the dynamic response, overall displacement, wave velocity and the mechanism of anomalously low friction were investigated, and the typical characteristics of pendulum-type waves, including the low frequency (177 Hz and 153 Hz in this experiment, which are much lower than the natural frequency of the rock itself), low velocity (about 900 m/s in this experiment, which is significantly lower than those of P-waves and S-waves), large displacement amplitude (it is more than two orders of magnitude larger than the deformation of an intact rock under an identical load) and high kinetic energy (The total kinetic energy accounts for 40% and 28% of the total energy in this experiment, which has its particularity and cannot be ignored) were quantitatively described. This study holds significant research importance for understanding the nonlinear waves in deep fractured rock masses and their dynamic behaviors, as well as for preventing and controlling engineering disasters in deep rock masses.

How to cite: Jiang, K., Qi, C., and Hu, X.: Research on the mechanical behaviors of multi-fractured blocky rock masses, EGU General Assembly 2026, Vienna, Austria, 3–8 May 2026, EGU26-5765, https://doi.org/10.5194/egusphere-egu26-5765, 2026.

Predictability of river bank erosion in sinuous alluvial channels requires a combined study of the planform processes, hydraulics processes, sediment transportation, and the geotechnical properties of riverbanks. The research paper provides a detailed analysis of the evolution of channels within the Nabadwip-Kalna stretch of the Bhagirathi-Hooghly River (1990-2020). This analysis combines the synthesis of remote sensing, on-field surveys, lab experiments, and numerical model analysis into a multidimensional analysis. GIS was used through the Digital Shoreline Analysis System (DSAS) to measure changes on the bank-lines using historical satellite images of the same period of time. A two-dimensional migration coefficient (MC) model was used to model spatial-temporal changes in channel centrelines, and an RVR Meander was used to develop a model that takes into consideration depth-averaged flow velocity and reach-averaged hydraulic parameters. The characterisation of cross-sectional bathymetry and near-bank hydraulics was based on ADCP. The results of the geotechnical analysis showed that stratified streambanks showed critical shear stresses of 7.1-7.7 kPa, internal frictional angles of soils less than 30°–34°, and were predominantly affected by either cantilever collapse or piping as a result of varying maximum heights of streams between 5.7 and 6.8 metres. Bank stability through both BSTEM and BEHI was assessed, whereas sediment forecasting combined with SWAT to predict overbank flow and a Genetic Algorithm (GA) to estimate the total load. DSAS analysis on bank-line displacement revealed different erosion patterns within 170 transects, showing different RMSE of 0.090 to 0.162 in predicting zone boundaries. The MC method was able to model the 24-year centreline migration patterns, recording changes in the centreline-geometry parameters. Analysis of five cross-sections instrumented found instability and a factor-of-safety ratio of 0.81-0.95, resulting in 4.07-5.85m/yr and 4.35-7.15 km2/yr, respectively, lateral retreat and the eroded areas. Mean collapse rates were 0.125 to 0.198 m/yr, and the failure angle was 81°–87°. The maximum bank-failure mass was 41.24 kg (seasonal maximum), and the calibrated toe-scour mass was 0.28 kg. The GA model was tried using ten parameterisations and demonstrated the best prediction ability with the coefficient set at ten, where R2 = 0.96 and mean relative error (MRE) = 42% gave significantly better performance than the traditional regression analysis (R2 = 0.87 and MRE = 40%). There were also considerable changes in the area behind sandbar dynamics, that is, Nandai-Hatsimla increased by 11.87 ha in 1990 to 19.05 ha in 2020; Media by 39.7 ha to 57.68 ha; Char Krishnabati by 82.52 ha to 81.07 ha. Land-use/land-cover (LULC) predictions for 2040 indicated settlement expansion from 13.61% (2020) to 20.19%, with validation accuracy (RMSE = 0.253) confirming model reliability. This combined model shows that the combination of remotely sensed, field, laboratory, and model data provides quantitatively sound estimations of fluvial risks and forms the basis of evidence-based management of high-suspended riverine areas. The modular design can be applied to monsoon-dominated alluvial basins throughout the globe, which will promote adaptive land-use planning and long-term infrastructure development in the vulnerable riparian societies.

How to cite: Ghosh, A.: Unveiling integrated geo-hydraulic assessment of river meandering, bank erosion and sandbar dynamics in Alluvial channels, EGU General Assembly 2026, Vienna, Austria, 3–8 May 2026, EGU26-7917, https://doi.org/10.5194/egusphere-egu26-7917, 2026.

EGU26-8596 | ECS | Posters virtual | VPS23

Waveform signatures of acoustic emission from thermally and mechanically induced microfracture in centrally apertured basalt 

Arthur De Alwis, Mehdi Serati, Arcady Dyskin, Elena Pasternak, Derek Martin, and David Williams

Acoustic emission (AE) monitoring is widely applied to track damage development in brittle rock, although relating recorded signals to specific fracture mechanisms can remain uncertain, particularly when comparing thermal and mechanical loadings. This contribution presents a preliminary assessment of AE waveform characteristics measured during two heating-only experiments and two uniaxial compressive strength (UCS) experiments performed on 100 mm diameter basalt specimens containing a central axial circular hole. This geometry provides a consistent configuration that promotes stress redistribution and damage localisation around an opening, allowing fracture processes to be compared within a common specimen form.

Full AE waveforms were acquired throughout each test using broadband piezoelectric sensors coupled to the specimen surface, with pre-amplification and digital acquisition. Event features were extracted in the time and frequency domains, including rise angle, duration, hit counts, average frequency, peak frequency, peak amplitude, and amplitude distributions. Feature-space comparisons were then used to evaluate whether thermally and mechanically induced microfracturing exhibit separable signal characteristics.

The thermal experiments were associated with a single dominant fracture initiating along the shortest ligament between the aperture boundary and the nearest specimen edge. In contrast, UCS loading produced a more complex fracture network consistent with mixed tensile and shear microfracturing. Rise angle versus hits per duration plots indicated that thermal events occupied a more restricted region, whereas UCS events displayed a broader spread, which may reflect greater variability in source processes during complex damage evolution. Frequency-based comparisons further highlighted the differences: thermally induced events clustered mainly within a lower-frequency band (approximately 100-300 kHz), while the UCS tests exhibited an additional higher-frequency population (approximately 400-600 kHz), alongside the lower-frequency component. Amplitude distributions were also differed, with thermal events tending toward a narrower amplitude range relative to the wider distribution observed under UCS loading. Collectively, these observations suggest that the combined time-domain, frequency-domain, and amplitude-based AE features support mechanism-informed discrimination between thermally driven tensile fracture and mechanically driven complex fracture networks providing a basis for subsequent statistical or learning-based classification in coupled thermomechanical experiments

How to cite: De Alwis, A., Serati, M., Dyskin, A., Pasternak, E., Martin, D., and Williams, D.: Waveform signatures of acoustic emission from thermally and mechanically induced microfracture in centrally apertured basalt, EGU General Assembly 2026, Vienna, Austria, 3–8 May 2026, EGU26-8596, https://doi.org/10.5194/egusphere-egu26-8596, 2026.

EGU26-8813 | ECS | Posters virtual | VPS23

Assessment of Partial Blockage in Urban Drains for Flood Risk Reduction  

Aayusha Kumari Mishra, Hemant Kumar, and Rajendran Vinnarasi

Partial blockage in open channels and urban drainage systems is a common issue arising from debris accumulation, sediment deposition, and inadequate maintenance, often resulting in reduced flow capacity and increased flood risk. Despite its practical relevance, the hydraulic effects of partial blockage on flow behaviour are not well quantified through controlled experimental studies. This work aims to investigate the influence of partial blockage on flow characteristics in open channels and explore its implications for urban stormwater drainage systems.Laboratory experiments are carried out in a rectangular open-channel flume under steady flow conditions. Velocity measurements are obtained at multiple depths for unblocked conditions and for different partial blockage configurations. Blockages of varying size and location are introduced manually to represent realistic obstructions commonly observed in urban drains. The changes in velocity distribution, water depth, and flow-carrying capacity due to partial blockage are analysed to understand the hydraulic response of the system.

Based on these observations, relationships between blockage extent and hydraulic performance are developed to identify critical blockage conditions.The study framework is applied to urban stormwater drainage networks using SWMM modelling to extend the experimental findings to real-world applications. Blockage scenarios are simulated in selected channels to assess their impact on system performance and flooding behaviour.

The outcomes of this study provide experimental insight into blockage-induced hydraulic effects and highlight the importance of considering partial blockage in urban drainage analysis. The combined experimental and modelling approach offers a practical basis for improving flood risk assessment and maintenance planning in urban stormwater systems.

How to cite: Mishra, A. K., Kumar, H., and Vinnarasi, R.: Assessment of Partial Blockage in Urban Drains for Flood Risk Reduction , EGU General Assembly 2026, Vienna, Austria, 3–8 May 2026, EGU26-8813, https://doi.org/10.5194/egusphere-egu26-8813, 2026.

Rising flooding, which is exacerbated by both climate change and human behavior, demands proper identification of vulnerable zones. Conventional hydrological analysis can neglect geographical variability. In this study, a combined geospatial and decision-making process is used to determine the levels of vulnerability and risk of flooding in the Koshi River Basin in the state of Bihar.  The research work has developed a susceptible, vulnerable and risk map by integrating GIS, Remote Sensing and AHP. Weightings of eleven physical and hydrological factors and five socio-economic indicators were carried out in a systematic manner using a multi-criteria decision-making framework that allowed appropriate consideration of their relative contributions to flooding. Flood susceptibility, vulnerability and risk maps were created using the GIS environment's Weighted Overlay technique. According to the analysis, population density (41.6%) and literacy rate (24%) are controlling factors for flood vulnerability in the basin, whereas rainfall (23.9%), elevation (14.7%) and drainage density are the main elements that influence flood susceptibility. The Koshi basin is largely covered by the low and moderate classes of flood susceptibility, whereas a very minor amount (0.03%) comes under the high susceptibility classes, according to results from flood susceptibility maps. A significant section (42.87%) of the basin has moderate flood susceptibility due to a combination of exposure and socioeconomic characteristics, according to the results of the flood vulnerability analysis. According to the flood risk results, a significant amount of the basin (84.18%) has moderate flood risk, while a tiny portion has high flood risk in the low-lying, heavily inhabited areas close to the basin's riverbanks.  ROC-AUC for model validation yielded an accuracy of 66.3% and proved that the proposed GIS-AHP model was a reliable. Conclusion from this study underscore an integrating role in both physical and socio-economic considerations with prospects of enhancement through climate scenarios in flood mitigation and planning/early warning maps.

How to cite: Chaudhary, P. and Padhi, E.: Flood Hazard Analysis and Risk Assessment of Koshi River, Bihar (India) using Remote Sensing, GIS and AHP Techniques , EGU General Assembly 2026, Vienna, Austria, 3–8 May 2026, EGU26-8975, https://doi.org/10.5194/egusphere-egu26-8975, 2026.

EGU26-8985 | ECS | Posters virtual | VPS23

Non-linear rotational waves and complex rotation patterns in a chain of blocks with elbowing 

Maoqian Zhang, Arcady Dyskin, and Elena Pasternak

Block elbowing, the process in which rotating blocks push neighbouring blocks apart, influences both geological deformation and the stability of mining excavations in blocky rock masses. A clearer understanding of elbowing is essential for improving rock mass modelling and maintaining the safety of engineering structures. To this end, we analyse a chain of stiff blocks connected by springs, with one or two end active (driving) blocks – the blocks whose rotation is externally induced. All other - passive blocks - have translational and rotational degrees of freedom. The results show that block rotation is sequential (starting from driving blocks) producing a rotational wave with strongly configuration-dependent rotational patterns.

Opposite to a single driving block system, a double-driving block system exhibits more complex behaviour, as the active blocks may rotate in the same direction (Case I) or in opposite directions (Case II). In Case I passive blocks can exhibit anticlockwise rotation that is opposite to the clockwise rotating driving blocks, while in Case II all passive blocks do not rotate at all.

Further deformation patterns arise from block geometry, introduced by varying block corner rounding to represent spheroidal weathering. The results reveal a transition from reversible to irreversible passive block kinematics. Reversible responses include either clockwise rotation followed by full recovery or no rotation. The boundary between these types of block behaviour is defined by a linear relationship between the active-passive and passive-passive contact friction coefficients, with the intercept related to block corner rounding. In contrast, irreversible kinematics characterised by residual rotation emerge only for highly rounded blocks. This irreversible behaviour is restricted to short block chains and disappears in chains of five blocks suggesting a critical size of the Cosserat like zone with independent rotational degrees of freedom. This study provides new insights for modelling the stability and long-term evolution of blocky rock masses.

How to cite: Zhang, M., Dyskin, A., and Pasternak, E.: Non-linear rotational waves and complex rotation patterns in a chain of blocks with elbowing, EGU General Assembly 2026, Vienna, Austria, 3–8 May 2026, EGU26-8985, https://doi.org/10.5194/egusphere-egu26-8985, 2026.

The subject of this study is the process of hydraulic stimulation of a tectonic fault, leading to induced seismicity. We consider a scenario in which fluid injected near ​​an existing fault, causing a localized change in pore pressure and a reduction in effective stresses. This, in turn, initiates slippage of the fault segments and the formation of a slip zone, the size and slip velocity of which determine the magnitude of the resulting seismic events. The goal of this study was to develop a relatively simple model for estimating the potential magnitude of induced seismic events based on a limited set of governing parameters. The primary objectives of the study were to identify the key factors that have the greatest impact on the characteristics of the slip zone and to determine how fluid injection parameters (rate and injected fluid volume) affect earthquake magnitude by changing slip dynamics. The model obtained is based on the results of a series of numerical experiments analyzing the hydromechanical behavior of the fault under various injection conditions. The modeling was performed using a two-parameter rate-and-state friction law, which, unlike a single-parameter model, allows for a wider range of slip regimes to be simulated and accurately describes the transition from stable slip to dynamic failure.

The functional relationships were established between the initial system parameters and the key obtained slip characteristics. It was shown that the final slip zone length is almost linearly related to the length of the initial unstable zone, and the maximum slip velocity increases exponentially with increasing pore pressure rate. At the same time, in the area of high loading rates, the saturation of the sliding velocity is observed at a characteristic level, which leads to a limitation of the possible magnitudes of earthquakes induced by fluid injection.

How to cite: Turuntaev, S., Baryshnikov, N., and Riga, V.: Estimation of potential magnitudes of induced seismic events based on direct numerical simulation of fluid injection near an active tectonic fault., EGU General Assembly 2026, Vienna, Austria, 3–8 May 2026, EGU26-11339, https://doi.org/10.5194/egusphere-egu26-11339, 2026.

EGU26-13831 | ECS | Posters virtual | VPS23

From Empirical Assumptions to Data-Informed Decisions: A Reliable Water Storage Soil Depth Estimation Method 

Damodar Sharma, Surendra Kumar Mishra, and Rajendra Prasad Pandey

Efficient water use in agriculture is crucial for sustainable water resource management, especially in areas experiencing increasing water scarcity. A critical yet often oversimplified component of irrigation planning is the estimation of water storage soil profile depth, commonly assumed to be 1-1.5 m as the root-zone depth based on practitioner experience rather than validated soil-water dynamics. Such assumptions introduce uncertainty and limit the reliability of irrigation scheduling decisions. This study presents a novel framework for estimating soil profile depth to store maximum water by integrating Richards’ equation, geotechnical soil column concepts, and the Soil Conservation Service Curve Number (SCS-CN) technique to derive an optimal soil profile depth that maximizes storage capacity based on measurable hydraulic and retention soil properties. By linking the water storage soil column depth with the SCS-CN parameter, for practical field applications such as irrigation scheduling and planning. The proposed framework improves model reliability and interpretability by replacing fixed-depth assumptions with soil-specific storage behaviour, thereby reducing uncertainty in irrigation water estimation. It enables consistent evaluation of field capacity, average soil moisture content, and maximum storage potential across soil types, leading to improved irrigation efficiency. By emphasizing physically constrained model selection, data-informed parameterization, and transparent decision-making metrics, this work enhances the reliability of hydrologic modeling and supports robust irrigation management under water-scarce conditions.
Keywords:  Water storage soil profile depth, Richards’ equation, Irrigation water management, Data-informed parameterization, SCS-Curve Number method.

How to cite: Sharma, D., Mishra, S. K., and Pandey, R. P.: From Empirical Assumptions to Data-Informed Decisions: A Reliable Water Storage Soil Depth Estimation Method, EGU General Assembly 2026, Vienna, Austria, 3–8 May 2026, EGU26-13831, https://doi.org/10.5194/egusphere-egu26-13831, 2026.

EGU26-15102 | Posters virtual | VPS23

Anisotropic energy transfer rate quantified by LPDE and directional averaging methods in MHD turbulence 

Zhuoran Gao, Yan Yang, Bin Jiang, and Francesco Pecora

The energy cascade rate (ε) depicts the energy transfer in a turbulent system. In incompressible magneto-hydrodynamic (MHD)  turbulence, ε is linked to the third-order structure function (Yaglom vector) via the Yaglom/Politano–Pouquet law in the inertial range. In this study, we compare three estimators of ε in anisotropic MHD turbulence: (1) the lag polyhedral derivative ensemble (LPDE) technique that reconstructs the divergence of the Yaglom vector via tetrahedral linear gradients; (2) a directional-averaged third-order estimator that evaluates the Yaglom vector along a finite number of lag directions and averages over solid angle; and (3) the Yaglom vector on 60 degree with respect to the mean magnetic field direction.  To ensure a fair comparison in more realistic MHD turbulence, we emulate a multipoint virtual mission within anisotropic three-dimensional MHD simulations with a guide field B₀ along the z-axis. This work illuminates the reliable regime for LPDE and directional-averaging methods, and also tests whether 60 degree Yaglom vector is an accurate estimate of ε, providing practical guidance in both simulation and observational turbulence analysis.

How to cite: Gao, Z., Yang, Y., Jiang, B., and Pecora, F.: Anisotropic energy transfer rate quantified by LPDE and directional averaging methods in MHD turbulence, EGU General Assembly 2026, Vienna, Austria, 3–8 May 2026, EGU26-15102, https://doi.org/10.5194/egusphere-egu26-15102, 2026.

EGU26-16403 | ECS | Posters virtual | VPS23

Assessing the Impact of Digital Elevation Model Selection on Hydrological Predictions 

Prashant Prashant, Surendra Kumar Mishra, and Anil Kumar Lohani

Digital elevation models (DEMs) play a fundamental role in hydrological modeling by controlling watershed delineation, stream networks and runoff generation processes. This study assess the impact of global DEM product provided by Shuttle Radar Topography Mission SRTM and the Indian national CartoDEM developed by ISRO-Bhuvan (Indian Space Research Organisation-Bhuvan) on streamflow simulation using the Soil and Water Assessment Tool (SWAT) in the Ong River watershed (4650 sq. km), India. The study area is characterized by forest and cropland. Both DEMs, resampled to 30m resolution, were used as inputs to SWAT, along with meteorological data (IMD), land use/land cover data (Sentinel-2), and soil data (FAO). Streamflow data was sourced from Global Flood Awareness System discharge data (GloFAS). Model calibration (2011-2017) and validation (2018-2020) were performed using SWAT-CUP with the SUFI2 algorithm. Model performance was evaluated using Willmott's index of agreement, Nash-Sutcliffe Efficiency (NSE), R², PBIAS, and RSR. Results showed that both DEMs performed satisfactorily, with CartoDEM exhibiting slightly better performance (higher NSE and R², lower PBIAS and RSR) during both calibration and validation periods. Sensitivity analysis revealed that the runoff curve number was the most sensitive parameter, highlighting the impact of DEM selection on surface runoff simulation. The study concluded that CartoDEM is a preferable choice for hydrological modeling in similar catchments, though further research on stream accuracy and catchment delineation in diverse topographies can be explored.

How to cite: Prashant, P., Kumar Mishra, S., and Kumar Lohani, A.: Assessing the Impact of Digital Elevation Model Selection on Hydrological Predictions, EGU General Assembly 2026, Vienna, Austria, 3–8 May 2026, EGU26-16403, https://doi.org/10.5194/egusphere-egu26-16403, 2026.

EGU26-18007 | ECS | Posters virtual | VPS23

Effects of Flow Depth and Sediment Size on Near Bed Hydraulics and Sediment Mobility in Open Channel Flow 

Jyothi Banothu and Kamalini Devi

Accurate prediction of sediment mobility in open channel flows is essential for effective river engineering and sediment management. This study examines the combined influence of flow depth and sediment grain size on near bed hydraulics and sediment mobility using high-resolution Acoustic Doppler Velocimeter (ADV) measurements in a controlled laboratory flume. Experiments were conducted over uniform sand beds with median grain sizes of d₅₀ = 0.321 mm and d₅₀ = 0.81 mm under four different flow depths (12cm, 15cm,18cm,21cm) and a range of flow velocities. Three dimensional velocity components were measured at multiple vertical locations throughout the flow depth, while water surface elevations were continuously monitored. Depth resolved ADV data were used to compute mean streamwise velocity, Reynolds shear stress, friction velocity, and turbulent kinetic energy for each sediment size and flow depth. Sediment mobility was assessed using the Shields parameter, estimated from ADV-derived bed shear stress, and compared with the critical Shields parameter at multiple velocity points for each depth. The results indicate that coarser sediment beds exhibit increased near-bed turbulence intensity and higher friction velocity across all flow depths, while yielding lower Shields parameter values relative to finer sediment beds. Comparisons across the four flow depths reveal that sediment mobility transitions from stable to mobile conditions depending on the combined effects of flow depth, sediment size, and local velocity magnitude. At lower velocities, Shields parameter values remain below the critical threshold, indicating stable bed conditions, whereas higher velocities at the same depth result in Shields values exceeding the critical limit, signifying active sediment motion. Depth wise velocity and turbulence profiles demonstrate that both flow depth and sediment roughness significantly modify near-bed hydraulic structure and bed shear stress distribution. The findings highlight the importance of accounting for depth-dependent flow structure and sediment characteristics when evaluating sediment mobility. This study provides a robust experimental framework for identifying stable and mobile sediment regimes and estimating sediment transport potential using high-resolution ADV measurements without direct sediment transport observations.

How to cite: Banothu, J. and Devi, K.: Effects of Flow Depth and Sediment Size on Near Bed Hydraulics and Sediment Mobility in Open Channel Flow, EGU General Assembly 2026, Vienna, Austria, 3–8 May 2026, EGU26-18007, https://doi.org/10.5194/egusphere-egu26-18007, 2026.

Coastal port-city regions operate as intricate urban systems, where transport infrastructure, land-use change, environmental limits, and socio-economic forces interact across multiple spatial and temporal scales. In rapidly evolving coastal cities, port-led development may bring economic opportunities, but it also tends to introduce new environmental risks and social tensions. This duality is especially visible in cities where growth is unfolding faster than planning frameworks can adapt, which suggests a need for analytical approaches that are both integrated and spatially grounded. This study develops a multi-criteria spatial framework to assess land suitability and identify potential growth nodes along the Vizhinjam-Trivandrum corridor in southern India shaped by the development of the Vizhinjam International Seaport.

The framework integrates multi-temporal remote sensing data, geospatial indicators, and expert-derived weights using the Analytic Hierarchy Process (AHP) within a GIS environment. Land-use and land-cover dynamics from 2005 to 2025 are analysed alongside transport connectivity, environmental sensitivity, geo-hazard exposure, economic feasibility, and socio-regulatory constraints. These factors are represented as interconnected components of the urban system. To balance analytical rigour with practical applicability, literature-based indicators are consolidated into a concise hierarchical structure. This structure encompasses physical environmental, infrastructural, economic, and socio-community dimensions. Expert judgement is incorporated through structured pairwise comparisons, producing a transparent and reproducible weighting scheme.

The resulting analysis produces a spatial suitability surface that highlights development potential and constraints across the corridor. Early findings indicate that proximity to port infrastructure and transport connectivity strongly influence emerging growth patterns. At the same time, this advantage is often offset by environmental sensitivity and hazard exposure. These overlaps point to some of the core trade-offs that define port-city development, particularly in ecologically fragile coastal settings. By combining urban change monitoring with spatial decision-support analysis, the proposed framework demonstrates the value of integrated approaches for supporting sustainable and resilient development in complex coastal urban environments.

How to cite: Bala, D., Paul, S. K., and Yadav, A.: A Multi-Criteria Spatial Modelling Framework for Port-Urban Growth in a Coastal City System: The Vizhinjam-Trivandrum Corridor, India , EGU General Assembly 2026, Vienna, Austria, 3–8 May 2026, EGU26-18190, https://doi.org/10.5194/egusphere-egu26-18190, 2026.

EGU26-18481 | ECS | Posters virtual | VPS23

Assessing urban surface flood resilience using hydrodynamic modelling under extreme rainfall conditions in urban catchment of Nepal 

Pushparaj Singh, Rahul Deopa, and Mohit Prakash Mohanty

Urban flooding poses a growing challenge for rapidly urbanizing cities, where climate change–driven increases in extreme rainfall, expanding impervious surfaces, and limited drainage capacity collectively exacerbate the frequency and severity of surface water inundation. In this context, understanding urban surface flood resilience, defined as the capacity of stormwater drainage systems to withstand, convey, and recover from intense rainfall events, remains essential for effective flood risk management and climate adaptation planning. The present study investigates urban surface flood resilience in Janakpur Sub-Metropolitan City, Nepal, a fast-growing urban center increasingly exposed to pluvial flooding. The study develops an integrated modelling framework using a 3-way coupled MIKE+ hydrodynamic model, integrated with intense spatial analysis using GIS, to evaluate the performance of the existing stormwater drainage system under extreme rainfall conditions. The model represents the urban drainage network and surface flow processes using drainage infrastructure data obtained from field surveys, terrain information derived from a high-resolution digital elevation model, and delineated urban catchments. To characterize rainfall extremes, the analysis employs long-term observed hourly rainfall records spanning 25 years to generate design storm events corresponding to multiple return periods. The modelling framework simulates system response for a representative extreme rainfall event and quantifies inundation dynamics across the urban landscape. The results shows that the coupled approach effectively captures critical flood hazard characteristics, including inundation depth, flow velocity, and the depth–velocity product, allowing for the spatial identification of highly vulnerable catchments and drainage bottlenecks. The findings provide actionable insights into the limitations of existing stormwater infrastructure and support the development of targeted adaptation strategies aimed at enhancing urban surface flood and drainage resilience. Overall, the study underscores the value of integrated hydrodynamic modelling for resolving location-specific flood behaviour and strengthening urban flood resilience assessments under evolving climatic and urbanization pressures.

How to cite: Singh, P., Deopa, R., and Mohanty, M. P.: Assessing urban surface flood resilience using hydrodynamic modelling under extreme rainfall conditions in urban catchment of Nepal, EGU General Assembly 2026, Vienna, Austria, 3–8 May 2026, EGU26-18481, https://doi.org/10.5194/egusphere-egu26-18481, 2026.

EGU26-18820 | ECS | Posters virtual | VPS23

Global climate dynamics in a highly parameterized radiative-convective-macroturbulent energy balance model 

Adrian van Kan, Jeffrey Weiss, and Edgar Knobloch

We present a one-layer global energy balance climate model with highly parameterized radiation, convection, and large-scale atmosphere/ocean macroturbulence. Planetary heat content is parameterized by a 2D in latitude-longitude layer characterized by a temperature field and a uniform constant heat capacity. Radiation is parameterized by mean-annual zonal average top-of-atmosphere solar irradiance. Radiative heating and cooling are parameterized by a uniform constant albedo and Stefan-Boltzmann emission with uniform constant emissivity. Convection is parameterized by a temperature threshold for convection which restricts the layer from warming beyond the threshold, effectively cooling the layer. Macroturbulence is parameterized by 2D barotropic turbulence forced at small scales and damped by Rayleigh friction. Energy conservation is maintained by balancing the convective cooling of the layer with the turbulent kinetic energy forcing, resulting in tropical forcing, while the frictional loss of kinetic energy is balanced by frictional heating of the layer. The parameterized energy transforming processes are characterized by timescales, which, for Earth-like planets, are ordered as tradiation > tmacroturbulence > tconvection.

We investigate the model’s equilibrium climate state in terms of the meridional heat transport (MHT), the resulting zonally averaged temperature profile, and their fluctuations by simulating the system over many radiation times. For Earth-like parameters, despite the model’s extremely simplified dynamics, our simulations reveal a MHT profile comparable to the observed, annually averaged MHT on Earth, featuring a maximum in the mid-latitudes of approximately 5PW, a form of Bjerknes compensation. 

How to cite: van Kan, A., Weiss, J., and Knobloch, E.: Global climate dynamics in a highly parameterized radiative-convective-macroturbulent energy balance model, EGU General Assembly 2026, Vienna, Austria, 3–8 May 2026, EGU26-18820, https://doi.org/10.5194/egusphere-egu26-18820, 2026.

EGU26-19471 | ECS | Posters virtual | VPS23

From bilinear interpolation to machine learning: a comparative assessment of statistical downscaling methods for CMIP6 projections over Brazil 

Diego Jatobá Santos, Gilberto Goracci, Minella Alves Martins, and Rochelle Schneider

High-resolution climate projections are essential for climate impact, vulnerability, and adaptation studies, particularly over regions with strong spatial heterogeneity such as Brazil. Although CMIP6 global climate models (GCMs) provide valuable information on future climate change, their coarse spatial resolutions, typically ranging from 100 to 200 km, limit their direct application at regional and local scales. Statistical downscaling techniques offer computationally efficient alternatives to dynamical downscaling, but their relative performance and added value remain insufficiently assessed over Brazil.

In this study, we compare two statistical downscaling approaches applied to a subset of CMIP6 models previously evaluated by Bazanella et al. (2024) – 10.1007/s00382-023-06979-1 – and identified as skillful in representing Brazilian climate: (i) a bilinear interpolation method followed by percentile-to-percentile bias correction, and  (ii) machine learning–based downscaling approaches. The original GCM outputs are interpolated to a common high-resolution grid of 10 km × 10 km using bilinear weights, providing a physically consistent reference framework. In parallel, ML-based models are trained using historical GCM predictors and high-resolution reference climate datasets to learn nonlinear relationships and generate high-resolution climate fields.

The performance of both approaches is evaluated for the historical period in terms of mean climatology, spatial patterns, and variability. Future projections under the SSP2-4.5 and SSP5-8.5 scenarios are then analyzed to assess regional climate change signals and associated uncertainties. Results assess the extent to which ML-based downscaling provides added value relative to bilinear interpolation, particularly for variables with strong spatial heterogeneity, such as precipitation and temperature extremes, while also evaluating the ability of the approach to preserve the large-scale climate signals projected by the driving CMIP6 models. This comparative analysis provides insights into the applicability, robustness, and limitations of statistical and ML-based downscaling methods for regional climate assessments over Brazil.

How to cite: Jatobá Santos, D., Goracci, G., Alves Martins, M., and Schneider, R.: From bilinear interpolation to machine learning: a comparative assessment of statistical downscaling methods for CMIP6 projections over Brazil, EGU General Assembly 2026, Vienna, Austria, 3–8 May 2026, EGU26-19471, https://doi.org/10.5194/egusphere-egu26-19471, 2026.

EGU26-21173 | Posters virtual | VPS23

Global Hot Spots of Climate Extremes from Composite Hazard Indices 

Natalia Zazulie, Francesca Raffaele, and Erika Coppola

Understanding the spatial distribution and intensity of climate-related hazards is essential for effective risk assessment and adaptation planning.  This study presents a comprehensive analysis of climate hazard indices applied across all IPCC reference regions, using all the available CMIP5-driven regional climate model (RCM) simulations at 25 km resolution over the CORDEX domains, together with Euro-CORDEX simulations at 12 km resolution. The objective is to identify climate hazard hot spots through the formulation of a composite hazard index. 

A subset of hazard indicators representing key climate extremes is selected. Temperature- and heat-stress–related hazards are characterized using TX90p (extreme maximum temperature), TN90p (extreme minimum temperature), and the NOAA Extended Heat Index (HI). Heavy precipitation and drought-related hazards are represented by RX1DAY (maximum 1-day precipitation), P99 (99th percentile of precipitation), and CDD (consecutive dry days).

The composite index integrates both the frequency and intensity of extremes and is computed at both regional and grid-point levels. A normalization approach is used to ensure comparability across regions with diverse climatic characteristics. Results reveal pronounced spatial heterogeneity in hazard intensity, highlighting regions where multiple hazards converge and amplify overall risk. This framework enables systematic identification of global and regional climate hot spots, offering insights into areas that may face heightened climate stress under current and projected conditions. By providing a consistent, region-wide assessment of hazard exposure, this study aims to support comparative climate risk analyses and inform policy-relevant decision-making for climate adaptation and resilience strategies at multiple scales.

How to cite: Zazulie, N., Raffaele, F., and Coppola, E.: Global Hot Spots of Climate Extremes from Composite Hazard Indices, EGU General Assembly 2026, Vienna, Austria, 3–8 May 2026, EGU26-21173, https://doi.org/10.5194/egusphere-egu26-21173, 2026.

EGU26-21830 | ECS | Posters virtual | VPS23

Soil Moisture Based Calibration of a Hybrid Hydrological-Neural Network Model in Data Scarce Basins 

Khaoula Ait Naceur, El Mahdi El Khalki, Luca Brocca, Abdessamad Hadri, Oumar Jaffar, Mariame Rachdane, Vincent Simonneaux, Mohamed El Mehdi Saidi, and Abdelghani Chehbouni

Reliable river discharge simulation generally relies on observed streamflow data for model calibration; however, such observations are often uncertain or unavailable in data-scarce regions, limiting the applicability of conventional hydrological models. This study presents a hybrid modeling framework that uses soil moisture as an alternative calibration variable to improve discharge simulations in the absence of reliable streamflow observations. The framework couples a two-layer version of the daily lumped MISDc (Modello Idrologico Semi-Distribuito in continuo) hydrological model with a Feedforward Neural Network (FFNN), which is employed to enhance parameter calibration by exploiting soil moisture dynamics. The proposed approach is evaluated across three contrasting basins: Tahanaout in semi-arid Morocco, and Colorso (Italy) and Bibeschbach (Luxembourg) in temperate climates. Both in situ and ERA5-Land soil moisture datasets are used as calibration inputs. Model performance is assessed using multiple hydrological metrics, including Mean Absolute Error (MAE), Kling-Gupta Efficiency (KGE), and the correlation coefficient (R). Results show that the hybrid MISDc-FFNN framework substantially improves river discharge simulations compared to the traditional model. Across all basins, MAE is reduced by up to 61%, KGE increases by more than 200%, and R improves by up to 87%, with consistent performance gains observed for both observed and reanalysis-based soil moisture. These findings demonstrate the potential of soil moisture driven calibration strategies to enhance hydrological modeling in data-scarce environments, offering a viable pathway for improved water resources assessment and flood risk management where discharge observations are limited or unreliable.


Keywords: Soil moisture; river discharge simulation; hydrological modeling; machine learning; ERA5-Land; data-scarce regions; feedforward neural network

How to cite: Ait Naceur, K., El Khalki, E. M., Brocca, L., Hadri, A., Jaffar, O., Rachdane, M., Simonneaux, V., Saidi, M. E. M., and Chehbouni, A.: Soil Moisture Based Calibration of a Hybrid Hydrological-Neural Network Model in Data Scarce Basins, EGU General Assembly 2026, Vienna, Austria, 3–8 May 2026, EGU26-21830, https://doi.org/10.5194/egusphere-egu26-21830, 2026.

Present-day practices of bridge piers design often employ group arrangements of piers in various configurations to modify flow dynamics and mitigate subsequent scour formation around the piers. These group arrangement configurations may vary in aspects of spacing ratio, number of piers, and orientations to alter the flow-structure interaction, and hence the scour development. Investigating the turbulent flow behaviour around various common group arrangements has been a topic of interest for researchers for a few years now. This study presents an experimental investigation aimed at comparing the equilibrium scour depth caused by various four-pier group arrangements. To assess the impact of spacing, the face-to-face distance between piers (G) was taken to values of D, 2D, and 3D, where D refers to the diameter of the circular pier. The scour patterns reveal that the maximum scour depth occurred when spacing G was equal to D. The equilibrium scour depth decreased with an increase in the pier spacing to 2D and 3D, corresponding to an approximate flow intensity of 0.9. The scour contours exhibit the impact of neighbouring piers and how it differs with an increase in pier spacing. Instantaneous velocity data were collected to derive the flow characteristics in the flow field. Velocity vectors depict the influence of different configurations on the flow pattern. The study provides an insight into the spacing effects on equilibrium scour, which can be useful in the design of pier group arrangements.

How to cite: Sahu, C.: Spacing Effect on the Equilibrium Scour and Flow Pattern around Four-Pier group in Different Configurations, EGU General Assembly 2026, Vienna, Austria, 3–8 May 2026, EGU26-22153, https://doi.org/10.5194/egusphere-egu26-22153, 2026.

EGU26-23043 | Posters virtual | VPS23

Analysis of Vector-Field Multifractal Cascades 

João Felippe Thurler Rondon da Fonseca, Daniel Schertzer, Igor da Silva Rocha Paz, and Ioulia Tchiguirinskaia
Multifractals provide a powerful framework to describe systems that exhibit variability over a wide range of scales together with strong intermittency. By encoding scale-dependent fluctuations through multiplicative cascades, multifractal models capture non-Gaussian statistics, heavy tails, and scale invariance in a compact and predictive manner. These properties have made multifractals particularly successful in the analysis of a wide variety of geophysical phenomena.
 
From the outset, multifractal fields have been formulated on domains of arbitrary dimension, allowing to represent space, space–time, or higher-dimensional parameter spaces. In contrast, the codomain of multifractal constructions has most often been restricted to scalar-valued fields. Although simpler for modeling and inference, the scalar setting omits directional information, anisotropy, and cross-component couplings that are essential in vector observations. Recent works, such as (Schertzer and Tchiguirinskaia 2020), have explored the use of Clifford algebras for constructing cascade generators, offering a natural algebraic framework to represent vector-valued multifractals while preserving their multiscale and symmetry properties.
 
In this work, we consider and simulate Clifford multifractal cascades as an extension of scalar models, capable of capturing directional variability and the internal geometry of multiscale fields. Rather than relying on a scalar stability exponent, we work in a framework where the stability can be encoded by algebra-valued or operator-like parameters, enabling anisotropic scaling and nontrivial coupling between different components of the Clifford field across scales.
 
To characterize the resulting operator-scaling structure, we extended the scalar analysis methods and developed inference methods that enable the direct estimation of multifractal parameters. Numerical experiments on synthetic cascades demonstrate that the proposed approach reliably recovers these parameters. The results demonstrate that extending multifractal analysis to vector-valued fields is both feasible and essential for the characterization of complex multiscale phenomena.

How to cite: Thurler Rondon da Fonseca, J. F., Schertzer, D., da Silva Rocha Paz, I., and Tchiguirinskaia, I.: Analysis of Vector-Field Multifractal Cascades, EGU General Assembly 2026, Vienna, Austria, 3–8 May 2026, EGU26-23043, https://doi.org/10.5194/egusphere-egu26-23043, 2026.

EGU26-829 | ECS | Posters virtual | VPS24

Geoelectric Architecture of Eastern Ladakh: New Insights from Magnetotelluric Imaging Across the Trans-Himalayan Suture System 

Akashdeep Barman, Pavankumar Gayatri, Ajay Manglik, Demudu Babu Molli, Raj Sunil Kandregula, and Chakravarthi N Narasimha

The eastern Ladakh region, forming a key segment of the Trans-Himalaya, preserves the tectonic archive of the India–Eurasia collision that led to the closure of the Tethys Ocean, subduction of the Indian lithosphere, and subsequent growth of the Himalayan orogen. Despite its tectonic relevance and geothermal potential, the crustal geophysical framework of this region has remained poorly constrained. To fill this gap, we conducted detailed magnetotelluric (MT) investigations along two strategically positioned profiles: Ukdungle–Hanle–Koyul and the Tso Moriri–Pangong corridor, covering the major suture zones and associated lithotectonic units. Results from the Ukdungle–Hanle–Koyul profile delineate a steeply dipping Indus Suture Zone (ISZ), an 8–10 km thick Ladakh batholith, and a prominent ~6 km-wide conductive body at ~4 km depth beneath the Tso Moriri Crystalline (TMC) complex, with an upward extension along the ISZ. Three-dimensional modelling further reveals that these shallow conductors merge downward into a laterally extensive deep conductive zone interpreted as partial melt underlying southern Tibet and extending into eastern Ladakh. The second MT profile from the TMC complex toward the Pangong metamorphics highlights additional crustal transitions, including the shift from highly resistive Indian crust to moderately resistive crust across the ISZ, the deeper root of the Ladakh batholith at ~18–20 km, and a major 20–25 km deep conductor beneath the Shyok Suture Zone (SSZ), interpreted as a fossil magma chamber. A systematic geoelectric-strike rotation from NW–SE to E–W northward reflects the transition from Himalayan tectonics to the plateau-dominated regime of western Tibet. Together, the profiles also indicate an eastward thinning of the Ladakh batholith, refining the regional crustal architecture.
Keywords: Trans Himalaya, Tso Moriri Crystalline (TMC), Pangong metamorphics, Ladakh Batholith

How to cite: Barman, A., Gayatri, P., Manglik, A., Molli, D. B., Kandregula, R. S., and Narasimha, C. N.: Geoelectric Architecture of Eastern Ladakh: New Insights from Magnetotelluric Imaging Across the Trans-Himalayan Suture System, EGU General Assembly 2026, Vienna, Austria, 3–8 May 2026, EGU26-829, https://doi.org/10.5194/egusphere-egu26-829, 2026.

EGU26-6568 | ECS | Posters virtual | VPS24

Scaling of Stress Drop with Rate-and-State Frictional Parameters in Spring-Block Models 

Lin Chai and Feng Hu

Numerical simulations of earthquake cycles provide essential insights into fault mechanics and the physical interpretation of frictional parameters. Here, we utilize a spring-block system governed by rate-and-state friction to systematically compare earthquake cycle behaviors under quasi-dynamic and fully dynamic conditions. Our simulations demonstrate that for both approaches, the static stress drop, dynamic stress drop, and peak stress scale linearly with the logarithm of the loading rate [ln(Vpl/V0)]; however, the scaling coefficients are distinct and are modulated by both frictional parameters and the system stiffness. Specifically, we observe stress overshoot during the coseismic phase in dynamic models, contrasting with the undershoot observed in quasi-dynamic simulations. Additionally, parameter sweeps reveal that stress drops decrease as the stiffness ratio kc/k increases. This study highlights the importance of the inertial term effect in interpreting earthquake cycle behaviors.

How to cite: Chai, L. and Hu, F.: Scaling of Stress Drop with Rate-and-State Frictional Parameters in Spring-Block Models, EGU General Assembly 2026, Vienna, Austria, 3–8 May 2026, EGU26-6568, https://doi.org/10.5194/egusphere-egu26-6568, 2026.

EGU26-10972 | ECS | Posters virtual | VPS24

Crustal Seismic anisotropy in Sikkim Himalaya: Implications for deformation 

Gaurav Kumar, Arun Singh, Chandrani Singh, Dipankar Saikia, and M Ravi Kumar

Collision and relentless underthrusting of India beneath Eurasia resulted in large-scale deformation of the Indian lithosphere. Anisotropic parameters serve as a good proxies to decipher deformation in such complex orogenic collision zones. In this study, we present anisotropy characteristics of the crust beneath Sikkim Himalaya using harmonic decomposition of P-to-S converted phases identified in P-wave receiver functions (P-RFs). Analysis of azimuthal variation of these phases enabled parameterizing the crustal anisotropic properties, with depth. Initially, 11,087 high quality P-RFs were computed using waveforms of teleseismic earthquakes having magnitude  ≥ 5.5 and signal to noise ratio  ≥ 2.5 within an epicentral distance range of 30° - 100°, recorded at a network of 38 seismic stations deployed in Sikkim Himalaya and the adjoining foreland basin. Analysis of the first three harmonic degrees (i.e. k= 0, 1 and 2) reveals that the upper crustal anisotropy is oriented WSW-ENE to E-W, coinciding well with the trends of crustal microcracks and fractures. The mid to lower crustal anisotropy aligns predominantly with the dipping decollement layer along which the Indian plate is underthrusting Tibet. An orthogonal reorientation is observed within the extent of the Dhubri-Chungthang Fault Zone authenticating its role in segmenting the orogen. The lower crustal anisotropy is highly perturbed signifying a highly heterogeneous nature of the Moho.  Existence of multiple layers of anisotropy possessing distinct geometries varying with depth could be an indication of a highly complex deformational regime resulting from active crustal shortening.

How to cite: Kumar, G., Singh, A., Singh, C., Saikia, D., and Kumar, M. R.: Crustal Seismic anisotropy in Sikkim Himalaya: Implications for deformation, EGU General Assembly 2026, Vienna, Austria, 3–8 May 2026, EGU26-10972, https://doi.org/10.5194/egusphere-egu26-10972, 2026.

Regular monitoring of small to moderate sources of continuous earthquake events in the complex tectonics of Himalayan region helps in clearly defining the ongoing seismotectonic process. The study of moment tensor inversion to decipher the fault planes responsible for current seismic activity in the Kishtwar region of Northwest part of Himalaya has been undertaken by establishing a six-station network in 2022 and among them 15 events of shallow origin with magnitude ranging from ML ~ 3.0 to 4.0 occurred in the local region of seismic network are used for the moment tensor inversion. A few number of studies didn’t able to clearly demarcate the actual scenario of seismotectonics in the northwest part of Himalaya due to its difficult terrain and complex geology. This area has been studied for fault plane solution by a software package ISOLA based on MATLAB programming environment. The source inversion is performed via iterative deconvolution method and synthetic seismogram is generated through green’s function computation via discrete wavenumber method using the regional crustal velocity model. However, the inversion is performed at several trial source position and at various frequency bands based on the epicenter distance and the magnitude of earthquake to find the best solution resulting from the maximum correlation between the recorded and synthetically generated waveforms. A 2D space-time grid search is performed for determining the optimal time and positon of earthquake generation. Perhaps calculating source parameters such as moment magnitude, centroid depth and fault parameters equally with describing uncertainty quantities such as variance reduction factor and condition number will deliver the reliability and stability to the solution. A strong follow-up uncertainty quantification can justify the best estimated fault plane solution. Quality of earthquake event can be calculated through their DC and CLVD percentage and maximum & minimum compression stress direction. Focal mechanism solution of these events following thrust with strike-slip focal mechanism and represents the compressional regime in north-northeastern direction. The centroid depth obtained by moment tensor inversion of all events falls within the depth zone of Main Himalayan Thrust (MHT) suggesting seismicity is concentrated along the major detachment in the region.

How to cite: Tiwari, S. and Gupta, S. C.: Moment tensor analysis and uncertainty quantification of local earthquake events: tectonic implication in the northwestern Himalayan region, EGU General Assembly 2026, Vienna, Austria, 3–8 May 2026, EGU26-13656, https://doi.org/10.5194/egusphere-egu26-13656, 2026.

EGU26-16763 | ECS | Posters virtual | VPS24

Multi-rupture Fault-based Seismic Hazard Assessment for the Dauki Fault System, Northeastern India 

Abhishek Kumar Pandey, Rukmini Venkitanarayanan, and Mukat Lal Sharma

The east-west-trending, north-dipping Dauki Fault System (DFS) is among the well-identified active fault systems in the North-Eastern part of India, and it marks the southern geological boundary of the Shillong Plateau, separating it from the Bengal alluvium basin and Sylhet trough. With a length of about 350 km stretching from about 89.9° E to 93° E, DFS is reverse in nature and can be divided into 4 segments, namely, Western, Central, Eastern and Easternmost with variable dip and strike values. Mitra et al. (2018) has indicated that this fault can produce an Mw ∼8 earthquake.
Fault segmentation, fault connectivity, and multi-segment rupture scenarios have been explicitly incorporated into a fault-system-based probabilistic seismic hazard framework for the Dauki Fault System. The SHERIFS (Seismic Hazard and Earthquake Rates In Fault Systems) methodology has been employed to enforce a global magnitude–frequency distribution while converting geological and geodetic slip rates into earthquake rates at the system scale. To account for geometric complexities such as bends and step-overs, a range of rupture hypotheses has been explored, including single-segment ruptures, partial multi-segment ruptures, and through-going system-wide ruptures. Epistemic uncertainties associated with maximum magnitude, rupture connectivity, slip-rate variability, and off-fault seismicity have been quantified using a logic-tree approach.
The resulting earthquake rupture forecasts are tested against available seismicity data of the region. The findings underscore the critical role of fault interactions in determining the seismic hazard along the DFS and indicate the need for system-level modelling to provide a reliable assessment of seismic hazard.
This study is the first to offer a seismic hazard framework based on the multi-rupture scenario for the Dauki Fault System and it also contributes to the improvement of seismic risk assessment for northeastern India and the Indo–Burman–Shillong tectonic domain.

How to cite: Pandey, A. K., Venkitanarayanan, R., and Sharma, M. L.: Multi-rupture Fault-based Seismic Hazard Assessment for the Dauki Fault System, Northeastern India, EGU General Assembly 2026, Vienna, Austria, 3–8 May 2026, EGU26-16763, https://doi.org/10.5194/egusphere-egu26-16763, 2026.

EGU26-20741 | ECS | Posters virtual | VPS24

A seismogenic modelling approach for rift-basin fault systems in slow-deforming regions: application to the western margin of the Valencia Trough 

Marc Ollé-López, Julián García-Mayordomo, Oona Scotti, and Eulàlia Masana

Seismic hazard assessment is crucial for the design of critical facilities, whose damage could lead to severe consequences. The design of such facilities typically requires the definition of seismic actions associated with recurrence periods on the order of 5,000-10,000 years. Earthquakes with such low frequencies are well documented in highly deforming regions, where paleoseismic records commonly encompass several seismic cycles of active faults. In contrast, in slow-deforming regions or areas of low seismicity, the scarcity of seismic data hinders the definition of seismogenic zones. In this context, geological studies of active seismogenic faults are essential, as they allow the characterisation of seismic behaviour over time spans far exceeding those covered by instrumental or historical records. These data can contribute to constraining fault’s seismic cycles and estimating earthquake magnitude–frequency distributions at the fault scale.

Despite their importance, the incorporation of faults into seismic hazard models remains challenging, particularly in low strain regions such as the western margin of the Valencia Trough. This region of the NE of Iberia (from the Vallès-Penedès Graben to the Valencia Depression) corresponds to a passive margin characterised by a basin-and-range structure, bounded by multiple NNE–SSW-oriented normal faults formed during the Neogene rifting episode. Those faults are usually associated with mountain fronts, although our recent studies have found some new faults crosscutting Pleistocene alluvial fans. These newly discovered faults are being studied by means of geomorphology, geophysics, paleoseismology and geochronology in order to estimate their seismic parameters. Several challenges arise when analysing these faults, including fault identification, incomplete geological records, and the need for complex dating techniques.

Moreover, in regions characterised by fault systems, fault interactions may play a significant role. In regions such as the studied area, these interactions may result in long quiescent periods followed by phases of increased activity or even cascading events. Under such conditions, distinguishing between quiescent and active phases is especially difficult, as recurrence intervals are expected to span several thousands of years in both cases.

In this work, we explore existing methodologies for the computation of seismic hazard incorporating geological data from faults and fault systems in slow-deforming regions, using the western margin of the Valencia Trough as a case study. To this end, a detailed geometric characterization of the fault system is carried out to establish the geometric relationships among faults. Recent morphotectonic analyses and newly acquired geological data are then used to constrain the seismic parameters of the studied faults and to estimate their earthquake frequency distributions. Finally, several alternative seismic source models are proposed, forming the basis for the construction of a logic tree for subsequent seismic hazard calculations. These
models, although in progress, provide a framework for improving seismic hazard assessments in slow-deforming regions, contributing to safer design of critical infrastructure.

How to cite: Ollé-López, M., García-Mayordomo, J., Scotti, O., and Masana, E.: A seismogenic modelling approach for rift-basin fault systems in slow-deforming regions: application to the western margin of the Valencia Trough, EGU General Assembly 2026, Vienna, Austria, 3–8 May 2026, EGU26-20741, https://doi.org/10.5194/egusphere-egu26-20741, 2026.

EGU26-21099 | ECS | Posters virtual | VPS24

Double-Couple and Full Moment Tensor Solutions of the 2015 Nepal Aftershocks 

Pankaj Lahon, Vipul Silwal, and Rinku Mahanta

The 2015 Mw 7.8 Gorkha earthquake was followed by numerous aftershocks that provided important information on active faulting in central Nepal. Accurate moment tensor estimations are essential for determining the source parameters of these seismic events. In this study, we determine double-couple and full moment tensor solutions for selected aftershocks of the 2015 Nepal earthquake sequence using a regional 1D velocity model.

The waveform data recorded by the temporary broadband network (NAMASTE) are used to analyse 51 aftershocks with M > 3.5. A library of Green’s functions is computed using the frequency–wavenumber method based on a 1D velocity model of the Nepal region. Synthetic waveforms derived from the Green’s functions are used to invert the waveform data for moment tensor estimation. Both body waves and surface waves are used in the inversion, and they contribute separately to the moment tensor solutions. The analysis focuses on regional waveforms in relatively higher frequency ranges.

Both double-couple–constrained and full moment tensor inversions are performed, and the resulting source parameters are examined in terms of waveform fit, centroid depth, and fault-plane orientation. This work presents a set of moment tensor solutions for the 2015 Nepal aftershocks using a 1D regional velocity model and provides a reference for future studies using more complex velocity structures.

How to cite: Lahon, P., Silwal, V., and Mahanta, R.: Double-Couple and Full Moment Tensor Solutions of the 2015 Nepal Aftershocks, EGU General Assembly 2026, Vienna, Austria, 3–8 May 2026, EGU26-21099, https://doi.org/10.5194/egusphere-egu26-21099, 2026.

EGU26-21425 | ECS | Posters virtual | VPS24

Evaluating SASW/CSWS-Derived Proxies for Seismic Site Amplification 

Virendra Singh and Dilip Kumar Baidya

The alternative proxy parameters for seismic site amplification beyond the conventional time-averaged shear wave velocity of the upper 30 m (VS,30) are investigated in this study with a focus on quantities that can be derived or constrained from surface wave-based measurements such as Spectral Analysis of Surface Waves (SASW) and Continuous Surface Wave System (CSWS) testing. Surface wave methods provide dispersion curves that are inverted to obtain near-surface shear wave velocity profiles, which are then used to construct synthetic one-dimensional layered models for ground response analysis. For each profile, two different candidate site parameters are evaluated, including VS,30 and the impedance ratio between the surface layer and the underlying half-space. These parameters are chosen to reflect what can realistically be inferred from SASW/CSWS-derived velocity profiles, particularly the shallow stiffness and impedance contrasts that strongly influence amplification. Correlation analyses are carried out to quantify how well each parameter explains the variability in amplification across the synthetic suite. The results are used to assess whether the impedance ratio provides stronger or more consistent correlation with amplification than VS,30, thereby offering guidance on how surface wave–based site characterization can be better integrated into proxy-based amplification and site classification schemes in seismic design practice.

How to cite: Singh, V. and Baidya, D. K.: Evaluating SASW/CSWS-Derived Proxies for Seismic Site Amplification, EGU General Assembly 2026, Vienna, Austria, 3–8 May 2026, EGU26-21425, https://doi.org/10.5194/egusphere-egu26-21425, 2026.

EGU26-22669 | ECS | Posters virtual | VPS24

An integrated geodynamic analysis of seismic sources in the Eastern Rif: Insights from geological, seismological, gravimetric, and aeromagnetic data 

Hafid Iken, Abderrahime Nouayti, Nordine Nouayti, and Driss Khattach

The Rif’s belt is characterized by low to moderate seismic activity resulting from the continental collision between the African and Eurasian plates. This seismic activity, which involves devastation and human losses, requires an in-depth study of its origins and mechanisms. This study aims to identify the geological structures responsible for seismic activity in the eastern Rif by adopting an integrated methodological approach. The methodology relies on the use of a Geographic Information System (GIS) to process and analyze multiple geological, seismological, and geophysical datasets. Various filters were applied to magnetic and gravimetric data (vertical derivatives) to characterize the subsurface. The analysis of earthquake focal mechanisms helped identify active faults. The results show that the seismicity, with a NW-SE orientation, is localized within a fragile depression south of the city of Selouane. The final geological model highlights a system of faults and strike-slips oriented NE-SW and NW-SE. A significant spatial correlation is observed between epicenters and Messinian-aged NW-SE strike-slips, suggesting their reactivation. The analysis indicates that a system of dextral strike-slips is likely the source of this seismic activity. The proposed geodynamic model represents a major advancement in understanding local seismic activities and serves as an essential reference for future studies. These results significantly contribute to the assessment and management of seismic risks, thereby enhancing the safety and resilience of populations in this high-risk area.

KEYWORDS: Geodynamic model; Seismotectonic; Focal mechanism; Magnetic; Gravimetric; ·
Eastern Rif. 

How to cite: Iken, H., Nouayti, A., Nouayti, N., and Khattach, D.: An integrated geodynamic analysis of seismic sources in the Eastern Rif: Insights from geological, seismological, gravimetric, and aeromagnetic data, EGU General Assembly 2026, Vienna, Austria, 3–8 May 2026, EGU26-22669, https://doi.org/10.5194/egusphere-egu26-22669, 2026.

The increase in space geodetic measurements for examining plate motion in the past three decades has significantly advanced our understanding of complex deformation processes in subduction zones throughout the earthquake cycle. We now recognize a spectrum of seismic and aseismic behaviors, including slow slip events, non-volcanic tremor, low-frequency earthquakes, fault creep, episodic tremor and slip (ETS), postseismic afterslip, and viscoelastic mantle flow transients. Notably, Materna et al. (2019) observed dynamically triggered increases and decreases in plate coupling associated with nearby earthquakes in southern Cascadia. We have reproduced and extended these findings using an improved semi-automated detection method, which reveals additional examples of time-dependent coupling changes in the region. 

This study applies our method to the Chilean subduction zone to investigate similar temporal variability in plate coupling changes. In southern Chile, Klein et al. (2016) and Melnick et al. (2017) documented GNSS velocity increases near the boundaries of the unruptured segments following the 2010 Maule earthquake. GNSS rates south of 21°S accelerate up to 10 mm/year in the second year following the 2014 Iquique earthquake, potentially reflecting a coupling increase (Hoffmann et al., 2018). Additionally, Luo et al. (2020) reported a systematic decrease in seaward velocities from 2010–2019 across the southern half of the great 1960 Valdivia rupture zone. Our ongoing work seeks to detect and characterize such abrupt GNSS velocity changes in Chile using our semi-automated approach and to better understand the underlying physical mechanisms. In particular, we aim to constrain the recently identified phenomenon of dynamically triggered coupling changes, with implications for earthquake cycle models and seismic hazard assessment across global subduction zones.

How to cite: Roy, A. and Jackson, N. M.: The Search for Time-Dependent Coupling Changes on the Plate Interface following the Great Earthquakes of Chile, EGU General Assembly 2026, Vienna, Austria, 3–8 May 2026, EGU26-866, https://doi.org/10.5194/egusphere-egu26-866, 2026.

EGU26-938 | ECS | Posters virtual | VPS25

Insights into the copper accumulation potential of magmas along the Sunda-Banda arc, Indonesia from apatite and its mineral hosts 

Sri Budhi Utami, Teresa Ubide, Gideon Rosenbaum, Weiran Li, Esti Handini, Sarah Wood, Heather Handley, and Louise Goode

Current demand for critical metals including Cu is outstripping current supply and will further escalate in the future. A significant source of Cu comes from porphyry deposits, which contribute to >60% of global Cu ore production. Many of these porphyry Cu deposits are found along convergent margins such as the Andes and the Sunda-Banda arc in Indonesia and these same arcs also host highly active volcanoes. Understanding the magmatic and geodynamic factors that contribute towards priming magmas for Cu fertility as opposed to volcanic eruptions can aid in identification of prospective targets for exploration.

Here we present analyses of apatite populations from known porphyry Cu deposits and active volcanoes along the Sunda-Banda arc in Indonesia. To gain a complete overview of the mineral associations and their information, we incorporate textural information to analyze both apatite inclusions and their mineral hosts, such as pyroxenes and amphiboles, as well as groundmass apatite. These mineral compositions will serve as input for thermodynamic models to constrain the volatile chemistry and budget, as well as the volatile saturation depths. The information gathered will be combined to test our working hypotheses that the magmas with high Cu fertility store at distinct depths, have geochemical signatures that suggest deep fractionation of garnet and amphibole, and are associated with anomalous geodynamic features such as slab tears.

Our ongoing work advances current understanding on magma storage and transfer along and across fertile magmatic arcs, aiming to better understand magmatic pre-conditioning for porphyry copper deposit formation to complement exploration efforts to find copper deposits in the geological records.

How to cite: Utami, S. B., Ubide, T., Rosenbaum, G., Li, W., Handini, E., Wood, S., Handley, H., and Goode, L.: Insights into the copper accumulation potential of magmas along the Sunda-Banda arc, Indonesia from apatite and its mineral hosts, EGU General Assembly 2026, Vienna, Austria, 3–8 May 2026, EGU26-938, https://doi.org/10.5194/egusphere-egu26-938, 2026.

EGU26-1377 | Posters virtual | VPS25

Impact of segmentation pattern of the Pan-African trending strike-slip basement fault on the spatial distribution of hydrocarbon traps in SW Iran 

Bahman Soleimany, Zahra Tajmir Riahi, Gholam Reza Payrovian, and Susan Sepahvand

Abstract:

Strike-slip basement faults and their related segments are crucial for oil and gas exploration. These faults are considered favorable channels for hydrocarbon migration. The multistage activities of these faults influence the development of hydrocarbon-bearing structures. They can also produce fracture systems that enhance reservoir properties and boost oil and gas production. Understanding how strike-slip fault segments and their associated structures affect hydrocarbon accumulation is essential for geological research and exploration planning. This study aims to characterize the geometry and structural evolution of the strike-slip basement fault with Pan-African or Arabian trends, investigate the relationship between fault segments, and assess their impact on the distribution of hydrocarbon traps. This research focuses on the structural and tectono-sedimentary analyses of the Kazerun fault system based on processing and interpretation of the surface data (e.g., satellite images and aeromagnetic data) and the subsurface data (e.g., 2D and 3D seismic and well data) in the Zagros orogenic belt, SW Iran. The relationship between the segmented strike-slip fault zone and hydrocarbon reservoirs is analyzed through map view patterns and profile features. Results reveal that the Arabian-trending Kazerun fault system comprises segmented dextral strike-slip faults and is considered a transform and wrench fault. These faults display various planar configurations, including linear, en-echelon, horsetail splays, and irregular geometries in the map view. Based on the seismic data interpretation, three structural styles develop along the Kazerun strike-slip fault zone, including vertical or oblique, pull-apart (negative flower structure), and push-up (positive flower structure) segments. Releasing and restraining bends and oversteps formed at the tail end of the Kazerun strike-slip fault segments. In the study area, salt diapirism occurred along the pull-apart segment and the releasing bend. Hydrocarbon traps are developed in the push-up segment and the restraining bend. Fractures are less prominent in the vertical segments but more developed in push-up and pull-apart segments, which act as pathways for fluid migration and improving reservoir quality. The push-up segment and restraining bend exhibit a higher degree of branching fractures, making them the most significant for reservoir development. This research shows that strike-slip fault segmentation (in the form of fault overlapping or stepping) and their lateral linkage control the reservoir distribution and connectivity. Recognizing the growth and lateral connections of strike-slip fault segments is crucial for structural analysis and predicting fault-controlled reservoirs. These findings offer valuable insights into the structural characteristics of strike-slip fault zones and can enhance oil and gas exploration in the Zagros fold-and-thrust belt and other similar regions.


Keywords:

Strike-slip basement fault, Segmentation pattern, Oil/Gas fields, Zagros orogenic belt, SW Iran


How to cite: Soleimany, B., Tajmir Riahi, Z., Payrovian, G. R., and Sepahvand, S.: Impact of segmentation pattern of the Pan-African trending strike-slip basement fault on the spatial distribution of hydrocarbon traps in SW Iran, EGU General Assembly 2026, Vienna, Austria, 3–8 May 2026, EGU26-1377, https://doi.org/10.5194/egusphere-egu26-1377, 2026.

Skarn-type Cu–Fe–Au mineralization in the Middle–Lower Yangtze River Metallogenic Belt (MLYRB) is closely associated with Early Cretaceous intermediate to felsic magmatism; however, the links between magmatic evolution and ore-forming efficiency remain poorly constrained. In the Tonglushan ore field, one of the largest Cu–Fe–Au skarn systems in eastern China, multiple intrusive phases are spatially distributed, providing an ideal opportunity to investigate how magmatic processes control metallogenic potential. Here we present new geochronological and geochemical constraints on quartz monzodiorite porphyry, quartz monzodiorite, quartz diorite, and their mafic microgranular enclaves (MMEs) from different sectors of the Tonglushan ore field.

Zircon U–Pb ages indicate synchronous emplacement of all intrusive phases and MMEs at ca. 142–140 Ma. Whole-rock geochemistry and Sr–Nd–Hf isotopes indicate that these intrusive rocks belong to a high-K calc-alkaline to weakly adakitic series and were derived from an enriched lithospheric mantle source modified by slab-derived components, followed by extensive fractional crystallization. The MMEs record efficient mixing between mafic and felsic magmas, highlighting the role of mafic recharge in supplying heat and metal components to the evolving system. Estimates of magmatic water contents and oxygen fugacity from zircon compositions reveal systematic variations among different intrusions. The Jiguanzui and Tonglushan quartz monzodiorite porphyries are characterized by high water contents and elevated oxidation states, consistent with intense Cu–Au and Cu–Fe–Au mineralization, whereas the weakly mineralized Zhengjiawan quartz diorite exhibits lower values. These observations suggest that, beyond structural controls, the metallogenic fertility of intrusions in the Tonglushan ore field was primarily governed by fractional crystallization, mafic magma input, and the development of highly hydrous and oxidized magmatic systems.

Our study demonstrates that integrated whole-rock and zircon geochemical indicators provide effective tools for evaluating the ore-forming potential of skarn-type Cu–Fe–Au mineralization related intrusions in the MLYRB.

How to cite: Zhang, M. and Tan, J.: Magmatic controls on skarn-type Cu–Fe–Au mineralization in the Tonglushan ore field, Middle–Lower Yangtze River Metallogenic Belt, EGU General Assembly 2026, Vienna, Austria, 3–8 May 2026, EGU26-2162, https://doi.org/10.5194/egusphere-egu26-2162, 2026.

Low-temperature thermochronology provides key constraints on the post-mineralization exhumation and preservation of orogenic gold deposits. In this study, we investigate the exhumation histories of the Anjiayingzi and Jinchanggouliang gold deposits, located respectively in the Kalaqin metamorphic core complex (MCC) and the Nuluerhu magmatic dome within the Chifeng–Chaoyang metallogenic belt on the northern margin of the North China Craton.

Both deposits formed in the Early Cretaceous (~130 Ma), but at significantly different depths (5.6–7.1 km for Anjiayingzi and 1.0–2.6 km for Jinchanggouliang), and are currently exposed at the surface, implying differential post-mineralization exhumation. Zircon and apatite (U–Th)/He and fission-track analyses were conducted on ore-hosting rocks to reconstruct cooling and exhumation histories. Combined age–elevation relationships and thermal history modeling reveal that the Anjiayingzi deposit experienced multi-stage, rapid exhumation totaling ~6.75 km since mineralization, with the most intense exhumation occurring between 130 and 80 Ma. In contrast, the Jinchanggouliang deposit underwent slower and more limited exhumation, with a total exhumation of ~2.50 km over the same period.

The contrasting exhumation histories coincide with an Early Cretaceous regional extensional regime affecting the northern margin of the North China Craton. We suggest that tectonic setting plays a first-order role in controlling post-mineralization exhumation. Deposits hosted within MCCs are characterized by rapid extensional denudation related to detachment faulting, whereas deposits hosted in magmatic domes are mainly exhumed through regional uplift and surface erosion. These results emphasize the importance of structural architecture in governing the exhumation, preservation, and exposure of gold deposits in extensional orogenic systems.

How to cite: Li, A. and Fu, L.: Post-mineralization exhumation of gold deposits on the northern margin of the North China Craton: constraints from low-temperature thermochronology, EGU General Assembly 2026, Vienna, Austria, 3–8 May 2026, EGU26-2243, https://doi.org/10.5194/egusphere-egu26-2243, 2026.

The Southeast Anatolian Suture Belt hosts the oceanic and continental remnants of the southern Neotethyan realm. During the Late Cretaceous, the southern Neotethyan domain experienced an Andean-type magmatism on its northern continental margin (the Tauride-Anatolide Platform), characterized by the Baskil Magmatics. The plutonic part of this unit is intruded by numerous dikes, which are the primary focus of this study. The U-Pb zircon dating of the dikes and their granodioritic host rocks indicates that their emplacement occurred within a narrow interval, between 81-79 Ma. The dikes vary chemically from basalt to dacite, while the host rocks range from andesitic to dacitic. On the normal mid-ocean ridge (N-MORB)-normalized plots, all samples exhibit negative Nb anomalies. Trace element systematics reveals that this dike system is chemically heterogeneous, consisting of five distinct chemical types. The elemental and isotope ratios indicate varying contributions from depleted and enriched components. All chemical types, with relative Nb depletion, suggest incorporation of slab-derived and/or crustal additions. This interpretation is further supported by the EM-2-like Pb isotopic ratios. Based on the variability in elemental and isotopic composition, this intrusive system appears highly heterogeneous, likely due to the combined effects of mantle source, crustal contamination, and fractional crystallization. The bulk geochemical characteristics of the studied dikes and their host rocks suggest that these intrusives formed at a continental arc. Considering the available paleontological and geochronological age data, it appears that the intraoceanic subduction and continental arc magmatism in the Southern Neotethys occurred simultaneously; the former created the Yüksekova arc-basin system, whereas the latter formed the Baskil Arc.

Note: This study was supported by project Fübap-MF.15.12.

How to cite: Ural, M., Sayit, K., Koralay, E., and Göncüoglu, M. C.: Geochemical and Geochronological approaches of Baskil Dikes (Elazığ, Eastern Turkey): Discrimination between the Late Cretaceous Continental and Oceanic Arc-related Magmatism in the Southern Neotethys, EGU General Assembly 2026, Vienna, Austria, 3–8 May 2026, EGU26-2274, https://doi.org/10.5194/egusphere-egu26-2274, 2026.

The compositional maturation of continental crust is marked by increasing diversity in granitic rocks. However, whether fractional crystallization of felsic magmas contributes to crustal maturation remains contentious, primarily due to the scarcity of well-documented highly fractionated Archean granites. To address this gap, we present an integrated petrological and geochemical study of newly identified Mesoarchean garnet-bearing granites (highly fractionation granite), in conjunction with coeval sodic tonalite-trondhjemite-granodiorite (TTG) suites and potassic granites in the Kongling Complex of the Yangtze Craton.

Zircon U‒Pb dating results show that the studied TTGs, potassic granites, and garnet-bearing granites in the Kongling Complex were formed at 3.0–2.9 Ga. The TTGs have low K2O/Na2O ratios, high Sr/Y and (La/Yb)N ratios with negative zircon εHf(t) values and mantle-like zircon δ18O values, indicating they were originated from partial melting of thickened lower crust. Potassic granites have higher K content and K2O/Na2O ratios with negative zircon εHf(t) values and mantle-like zircon δ18O values, suggesting they were generated from anatexis of ancient felsic crust. Garnets in the garnet-bearing granite are euhedral and most of them are inclusion-free. These garnets are mainly composed of almandine and spessartine with homogeneous major elemental compositions, which are consistent with the characteristics of magmatic garnets. The garnet grains show decreasing trends of HREE and Y content from core to rim, indicating the fractional crystallization of garnet and zircon. The garnet-bearing granitic plutons show a blurred contact interface with the contemporaneous potassic granites and their zircon εHf(t) and δ18O values are similar to those of potassic granites, implying a congenic process between them. The Mesoarchean garnet-bearing granites have moderate whole-rock A/CNK values, high MnO content, MnO/FeOT ratios and 10000×Ga/Al ratios, but lower Zr content with lower zircon saturation temperature. These features of garnet-bearing granites suggest that they were formed from highly evolved K-rich granitic melts. The occurrence of highly fractionated granite in the Mesoarchean may imply that a mature continental nucleus was formed in the Yangtze Craton at that time. Furthermore, global detrital zircon records document a decreasing trend of Zr/Hf ratios during the Mesoarchean, with ultra-low zircon Zr/Hf values (<25) first appearing at the same time. This shift highlights the intra-crustal felsic magma fractionation as a significant mechanism driving crustal maturation since the Mesoarchean, coincident with global geodynamic transitions.

How to cite: Zhang, L. and Zhang, S.-B.: The differentiation of a continental nucleus: Implications from Mesoarchean garnet-bearing granite in the Kongling Complex of the Yangtze Craton, EGU General Assembly 2026, Vienna, Austria, 3–8 May 2026, EGU26-2892, https://doi.org/10.5194/egusphere-egu26-2892, 2026.

EGU26-2923 | ECS | Posters virtual | VPS25

Structure-controlled Uranium + REE mineralization in low temperature basinal brine hydrothermal system at the contact of Kaladgi Basin and Peninsular Gneissic Complex, South India 

Akash Mahanandia, Maneesh M. Lal, T Guneshwar Singh, Natarajan Nandhagopal, and Sahendra Singh

The Kaladgi Basin, an E–W trending intracratonic basin in the northern part of the Dharwar Craton, preserves favourable structural and stratigraphic conditions for sandstone-hosted and unconformity-related U–REE mineralization. In the study area, the Neoproterozoic Cave Temple Arenite (CTA) of the Badami Group unconformably overlies deformed Mesoproterozoic rocks of the Bagalkot Group. The crystalline basement of the Kaladgi Supergroup comprises Meso- to Neoarchaean Peninsular Gneiss and the Chitradurga Greenstone Belt. This association of cratonic basement, schist belt, and basin-margin fault and fold systems provides an excellent structural framework for hydrothermal fluid circulation and mineralization.

Detailed thematic mapping at 1:25,000 scale in the Ramdurg–Suriban sector reveals that NNW–SSE–oriented Dharwarian stress generated a series of anticlines and synclines involving the Saundatti Quartzite, Malaprabha Phyllite, and Yaragatti Argillite, as constrained by conjugate fracture analysis and S–C fabric development. An E–W trending tectonic fault defines the contact between the Peninsular Gneissic Complex and Saundatti Quartzite, with comparable faulted contacts also developed within the Bagalkot Group. Intense faulting resulted in silicification, chalcedonic brecciation, and pervasive hydrothermal alteration along these contact zones. Transverse normal faults with associated brecciation accommodate strain related to the main E–W structure and indicate episodic reactivation of the basin architecture.

Fusion ICP–MS analysis of 20 bedrock samples collected proximal to these fault zones shows U238 concentrations exceeding twice the threshold values of National Geochemical Mapping (NGCM) stream sediment sample. Uranium enrichment is spatially associated with Malaprabha Phyllite, first-cycle CTA, and silicified banded hematite quartzite veins of the Hiriyur Formation. Chondrite-normalized (La/Yb)n versus (Eu/Eu*)n systematics indicates a dominantly low-temperature basinal brine hydrothermal system characterized by low (La/Yb)n <25 and negative Eu anomalies. Redox-sensitive (Ce/Ce*)n versus (Eu/Eu*)n plots further indicate reducing fluid conditions. In contrast, quartz–chlorite veins developed within sheared Malaprabha Phyllite and younger dolerite record comparatively higher-temperature fluids, marked by Eu2+ mobilization ((Eu/Eu*)n > 0.8) and negative Ce anomalies. These results suggest that reactivated, structure-controlled tectonites acted as effective fluid pathways, with the TTG-dominated Peninsular Gneissic Complex serving as a likely uranium source and contributing to localized U–REE mineralization along the basin margin.

How to cite: Mahanandia, A., Lal, M. M., Singh, T. G., Nandhagopal, N., and Singh, S.: Structure-controlled Uranium + REE mineralization in low temperature basinal brine hydrothermal system at the contact of Kaladgi Basin and Peninsular Gneissic Complex, South India, EGU General Assembly 2026, Vienna, Austria, 3–8 May 2026, EGU26-2923, https://doi.org/10.5194/egusphere-egu26-2923, 2026.

EGU26-3001 | Posters virtual | VPS25

Thermo-Poro-Elastic effects as hidden drivers of gravity signals in volcanic systems 

Massimo Nespoli, Maurizio Bonafede, and Maria Elina Belardinelli

Gravity observations are widely used in volcanic monitoring to infer subsurface mass redistributions, commonly interpreted in terms of magma intrusion. However, gravity changes may also arise from thermo-poro-elastic (TPE) processes associated with temperature and pore-pressure variations in fluid-saturated reservoirs. Neglecting these effects can lead to ambiguous or misleading interpretations of gravity signals during volcanic unrest.

The recent development of TPE inclusion models allows us to describe the mechanical fields induced by fluid-saturated rock volumes undergoing pore-pressure and temperature variations. These sources can coexist with magmatic sources within volcanic systems and are typically located at shallower depths than the deep magmatic reservoir, which acts as the primary engine by releasing hot fluids. These exsolved fluids rise from depth and either accumulate in, or migrate through, overlying brittle rock volumes, which respond to thermal and pore-pressure perturbations and therefore act as secondary sources of deformation and gravity change. In this work, we consider a disk-shaped TPE inclusion, a geometry that has been successfully applied in previous studies to represent deformation fields that are predominantly radial and associated with axisymmetric sources.

The results show that gravity variations induced by a TPE inclusion depend strongly on the fluid phase. Both liquid water and gaseous fluids can produce the same significant ground uplift, but lead to different gravity residuals: negative for liquid water and minor but positive for gaseous fluids. In contrast, condensation or vaporization of a thin layer near the surface can generate large gravity changes without notable deformation. As a result, heating and pressurization of a TPE inclusion can mask or weaken the gravitational signature of magma ascent, complicating the interpretation of gravity data and highlighting the need to account for hydrothermal effects when estimating magma volumes during unrest.

Gravity data collected over the past decades at the Campi Flegrei caldera (Italy) provide an ideal test site for applying our model and offer intriguing insights into both past and current unrest phases, although our results are applicable to any volcanic system with an active hydrothermal system. These findings highlight the importance of incorporating TPE effects into gravity data interpretation and integrated volcano monitoring strategies. Accounting for them improves our ability to distinguish between magmatic and hydrothermal contributions, leading to more robust assessments of subsurface dynamics and volcanic hazards.

How to cite: Nespoli, M., Bonafede, M., and Belardinelli, M. E.: Thermo-Poro-Elastic effects as hidden drivers of gravity signals in volcanic systems, EGU General Assembly 2026, Vienna, Austria, 3–8 May 2026, EGU26-3001, https://doi.org/10.5194/egusphere-egu26-3001, 2026.

EGU26-4327 | ECS | Posters virtual | VPS25

The initial results about optimum the random walk process noise rate for GNSS tropospheric delay estimation 

Miaomiao Wang, Borui Lu, and Qingmin Zhong

Abstract: Unlike ionosphere, troposphere is nondispersive and delays cannot be determined from observations of signals at different radio frequencies. In GNSS data processing, station height, receiver clock error and tropospheric delay are highly correlated to each other, especially in kinematic situations. Although zenith hydrostatic delay can be provided with sufficient accuracy, zenith wet delay, which is more spatially and temporally varying than hydrostatic component, has to be carefully processed. Usually, temporal dependence of tropospheric delays at zenith is modeled as a random walk process with a solely given process noise rate σrw in GNSS processing. The usually used σrw is a constant throughout whole process session and is in range of 3~10 mm per sqrt hour. This setting is generally appropriate for desirable GNSS positioning estimation in normal conditions. However, modeling zenith tropospheric delay by using a constant σrw in whole session will be unsatisfactory in cases of special weather conditions, e.g., the shower case. The σrw is a measure of magnitude of typical variation of zenith path delay or its residual after calibration in a given time. Values of σrw that are too large could weaken strength for geodetic estimation, while values that are too small may introduce systematic errors, since a strong constraint for tropospheric unknowns is imposed to stabilize the system. The random walk model for wet delay must be constrained approximately to "correct" value to obtain optimum parameters estimates. Assuming temporal change of tropospheric delay at an arbitrary station can be described by random walk model, the process noise levels were calculated by some scholars. They employed water vapor radiometric, surface meteorological measurements and numerical weather model data set for optimum selection of σrw. In general, although a lot of efforts have made to optimize post-processing and/or real-time GNSS tropospheric delay estimation, stochastic modeling of zenith wet delay remains insufficiently investigated, especially for kinematic applications. Since temporal variation of zenith wet delay depends on water vapor content in atmosphere, it seems to be reasonable that constraints should be geographically and/or time dependent. In this work, we first investigate sensitivity of both station coordinates and zenith wet delay estimators on different σrw values, and then try to propose to take benefit from post-processed static or kinematic estimated tropospheric delay to obtain the optimum σrw. The general objective is that if zenith tropospheric delays are of different variation characteristic, e.g., relatively stable or rapid changing, then a varying σrw, e.g., small or large value, could be employed, which should be more theoretically feasible compared with a invariant σrw. The initial results show that the new method can efficiently obtain epoch-wise σrw values at different stations. Compared to results from conventional constant σrw value, time-varying noise rate can improve precision of PPP solutions. We note that this first results represent performance view at several selected stations, more works should be done to draw global or even long-term conclusions.

This work is supported by National Natural Science Foundation of China (42304010), Youth Foundation of Changzhou Institute of Technology (YN21046).

How to cite: Wang, M., Lu, B., and Zhong, Q.: The initial results about optimum the random walk process noise rate for GNSS tropospheric delay estimation, EGU General Assembly 2026, Vienna, Austria, 3–8 May 2026, EGU26-4327, https://doi.org/10.5194/egusphere-egu26-4327, 2026.

The Yanshan-Liaoning metallogenic belt (YLMB), the second-largest molybdenum deposit cluster in China, hosts over twenty porphyry molybdenum deposits, including the large-scale Caosiyao, Sadaigoumen, and Dasuji deposits, as well as the newly discovered medium- to large-scale Qiandongdamiao, Zhujiawa, and Taipingcun deposits. Geochronological data indicate that the duration of molybdenum mineralization spanned ca. 100 Myrs, from the Triassic to Early Cretaceous (240–140 Ma). However, the reasons for such a prolonged or multi-period metallogenic event, and the magmatic and geodynamic processes controlling the spatial–temporal distribution of these deposits, remain poorly understood.

Here we summarize the geological, chronological and geochemical data from selected molybdenum deposit to reconstruct the temporal–spatial distribution and tectonic setting of ore- metallogenic history in the YLMB. The formation of molybdenum deposit in the YLMB can be divided into three periods of 240–220 Ma, 185–180 Ma and 160–140 Ma. The ore-forming intrusions among these three periods illustrate an overall characteristic that metaluminous to peraluminous, high-K calc-alkalic to shoshonite series acidic rocks, and the source of intrusions is the Archaean–Paleoproterozoic lower crust. Through in-depth analysis of Sr-Nd-Hf isotopic data, we find that the magma source that during the 185-180 Ma stage is relatively younger, mainly reflecting the partial melting of Paleoproterozoic crust, whereas the magma source that during the 240–220 Ma and 160–140 Ma stages likely are contained both from the Paleoproterozoic and Neoarchean crust. Further calculations using trace element content ratios reveal a shallower magma source along the magma evolution during the 240–220 Ma period, which supported by the gradual decrease trend in crustal thickness. In contrast, the calculation of crustal thickness during the 185–180 Ma and 160–140 Ma stages show an increase trend, suggested an thicken process in the depth of the magma source.

Spatially, the porphyry molybdenum deposits formed during these three periods exhibit distinct geographic distributions. Deposits formed at 240–220 Ma are mainly located in the northern part of the YLMB, including the Chengde-Zhangbei-Fengning district. Those formed at 185–180 Ma are primarily located in the Liaoxi district, eastern part of the YLMB while deposits formed at 160–140 Ma are located in the southern part of the YLMB, particularly in the Xinghe-Zhangjiakou-Xinglong district. We propose that the variations of the spatial–temporal distribution and geochemical characteristics of the molybdenum deposit formed during different periods in the YLMB are controlled by variations of their geodynamic settings. The porphyry molybdenum deposits formed in 240–220 Ma are under the post-collision or post-orogenic extension environment between the North China Plate and the Siberian Plate in the Middle Triassic. Deposits formed in 185–180 Ma are under the extension environment in the early stage of the Yanshanian movement, and porphyry molybdenum deposits formed in 160–140 Ma are in the strong extrusion environment in the main stage of the Yanshanian movement.

Our findings demonstrate the multi-period metallogenic history of the YLMB, highlighting the critical role of magma source, storage depth, and geodynamic setting in controlling the formation of porphyry molybdenum deposits.

How to cite: Jiang, C., Liu, Q., Cao, L., Li, A., and Fu, L.: Magmatic and geodynamic processes control on the formation of porphyry molybdenum deposits: Insights from the Yanshan-Liaoning metallogenic belt, northern margin of North China Craton, EGU General Assembly 2026, Vienna, Austria, 3–8 May 2026, EGU26-4396, https://doi.org/10.5194/egusphere-egu26-4396, 2026.

EGU26-4988 | ECS | Posters virtual | VPS25

Adsorption of Helium and Argon on the (001) Surface of Periclase: A First-Principles Study 

Anjitha Karangara and Pratik Kumar Das

The distribution of rare gases within the Earth’s interior has caught the attention of scientists for the past few years. The inertness and volatility of noble gases make them excellent tracers for understanding the chemical evolution of Earth’s mantle and atmosphere. Previous studies indicate that noble gases can be found associated with clathrates, form their own oxides, or, in some cases, noble gases such as helium and xenon can even bond with Fe under extreme pressure (p) - temperature (T) conditions like those in Earth’s core. However, the ability of lower mantle mineral phases to house rare gases remains poorly understood, leaving important gaps in knowledge. Helium and argon are noble gases of interest in this study. The isotopes 4He and 40Ar are produced from the radioactive decay of 238U and 40K within the Earth’s interior, while 3He and 36Ar are regarded as primordial, introduced during the accretion of Earth. Dong et al. (2022) revealed that noble gases can become reactive under mantle pressure conditions. Still, their ability to be incorporated into mantle minerals via adsorption needs to be thoroughly studied, as there are many limitations in the experiments conducted to measure the solubility of noble gases in minerals under mantle p-T conditions. In this study, we investigated the adsorption behavior of helium and argon on the (001) plane of periclase (MgO) by employing first-principles density functional theory (DFT) calculations.

Adsorption energies were estimated across pressures ranging from 0 to 125 GPa, representative of conditions throughout Earth’s interior, i.e., approximately up to the Core Mantle Boundary (CMB). At ambient pressure, both helium and argon showed negative adsorption energies, indicating stable adsorption relative to isolated species (MgO, Ar, He). These energies became increasingly negative with pressure, becoming notably negative beyond 75 GPa which corresponds to lower mantle pressures. This may be due to the accelerated reactivity of noble gases at extreme pressure conditions, as reported in previous studies. Additionally, under all pressure conditions argon exhibited stronger adsorption than helium, indicating enhanced argon retention in lower mantle conditions. However, further investigations into the mechanical and dynamical stability of these adsorbed structures are required to completely understand the mechanisms governing noble gas occurrence in the Earth’s lower mantle.

How to cite: Karangara, A. and Kumar Das, P.: Adsorption of Helium and Argon on the (001) Surface of Periclase: A First-Principles Study, EGU General Assembly 2026, Vienna, Austria, 3–8 May 2026, EGU26-4988, https://doi.org/10.5194/egusphere-egu26-4988, 2026.

EGU26-5147 | Posters virtual | VPS25

Soil CO₂ Emissions as Indicators of Fluid Pathways in Volcanic–Tectonic Environments: Insights from Vulcano Island 

Sofia De Gregorio, Marco Camarda, Giorgio Capasso, Roberto M.R. Di Martino, Antonino Pisciotta, and Vincenzo Prano

Soil CO₂ emission is a key proxy for investigating fluid migration processes associated with volcanic and tectonic activity. In particular, the analysis of the spatial distribution of geochemical anomalies represents an effective tool for identifying active structures and zones of ongoing deformation. Numerous studies have shown that faults and fracture systems play a fundamental role in controlling the localization and evolution of surface geochemical anomalies.

Vulcano Island (Aeolian Archipelago, Italy) is characterized by intense hydrothermal activity and persistent soil CO₂ emissions, providing a natural laboratory to investigate the relationships between fluid circulation and active tectonic structures. In this study, we present an integrated analysis of soil CO₂ fluxes based on results obtained from periodic surveys and continuous soil CO₂ flux records acquired at key sites across the island.

Periodic measurements are performed on fixed spatial grids, allowing the production of soil CO₂ flux maps and the identification of areas characterized by elevated degassing rates. At selected sites, the carbon isotopic composition of gases is analyzed to constrain gas sources.

These spatial datasets provide insights into the structural control exerted by the main tectonic lineaments on gas release at the surface. Continuous CO₂ flux monitoring enables the investigation of temporal variations and transient degassing signals potentially related to seismic and tectonic processes. In particular, the recent volcanic crisis at Vulcano Island, started on 2021, characterized by a marked increase in soil CO₂ flux, allowed a more detailed identification of preferential CO₂ emission pathways, highlighting zones of enhanced permeability associated with fault and fracture systems.

This work is carried out within the framework of the CAVEAT project (Central-southern Aeolian islands: Volcanism and tEArIng in the Tyrrhenian subduction system), which aims to provide a comprehensive understanding of the current geodynamics of the southern Tyrrhenian region.

How to cite: De Gregorio, S., Camarda, M., Capasso, G., Di Martino, R. M. R., Pisciotta, A., and Prano, V.: Soil CO₂ Emissions as Indicators of Fluid Pathways in Volcanic–Tectonic Environments: Insights from Vulcano Island, EGU General Assembly 2026, Vienna, Austria, 3–8 May 2026, EGU26-5147, https://doi.org/10.5194/egusphere-egu26-5147, 2026.

EGU26-6294 | ECS | Posters virtual | VPS25

Temperature-dependence of CO2 drawdown into Mg-bearing minerals. 

Sumaila Z. Sulemana, Sasha Wilson, Annah Moyo, Shaheen Akhtar, Ian M. Power, and Sylvia Sleep

Mg-bearing minerals, including brucite [Mg(OH)2], lizardite [Mg₃(Si₂O₅)(OH)₄] and iowaite [Mg₆Fe³⁺₂(OH)₁₆Cl₂·4H₂O] are variably reactive with carbon dioxide (CO2) at Earth’s surface conditions and can be used to mineralize and sequester this greenhouse gas. Here, we assess the impact of temperature (5, 20 and 40 °C) on the rate of CO2 mineralization of these minerals. At each temperature, mineral powders (~100 mg ) were placed in a 7.5-litre flow-through reactor that was supplied with humidified laboratory air (0.042% CO2; 100% RH) at ~200 mL/min. Subsamples (n = 54) of each mineral were collected over 3 months and analyzed (XRD, TIC, BET) to ascertain the amount and rate of carbonation as a function of time, temperature, and mineral feedstock.

Preliminary X-ray diffraction (XRD) results show the formation of dypingite [Mg₅(CO₃)₄(OH)₂·5H₂O] and a decrease in the abundance of brucite over time. The 003 peak of iowaite shifted to smaller d-spacings, indicating replacement of chloride by carbonate ions and a transition to a more pyroaurite-rich [Mg₆Fe³⁺₂(CO₃)(OH)₁₆·4H₂O] composition. Total Inorganic Carbon (TIC) measurements were used to determine the amount and rate of carbonation as a function of time, temperature, and mineralogy.

The results of this study will help us estimate the carbonation kinetics of these minerals in ultramafic ores and mine tailings under different temperature conditions relevant to large-scale deployment of CO2 mineralization at mines across the globe.

How to cite: Sulemana, S. Z., Wilson, S., Moyo, A., Akhtar, S., Power, I. M., and Sleep, S.: Temperature-dependence of CO2 drawdown into Mg-bearing minerals., EGU General Assembly 2026, Vienna, Austria, 3–8 May 2026, EGU26-6294, https://doi.org/10.5194/egusphere-egu26-6294, 2026.

The main focus of the study is to calibrate Sentinel-1 InSAR Line-of-Sight (LOS) velocities along a ~700 km North-South transect extending from the Black Sea coast (Kastamonu-Samsun) to the Mediterranean (Mersin-Gaziantep). This transect encompasses diverse tectonic regimes, including the North Anatolian Fault Zone, the Central Anatolian Block, and the junction of the East Anatolian Fault Zone. This complex structure of the transect requires detailed analysis of the GNSS-InSAR calibration procedure including validation. 

Across the study region, processed LiCSAR products are integrated with 3D velocities derived from the continuous local CORS network (21 stations) and an extensive campaign-based GNSS network (200 stations). For calibration, GNSS velocities are first projected into the satellite LOS geometry using LOS vectors derived from coherent InSAR pixels within a 1-km radius. The velocity bias (ΔVlos) is calculated at continuous GNSS locations. This correction surface is propagated using various conventional and Machine Learning techniques independently, including Kriging, Weighted Least Squares (WLS) based Quadratic Surface fitting, Thin Plate Spline (TPS) and Radial Basis Functions (Gaussian, Multiquadric, and Inverse Multiquadric). To address specific error sources, the contributions of topography-correlated atmospheric delays and local spatial trends are also analyzed by Geographically Weighted Regression (GWR) and Random Forest regression. Cross-validation is applied to assess the quality of each model individually where spatial random sampling and plate boundaries are also considered. This study presents preliminary results for obtaining a validated basis for generating up-to-date velocity fields over Türkiye.

How to cite: Elvanlı, M. and Durmaz, M.: Comparative Analysis of Machine Learning and Geostatistical Approaches for GNSS-InSAR Integration: A Case Study in Anatolia, EGU General Assembly 2026, Vienna, Austria, 3–8 May 2026, EGU26-7178, https://doi.org/10.5194/egusphere-egu26-7178, 2026.

EGU26-7764 | ECS | Posters virtual | VPS25

Impact of Storm-Adapted DORIS Processing on Orbit Quality and Earth Rotation Parameters During Geomagnetic Storms  

Vikash Kumar, Petr Stepanek, Vratislav Filler, Nagarajan Balasubramanian, and Onkar Dikshit

Geomagnetic storms (GS) significantly perturb the near-Earth environment, leading to enhanced thermosphere density, increased non-conservative forces, and degraded satellite orbit determination, particularly for Doppler-based techniques such as DORIS. In this study, we investigate and improve DORIS orbit determination performance during GS conditions by developing storm-adapted processing strategies. Storm days were classified using geomagnetic indices and categorized into moderate to severe storm levels (G3-G5).

Four distinct processing strategies were implemented and evaluated: a standard operational solution and three experimental storm-adapted solutions, designed through systematic modifications of drag constraints and observation-elimination criteria. These strategies were tested through targeted daily and weekly experiments conducted across multiple DORIS-equipped satellites, with a particular emphasis on periods of intense storms.

The storm-adapted strategies demonstrate clear performance improvements relative to the standard solution during geomagnetic storms. The modified strategies reduce orbit residual RMS in all orbital components, improve Length-of-Day (LOD) variance by approximately 40-80%, and decrease LOD mean biases by nearly 60%. Additionally, Earth Rotation Parameters (ERP) exhibit notable improvements, with reductions of approximately 22–25% in both bias and variability for the polar motion components (X/Y pole). Among the tested configurations, the combined strategy, particularly when applied with zero-rotation constraints, consistently delivers the best performance during intense storm conditions (Kp ≥ 8+). These results demonstrate that storm-adapted DORIS processing strategies significantly enhance orbit and geophysical parameter estimation during disturbed space-weather conditions.

How to cite: Kumar, V., Stepanek, P., Filler, V., Balasubramanian, N., and Dikshit, O.: Impact of Storm-Adapted DORIS Processing on Orbit Quality and Earth Rotation Parameters During Geomagnetic Storms , EGU General Assembly 2026, Vienna, Austria, 3–8 May 2026, EGU26-7764, https://doi.org/10.5194/egusphere-egu26-7764, 2026.

EGU26-8505 | ECS | Posters virtual | VPS25

Study on the Source of Ore-Forming Materials of the Sangmuchang Barite Deposit in Northern Guizhou 

Yunming Chen, Jian Wang, and Zhichen Liu

Abstract: The study of fluid inclusions and sulfur isotope characteristics of barite deposits is crucial for tracing the source of ore-forming materials and predicting prospecting targets. Current research indicate that the Sangmuchang barite deposit in northern Guizhou is primarily hosted within the joint fractures of dolomites in the Sinian Dengying Formation and Cambrian Qingxudong Formation. The contact between ore bodies and surrounding rocks is distinct, with the orebodies occurring as veins and lenticular. The ore textures are mainly veinlets, stockworks, massive, and banded, while the ore structures consist of inequigranular tabular-columnar blastic, fine-crystalline, and arenaceous texture.  Fluid inclusion studies reveal that  the inclusions are single-phase aqueous inclusions. Microthermometric measurements of 33 inclusions show that their homogenization temperatures range from 81°C to 182°C, with an average of 132°C; Salinity values vary from 9.61 wt.% NaCl eqv to 20.63 wt.% NaCl eqv, with an average of 17.53 wt.% NaCl eqv. Ten sulfur isotope analyses from the deposit show that the δ³⁴SV-CDT values range from 40.89‰ to 46.95‰, with a mean of +44.51‰.The characteristics of fluid inclusion salinity, temperature and sulfur isotopes suggest that the ore-forming fluids of this barite deposit are characterized by moderate-low temperature and moderate-high salinity. These ore-forming fluids were mainly derived from basin brines, with contributions from meteoric water. The significant enrichment of heavy sulfur isotopes and homogeneous sulfur isotope composition reveal that the sulfur source of ore-forming materials in this barite deposit is a relatively singular source for the sulfur in the ore-forming materials, which is similar to the δ³⁴S characteristics of Sinian marine evaporites, suggesting a close genetic relationship between the sulfur source and evaporites. Therefore, the Sangmuchang barite deposit is interpreted as a moderate-low temperature hydrothermal deposit.  It was formed by the migration of moderate -low temperature hydrothermal fluids in the sedimentary basin, which leached ore-forming materials from underlying and surrounding barium-rich evaporite sequences, followed by precipitation within structural fracture zones under the mixing of meteoric water. The structural fracture zones and areas indicative of fluid migration pathways along the basin margin are important targets for exploration prediction. Keywords: ore-forming fluid; fluid inclusion; sulfur isotope; barite; northern Guizhou

How to cite: Chen, Y., Wang, J., and Liu, Z.: Study on the Source of Ore-Forming Materials of the Sangmuchang Barite Deposit in Northern Guizhou, EGU General Assembly 2026, Vienna, Austria, 3–8 May 2026, EGU26-8505, https://doi.org/10.5194/egusphere-egu26-8505, 2026.

EGU26-10489 | ECS | Posters virtual | VPS25

3-D Anisotropic Structure of the Upper Mantle beneath the Iranian Plateau Using SKS Splitting Intensity Tomography 

Shiva Arvin, Haiqiang Lan, Ling Chen, Zhaoke Ke, Yi Lin, Li Zhao, and Morteza Talebian

The Iranian plateau, characterized by the Arabia-Eurasia continental collision in the Zagros and the Makran oceanic subduction system, presents a unique opportunity to investigate the underlying processes of lithospheric deformation and upper-mantle dynamics. Previous studies of upper mantle seismic anisotropy, mostly using SK(K)S splitting and occasionally direct S waves revealed complex patterns for the fast axes. The observed rotations of fast axis obtained from S and SK(K)S waves along different tectonic setting, the difference in fast directions between S and SK(K)S phases in central Iran, evidence for two-layer anisotropy, and ambiguity regarding the depth origin of observed anisotropy emphasize the need for further studies. These challenges, together with the pronounced tectonic heterogeneity of the Iranian plateau, call for tomographic approaches that allows for the localization of anisotropic structure. In this study, we utilize SKS splitting intensity tomography to elucidate the depth distribution of the anisotropic properties of the upper mantle beneath the Iranian plateau. Our dataset includes teleseismic events with magnitude above 5.5 and epicentral distances between 90 and 130 degrees recorded by 151 permanent (2015-2021) and 296 temporary seismic stations (2003-2021). We employ a three-dimensional full-wave anisotropy tomography method using splitting intensity, which provides enhanced depth resolution compared to traditional shear wave splitting methods. This method utilizes perturbation theory to establish the linear relationship between splitting intensity and anisotropic parameters, including the azimuth of fast axis and anisotropy strength, and incorporates Green's function databases to efficiently compute the sensitivity or Fréchet kernels. Splitting intensity measurements are inverted to construct a three-dimensional model of upper-mantle azimuthally anisotropic structure beneath the study area. Results show clear lateral differences in anisotropic strength and fast-axis orientation specifically between the Zagros and Alborz regions, as well as the adjacent domains. Vertical profiles illustrate depth-dependent heterogeneous anisotropic structures across the lithosphere–asthenosphere boundary into the asthenospheric upper mantle. These variations likely reflect the combined influence of regional tectonic processes, continental collision, lithospheric deformation, and present-day mantle flow patterns beneath the Iranian plateau. Our results highlight the potential of SKS splitting intensity tomography to resolve complex mantle anisotropy and shed new light on the three-dimensional deformation structure of the upper mantle. The observed lateral and depth variations in anisotropy provide new insights into how the relationship between surface tectonics and upper-mantle deformation varies spatially across major tectonic domains such as the Zagros, Makran, Central Iran, and the Alborz.

How to cite: Arvin, S., Lan, H., Chen, L., Ke, Z., Lin, Y., Zhao, L., and Talebian, M.: 3-D Anisotropic Structure of the Upper Mantle beneath the Iranian Plateau Using SKS Splitting Intensity Tomography, EGU General Assembly 2026, Vienna, Austria, 3–8 May 2026, EGU26-10489, https://doi.org/10.5194/egusphere-egu26-10489, 2026.

EGU26-11094 | ECS | Posters virtual | VPS25

Hydrothermal remobilization and redox trapping of uranium in metabasalts of the Bodal mine, Central India 

Swati Ganveer, Smruti Prakash Mallick, and Kamal Lochan Pruseth

Uranium is a strategically important metal with applications in nuclear energy, medicine, radiometric dating, food processing, industrial radiography, material sciences, and catalysis. This study presents a detailed microtextural and geochemical investigation of uranium mineralization from the Bodal uranium mine, Mohla-Manpur-Chowki, Central India. Uranium occurs as both crystalline and colloidal precipitates, with coffinite [U(SiO4)1-x(OH)4x] and gummite representing the dominant uranium-bearing phases. The mineralization is spatially and genetically associated with altered metabasalts. Petrographic and geochemical evidence indicates that late-stage hydrothermal alteration played a crucial role in uranium remobilization and ore enrichment. Sulphide minerals, including cobaltite (CoAsS), galena (PbS), arsenopyrite (FeAsS), and chalcopyrite (CuFeS2), are intimately associated with uranium phases and likely acted as effective reductants and sorption substrates, facilitating uranium precipitation under reducing conditions. The ore assemblage is accompanied by abundant accessory minerals such as zircon, allanite, and apatite. Substitution of U4+ for Zr4+ in zircon locally records uranium-rich hydrothermal fluids and contributes to zirconium enrichment. Collectively, these observations suggest that hydrothermal fluid–rock interaction and redox-controlled precipitation were the dominant processes responsible for uranium enrichment at the Bodal mine.

Keywords: Uranium mineralization; Hydrothermal alteration; Redox-controlled precipitation; Bodal mine; Central India


How to cite: Ganveer, S., Mallick, S. P., and Pruseth, K. L.: Hydrothermal remobilization and redox trapping of uranium in metabasalts of the Bodal mine, Central India, EGU General Assembly 2026, Vienna, Austria, 3–8 May 2026, EGU26-11094, https://doi.org/10.5194/egusphere-egu26-11094, 2026.

The Kirazlı porphyry and high-sulfidation (HS) epithermal system is situated in the central Biga Peninsula of northwestern Türkiye, a region characterized by the protracted closure of the Tethyan oceanic branches and the subsequent collision of Gondwana-derived continental fragments with the Sakarya Zone. This geodynamic framework facilitated the development of diverse tectono-magmatic environments, leading to the formation of porphyry and associated hydrothermal mineralization during the Cenozoic. Based on established geochronological data, magmatism in the Biga Peninsula occurred in five discrete chronostratigraphic episodes: Paleocene to Early Eocene (65–49 Ma), Middle–Late Eocene (49–35 Ma), Late Eocene to Early Oligocene (35–23 Ma), Late Oligocene to Middle Miocene (~23–14 Ma), and Late Miocene to Pliocene (14–5 Ma). Mineralization within the Kirazlı district is temporally constrained to two primary intervals—Late Eocene to Early Oligocene and Oligocene to Early Miocene corresponding to specific magmatic pulses and structurally mediated by major regional shear zones.

Integration of the ages of fault-hosting lithologies, structural styles, fault geometries, and paleostress reconstructions indicates three distinct tectonic phases consistent with the regional Cenozoic evolution: (1) NW–SE extension (Phase-1), (2) NNE–SSW extension (Phase-2), and (3) NE–SW extension (Phase-3). Detailed field observations, petrographic analysis, and microstructural investigations of oriented samples demonstrate that the porphyry and HS-epithermal stages were governed by these shifting stress regimes. B- and D-veins associated with the porphyry stage exhibit preferred orientations along an ENE–WSW strike, consistent with the NW–SE extensional regime of Phase-1. In contrast, late-stage quartz veins within the HS-epithermal overprint formed under a NNE–SSW extensional stress field, aligning with the Phase-2 tectonic pulse.

Analysis of fault planes for both Phase-2 and Phase-3 indicates that ENE–WSW and NE–SW strike directions are common to both phases. Phase-3 displays kinematic and geometric features characteristic of the modern transtensional NE–SW and strike-slip regime currently active in the Biga Peninsula. Correlation of these structural data with magmatism–mineralization age constraints indicates that the porphyry and HS-epithermal components of the Kirazlı system were emplaced during distinct tectonic periods. This evolution reflects the transition from a post-collisional setting to the current extensional and strike-slip dominated regime of western Anatolia.

How to cite: Çam, M., Kuşcu, İ., and Kaymakcı, N.: Tectono-Magmatic Evolution and Structural Controls on the Kirazlı Porphyry-High Sulfidation Epithermal System, Biga Peninsula, NW Türkiye, EGU General Assembly 2026, Vienna, Austria, 3–8 May 2026, EGU26-11195, https://doi.org/10.5194/egusphere-egu26-11195, 2026.

EGU26-13441 | Posters virtual | VPS25

High-Temperature phase transitions in serpentine 

R.Valli Divya and Rajkrishna Dutta

Serpentines are widely used to investigate lithospheric strength, subduction-zone processes, and the cycling of carbon and water in the Earth. In this work we have investigated the high-temperature phase transitions in natural serpentine with respect to the time of heating. The starting material was obtained by grinding natural serpentine sample and verified using powder X-ray diffraction (λ = 1.5406 Å). The powder was heated at temperatures from 300 to 1000 °C in 100 °C increments for durations ranging from 30 minutes to 24 hours, using 1–6 hour intervals. No phase changes were observed up to 400 °C. Two forsterite (Mg2SiO4) peaks at 35.993° and 36.857° first appeared in the XRD pattern at 500 °C after 3 hours of heating. The first appearance of enstatite (MgSiO3), marked by peaks at 28.1880 and 31.2890 were observed in the XRD pattern at 6000C starting at 8 hours of heating. Our work provides a robust temperature-time (T-t) phase diagram. The systematic T-t framework shows that serpentine breakdown and forsterite/enstatite formation depend on both temperature and duration of heating, rather than temperature alone. This can have implications for subducting slabs; where mineral transformations, fluid release, and associated changes in rheology may be governed by slab thermal histories and residence times at depth. These effects can influence interpretations of slab strength, seismic structure, and volatile cycling in subduction zones.

How to cite: Divya, R. V. and Dutta, R.: High-Temperature phase transitions in serpentine, EGU General Assembly 2026, Vienna, Austria, 3–8 May 2026, EGU26-13441, https://doi.org/10.5194/egusphere-egu26-13441, 2026.

EGU26-14641 | ECS | Posters virtual | VPS25

Improving GNSS Water Vapor Monitoring in Cyprus climate change hotspot Using MWR-Derived Tm 

Christina Oikonomou, Avinash N. Parde, and Haris Haralambous

The Eastern Mediterranean is a recognized climate-change hotspot, characterized by strong summertime subsidence, sharp land–sea moisture gradients, and frequent thermodynamic extremes. Although Global Navigation Satellite System (GNSS) observations provide continuous and all-weather monitoring of precipitable water vapor (PWV), their accuracy critically depend on the weighted mean atmospheric temperature (Tm) used to convert zenith total delay (ZTD) into water vapor content. This study presents the first comprehensive analysis of radiometric data acquired under the Cyprus GNSS Meteorology (CYGMEN) strategic infrastructure project, established to monitor the thermodynamic state of the Eastern Mediterranean atmosphere. This study quantifies the impact of Tm uncertainty on GNSS-PWV retrievals and assesses the benefit of ground-based microwave radiometer (MWR) observations under extreme thermodynamic conditions.

MWR- and GNSS-derived products are evaluated against Vaisala RS41 radiosonde observations at Nicosia, Cyprus, for the period March–October 2025. Baseline validation demonstrates that the MWR provides highly accurate temperature profiling in the boundary layer (correlation coefficient r > 0.98) and reliable integrated water vapor estimates, with an RMSE of 1.72 kg m⁻² relative to radiosondes. However, the MWR exhibits limited skill in resolving vertical humidity structure, as indicated by a negative coefficient of determination (R² = −2.87) for moisture scale-height comparisons. This highlights that the primary strength of the MWR lies in constraining the column-integrated thermodynamic state rather than detailed vertical moisture profiling.

Incorporation of MWR-derived Tm into the GNSS processing chain substantially improves PWV retrievals during periods of strong thermodynamic variability, particularly under high-PWV and subsidence-dominated conditions typical of the Eastern Mediterranean summer. The proposed GNSS–MWR synergistic framework provides a physically consistent pathway to reduce Tm-related uncertainties and enhance GNSS-PWV reliability in climate-sensitive regions.

How to cite: Oikonomou, C., Parde, A. N., and Haralambous, H.: Improving GNSS Water Vapor Monitoring in Cyprus climate change hotspot Using MWR-Derived Tm, EGU General Assembly 2026, Vienna, Austria, 3–8 May 2026, EGU26-14641, https://doi.org/10.5194/egusphere-egu26-14641, 2026.

EGU26-15407 | ECS | Posters virtual | VPS25

 Temporal evaluation of El Chichon´s geothermal potential in the period of 1983-2025.  

José Luis Salas Ferman, Mariana Patricia Jácome Paz, Robin Campion, María Aurora Armienta, and Salvatore Inguaggiato

El Chichón is an active volcano in Chiapas, Mexico, that features a hydrothermal system characterized by thermal springs, fumaroles and an acid crater lake. Many studies have focused on tracking the geochemical evolution of its fluids since its last eruption in 1982 and some have specifically aimed to evaluate the geothermal potential.  This work assesses the evolution of the geothermal potential through time using published geochemical data (1983-2025). We use geochemical diagrams, temperatures estimated with geothermometers and water-rock interaction analysis to identify the main system changes that influence the geothermal potential estimations. Given that El Chichón has been considered  a geothermal prospect since the 1980s, we discuss the possible uses of this resource in terms of its recent active seismicity, the risk scenarios and the local socio-cultural context. 

How to cite: Salas Ferman, J. L., Jácome Paz, M. P., Campion, R., Armienta, M. A., and Inguaggiato, S.:  Temporal evaluation of El Chichon´s geothermal potential in the period of 1983-2025. , EGU General Assembly 2026, Vienna, Austria, 3–8 May 2026, EGU26-15407, https://doi.org/10.5194/egusphere-egu26-15407, 2026.

Traditional methods for determining geopotential and height require successive transfers of leveling and gravity measurements, which are prone to error accumulation, face challenges in transoceanic applications, and are generally time-consuming, labor-intensive, and inefficient. Based on the principles of general relativity, an alternative approach using high-precision time-frequency signals to determine geopotential can overcome these limitations. In this study, simulation experiments were conducted to determine geopotential differences using BDS and Galileo five-frequency undifferenced carrier phase time-frequency transfer technology. The simulations employed clocks with different performance characteristics, utilizing precise clock offsets and multi-frequency observation data from both systems. The results show that the frequency stability achieved by BDS and Galileo five-frequency undifferenced carrier phase time-frequency transfer can reach approximately 3×10⁻¹⁷. The root mean square of the determined geopotential differences corresponds to centimeter-level equivalent height accuracy, and the convergence accuracy of the geopotential difference by the final epoch can reach better than 3.0 m²·s⁻². Given the rapid development of GNSS multi-frequency signals and ongoing improvements in the precision of products such as code and phase biases, geopotential determination based on Galileo and BDS multi-frequency signals is expected to have broader application prospects in the future. This study was supported by the National Natural Science Foundation of China project (No. 42304095), the Key Project of Natural Science Research in Universities of Anhui Province (No. 2023AH051634), the Chuzhou University Research Initiation Fund Project (No. 2023qd07).

How to cite: Xu, W. and Song, J.: Geopotential Difference Determination via BDS and Galileo Multi-Frequency Time-Frequency Signals, EGU General Assembly 2026, Vienna, Austria, 3–8 May 2026, EGU26-15725, https://doi.org/10.5194/egusphere-egu26-15725, 2026.

EGU26-15990 | ECS | Posters virtual | VPS25

How Well Is the Mantle Sampled? A Global Voxel-Based Analysis of Residence Time and Flux from Forward- and Reverse-Time Mantle Convection 

Gabriel Johnston, Molly Anderson, Alessandro Forte, and Petar Glišović

How well mixed is Earth's mantle? Are there primordial reservoirs? What fraction of the mantle feeds surface volcanism? We attempt to address these questions using large-scale Lagrangian particle tracking in time-reversed and forward convection models. We track particles backward in time using a Back-and-Forth Nudging (BFN) method applied to time-reversed thermal convection, initialized with a present-day seismic–geodynamic–mineral physics model (Glisovic & Forte, 2016, 2025). We likewise carried out long-term (multi-hundred-million-year) forward-in-time mantle convection simulations initialized with present-day mantle structure inferred from tomography. In all cases, we employ mantle viscosity structure that has been independently constrained and verified against a wide suite of present-day geodynamic observables that include free-air gravity anomalies, dynamic surface topography, horizontal divergence of plate velocities, excess core-mantle boundary ellipticity, and glacial isostatic adjustment data. A voxel-based analysis quantifies sampling density, residence time, and flux throughout the mantle.

We use different particle starting conditions, each designed to address a specific aspect of mantle mixing. To identify long-lived isolated regions, we track uniformly distributed particles both forward and backward in time, calculating residence times to locate candidate reservoirs. To estimate the sampling of lower mantle material in the upper mantle, we initialize particles in the D" layer and track them forward to determine what fraction reaches the upper mantle. To address plume dynamics and sampling, we place cylindrical arrays of particles beneath present-day hotspots and track them backward, using the statistical evolution of their standard deviation to quantify mixing along transport pathways, with transit time, and voxel analysis. To measure upper-to-lower mantle exchange, we initialize particles uniformly in the upper mantle. By combining these approaches, we systematically identify regions of low flux and high residence time, candidates for reservoirs. We further take a statistical approach based on voxel density sampling to quantify mixing across the volume of the mantle.

How to cite: Johnston, G., Anderson, M., Forte, A., and Glišović, P.: How Well Is the Mantle Sampled? A Global Voxel-Based Analysis of Residence Time and Flux from Forward- and Reverse-Time Mantle Convection, EGU General Assembly 2026, Vienna, Austria, 3–8 May 2026, EGU26-15990, https://doi.org/10.5194/egusphere-egu26-15990, 2026.

EGU26-16148 | Posters virtual | VPS25

Geodetic degree-based Models for Robust Regional Geoid Refinement 

Ahmed Abdalla and Curtis Dwira

Accurate geoid models are essential for converting GNSS-derived heights into physically meaningful elevations and for ensuring consistency in modern height reference systems. This study presents a unified geodetic framework for refining gravimetric geoids using GNSS/leveling residuals through physically interpretable fitting models. Five correction representations are evaluated, ranging from local Cartesian planar surfaces to geodetically consistent spherical formulations of increasing degree. The analysis demonstrates that low-order models effectively remove regional bias and tilt but show limited predictive stability. To enhance robustness, iteratively reweighted least squares is applied to mitigate the influence of outliers while preserving deterministic structure. Higher-order geodetic models are stabilized using ridge regularization, with the regularization strength selected objectively through leave-one-out cross-validation. This strategy ensures numerical conditioning while directly optimizing predictive performance. Results show that the full degree-2 geodetic model offers the best balance among accuracy, stability, and physical interpretability. It reduces long-wavelength distortions while maintaining consistent in-sample and cross-validated performance. The proposed approach supports reliable GNSS-based height determination in modern vertical datum realization and height modernization efforts.

How to cite: Abdalla, A. and Dwira, C.: Geodetic degree-based Models for Robust Regional Geoid Refinement, EGU General Assembly 2026, Vienna, Austria, 3–8 May 2026, EGU26-16148, https://doi.org/10.5194/egusphere-egu26-16148, 2026.

EGU26-22040 | Posters virtual | VPS25

Magmatic sulfate‑melt exsolution as a mechanism for excess sulfur in porphyry systems 

Wenting Huang, Madeleine Humphreys, and Huaying Liang

Sulfur released by magmatic activity strongly impacts the climate and is essential for ore mineralisation. Many porphyry systems contain up to billions of tons of sulfur, far exceeding the sulfur capacity of silicate melt and therefore requiring an additional, efficient S‑transfer mechanism.

We present a unique mafic rock (SiO₂ = 53–59 wt.%, MgO = 5.3–7.3 wt.%) containing ~15–20 vol.% anhydrite, ~30–40 vol.% biotite and ~40–50 vol.% plagioclase from the largest porphyry–epithermal system in China. Magmatic anhydrite, indicated by textural relations and LREE‑rich compositions, yields bulk‑rock S contents of ~2–3 wt.%, far above experimental S solubilities.

Plagioclase shows sharp core–rim decreases from An₅₀–₇₀ to An₂₅–₄₅, recording strong CaO depletion caused by sulfate saturation. Extensive sulfate saturation also suppressed amphibole/orthopyroxene and removed a large proportion of LREEs from the melt, producing flat REE patterns in co-crystallised apatite. Biotite exhibits pronounced Ba depletion from core to rim. Because Ba partitions strongly into sulfate melt, not into anhydrite, this Ba zoning is best explained by the formation of a sulfate melt, rather than by crystallisation of anhydrite from a silicate melt.

Nd isotopic compositions (ԑNd(t) ≈ -1.0) indicate that the magma was derived from partial melting of the mantle wedge. We suggest that ascent of this oxidised, sulfur‑rich mafic magma led to decompression-driven oxidation of S²⁻ to S⁶⁺, sulfate saturation, and exsolution of an immiscible sulfate melt. This discrete sulfate‑melt migrated upward and provided an efficient pathway for long‑distance transfer of large amounts of sulfur to porphyry systems. This sulfate‑melt exsolution process is a previously unrecognised mechanism that relaxes the constraint imposed by the sulfur capacity of silicate melt, and LREE‑depleted apatite associated with abundant magmatic sulfate phases may serve as an indicator of sulfate‑melt exsolution and a proxy for porphyry mineralisation potential in the upper crust.

How to cite: Huang, W., Humphreys, M., and Liang, H.: Magmatic sulfate‑melt exsolution as a mechanism for excess sulfur in porphyry systems, EGU General Assembly 2026, Vienna, Austria, 3–8 May 2026, EGU26-22040, https://doi.org/10.5194/egusphere-egu26-22040, 2026.

Calcareous valves of various ostracod species from the Miocene (Burdigalian) Quilon Formation, Kerala Basin, southwest India, were separated and identified up to the species level. The 15 most abundant species were selected to determine the carbon and oxygen isotope composition, with 2 to 5 replicates to assess the variation among individual valves within each species. The δ¹³C ratios range from 0.56 to -4.65‰ VPDB with a standard deviation range between 0.08 to 0.53‰. The δ¹⁸O ratios varied between -2.57 to -4.25‰ VPDB with a standard deviation between 0.12‰ and 0.46‰. The seawater δ¹⁸O values were calculated using the empirical equation by Kim and Neil (1997), and they range between -3.08‰ to -0.01‰ (VSMOW), with an average of -1.85‰ (VSMOW). This study also tries to categorise the species into distinct habitat groups, namely the open ocean, mixed estuarine and shallow-marine environment with significant coastal upwelling influence, based on their isotopic composition. The results were compared with the habitats of their extant relatives at the family and genus levels, as well as information derived from valve ornamentations. Ostracods, namely Phlyctenophora meridionalis, Paranesidea cf. gajensis, Bairdoppilata sp., and Krithe autochthona inhabited a range of settings from shallow to deeper marine environments. The species Aurila singhi, Paractinocythereis gujaratensis, Stigmatocythere sp., Actinocythereis sp., Trachyleberis sp., Neocyprideis murudensis, Pokornyella chaasraensis, and Tenedocythere keralaensis are identified to inhabit an estuarine or shallow-marine environment influenced by freshwater influx. Whereas Paijenborchellina prona, Cytherelloidea sp., and Loxoconcha confinis show an indication of a shallow-marine environment with significant coastal upwelling influence.

How to cite: m s, A., kannan, P., and V Kapur, V.: Ecological and hydrological reconstruction of the western Indian coastal ocean during the Early Miocene (Burdigalian) based on the oxygen and carbon isotopes of multiple ostracod species., EGU General Assembly 2026, Vienna, Austria, 3–8 May 2026, EGU26-455, https://doi.org/10.5194/egusphere-egu26-455, 2026.

The hydrological response of a basin is fundamentally controlled by geomorphic processes, structures, and physiographic characteristics. Horton’s geomorphological laws, basin topology, and kinematic properties have long been employed to derive flood response in ungauged basins through various Geomorphological Instantaneous Unit Hydrograph (GIUH) frameworks. This study investigates ten ungauged tributary sub-basins of the Shilabati River in eastern India to analyse how basin morphometry and topology regulate travel-time distribution of water particles and flash-flood potential. The Width Function Instantaneous Unit Hydrograph (WFIUH), a GIUH variant, is applied to derive the geomorphological control on peak flow and time to peak, while the morphometric analysis is performed to investigate the effect of basin characteristics on these hydrologic response parameters. The WFIUH is obtained using the flow length extracted from the SRTM DEM, together with spatially variable and fixed hillslope velocities estimated from land use-land cover and slope using the Soil Conservation Services (SCS), uniform-flow, and Manning’s velocity formulae. Due to the absence of observed streamflow, WFIUH results are evaluated against the Geomorpho-climatic Instantaneous Unit Hydrograph (GcIUH) derived from climate-dependent channel velocity and drainage network topology, as well as observed flood events. 
Results show that all variable-velocity WFIUHs have longer time bases and a lower peak flow than fixed-velocity WFIUHs, because the highest velocity cells are associated with the smallest drainage contributing areas. The SCS-based variable velocity WFIUH aligns with the GcIUH, reproducing both the peak flow and time to peak of the IUH more accurately compared to the other methods. Small, circular, and comparatively steeper sub-basins exhibit shorter times to peak (8.5-10.5 hours), indicating a high flash-flood potential, mainly in sub-basins 3-6. On the contrary, elongated and well-bifurcated sub-basins reveal slightly delayed peaks (10.5-15.5 h) but remain capable of producing moderate-to-high floods due to their larger drainage areas, as confirmed by the flash flood event in 2025 in sub-basins 1, 8-10. Correlation analysis reveals that circularity ratio, relief ratio, and hypsometric integral are positively associated with peak flow, suggesting enhanced flow synchronization in compact and steep sub-basins. In contrast, time to peak shows moderate to strong negative correlations with these parameters and positive correlations with stream length and bifurcation ratios, indicating delayed response in elongated and highly branched drainage networks due to dispersed flow paths.
Therefore, basin morphometry and drainage network topology effectively govern hydrologic responses of the sub-basins. The spatially variable SCS velocity-based WFIUH provides a more realistic depiction of hydrologic response in ungauged sub-basins. Hence, this method is well-suited for event-based lumped hydrological modelling as well as for sub-basin prioritization in flash flood risk assessment.

How to cite: Das, T. and Das, S.: Geomorphic controls on flood response using the Width Function Instantaneous Unit Hydrograph framework , EGU General Assembly 2026, Vienna, Austria, 3–8 May 2026, EGU26-570, https://doi.org/10.5194/egusphere-egu26-570, 2026.

Methane stored in shallow marine sediments significantly affects seafloor stability, and influence ocean-atmosphere interactions. Since methane is a potent greenhouse gas, its release influences regional biogeochemical cycles and benthic ecosystems. Along continental margins, favourable conditions promote biogenic methanogenesis and gas hydrate formation. Understanding how methane migrates beneath the base of hydrate stability is therefore essential, particularly because hydrate dissociation near the feather edge of continental slope releases methane to the seabed. Pockmarks form when gas escapes from shallow overpressure zones. Overpressure may develop through hydrate dissociation or through the accumulation of free gas below low-permeability layers. Once pressure exceeds the sealing capacity of the overlying sediments, gas can migrate upward and eventually vent at the seabed.

In the offshore Taranaki Basin, west of New Zealand’s North Island, high-resolution 3D seismic data reveal ~300 pockmarks between 300-700 m water depth. Beneath many of these pockmarks, the seismic data show tiers of near-vertically stacked shallow-gas bright spots, indicating focused migration pathways in the shallow subsurface across the foresets of a prograding clinoform system.

The theoretical stability limit for pure methane hydrates locally aligns with the shallowest bright anomalies. However, most anomalies lie within the free-gas zone landward of the methane-hydrate outcrop and beneath large parts of the pockmark field. Over the past ~16 kyr, bottom-water temperatures along the slope have warmed by ~2.25 °C, shifting the hydrate-stability feather edge downslope by ~1.7 km. This warming-driven retreat  can account for only ~20% of the observed pockmarks. While the presence of gas hydrates can deflect gas updip, there is no clear seismic evidence for a bottom-simulating reflection. Instead, gas appears to ascend upslope through a range of stratigraphic heterogeneities, such as cyclic steps that climb obliquely, scour rims, channel cuts, and levee deposits, which collectively provide localized pathways for migration.

In gently dipping (2-3°) slope, free gas beneath the hydrate stability zone would preferentially migrate updip along permeable strata toward the shelf edge. However, 3D seismic data show bright spots concentrated within scour rims, channel levees, and the crests of cyclic steps that act as effective traps updip of the upper limit of hydrate stability at the clinoform foresets. Gas is accumulated within levee deposits of vertically aggrading and laterally shifting channel-levee systems, where repeated cut-and-fill cycles build stacked fining-upward units. The climbing geometry of cyclic steps redirects gas vertically upslope along their crests, enhancing upward migration, while fine-grained scour infill inhibit lateral migration.3D visualization shows that such traps form multiple tiers of shallow-gas pockets linked by focused gas-flow. Together, these relationships demonstrate that fluid migration is strongly controlled by sedimentary architecture shaped by turbidity current-controlled depositional processes at the foresets of the prograding clinoforms. The clustering of numerous pockmarks above these vertically stacked gas zones strongly indicates that stratigraphic focusing, rather than along-slope migration at the base of the hydrate stability zone, controls gas ascent.

How to cite: Bhattacharya, I. and Sarkar, S.: Stratigraphic Controls on Gas Migration and Pockmark Formation at the foreset of a Prograding Clinoform System west of North Island, New Zealand, EGU General Assembly 2026, Vienna, Austria, 3–8 May 2026, EGU26-724, https://doi.org/10.5194/egusphere-egu26-724, 2026.

EGU26-2250 | ECS | Posters virtual | VPS26

Feasibility of Action Camera-Based Videogrammetry for Multi-Temporal 3D Monitoring of Rubble-Mound Breakwaters 

Valentina Martínez Olmedo, Ana Margarida Bento, Marcos Arza-García, and José Alberto Gonçalves

Coastal protection infrastructures such as rubble-mound breakwaters (RMBs) demand frequent geometric inspection to quantify armor-layer dynamics and support reproducible structural monitoring. While UAV-based photogrammetry and LiDAR are established reference techniques for rapid 3D mapping, high revisit rates remain operationally constrained by wind sensitivity, sensor payload limits, and regulatory flight restrictions. Videogrammetry complements these approaches by increasing inter-frame overlap and mitigating missed-trigger acquisitions, especially useful in complex coastal scenes (e.g., those affected by occlusions between armor units and block interstices). As in conventional photogrammetry, videogrammetry relies on image redundancy and self-calibration rather than highly sophisticated instrumentation. Despite this potential, consumer-grade action cameras remain scarcely validated for multi-epoch 3D monitoring in coastal engineering, mainly due to wide-angle lens distortion and coarse onboard GNSS geotag precision.

This study assesses pole-mounted GoPro videogrammetry for multi-temporal 3D relative change detection in the emerged portions of a detached rubble-mound breakwater at Cabedelo do Douro (PT). Two survey epochs were acquired in July 2024 and November 2024 to characterize the above-water zone, inspecting the seaward slope, the landward armor-toe transition, and the horizontal crest platform segment at one of the heads of the RMB. Frames were extracted at 1 Hz and processed in Metashape using an SfM-MVS (Structure-from-Motion Multi-View Stereo) self-calibrating camera model. Multi-epoch point clouds were coregistered in CloudCompare with ICP (Iterative Closest Point) refinement over stable crest and toe areas, and 3D changes were quantified using M3C2 (Multiscale Model-to-Model Cloud Comparison), generating signed distance maps and detection histograms. A concurrent UAV-RTK survey, supported by additional GNSS-measured ground control points (GCPs), served as a geometric benchmark.

Mean ActionCam-to-UAV sensor offsets were +0.06 m, confirming that, despite potentially unstable absolute georeferencing in GoPro-derived reconstructions, the resulting point clouds preserve sufficient geometric and scale consistency to support relative multi-temporal 3D change detection and the identification of concrete armor-unit displacements. Results confirm that pole-mounted videogrammetry supports rapid, repeatable, low-cost SHM (Structural Health Monitoring) observations, providing defensible detection thresholds and reproducible change-detection limits for engineering interpretation and maintenance support.

How to cite: Martínez Olmedo, V., Bento, A. M., Arza-García, M., and Gonçalves, J. A.: Feasibility of Action Camera-Based Videogrammetry for Multi-Temporal 3D Monitoring of Rubble-Mound Breakwaters, EGU General Assembly 2026, Vienna, Austria, 3–8 May 2026, EGU26-2250, https://doi.org/10.5194/egusphere-egu26-2250, 2026.

EGU26-5549 | ECS | Posters virtual | VPS26

Can vegetation root simulation in the laboratory lead to better understanding of flow-vegetation interactions? 

Jyotirmoy Barman and Marwan Hassan

Study of flow-vegetation interactions in river channels is necessary to comprehend its importance in sediment transport and morphological changes. Numerous laboratory experiments, numerical modelling, and field data have been collected and analyzed by researchers throughout decades. Previous laboratory experiments simulating vegetation majorly studied the impacts from vegetation shoot width and density. However, studies showed that along with the shape and size of vegetation, root-soil binding capacity also plays an important role in the morphological changes in the channel. To test this theory, we conducted experiments using a flume of 15 m in length and 1.8 m in width at the University of British Columbia. The main channel and floodplain width considered is 60 cm each. Two sets of experiments with and without vegetation roots in the floodplains were conducted. 3D printer was used to model the floodplain vegetation (see Figure). In the case of vegetation with roots, we considered it as a taproot system with a spiral structure attached to the simple root-shoot system as seen in the figure. Preliminary tests showed vegetation with roots was able to sustain the force of flow in different discharges in a better way without getting uprooted compared to vegetation without roots. Furthermore, there is also a difference in the morphology of the channels between the with and without roots experiments. The initial study showed that incorporating vegetation roots in the laboratory provides a more effective means of understanding flow-vegetation interactions and channel evolution. Furthermore, this study will also be helpful for the advancement of nature-based solutions like soil bioengineering techniques.

                           Simple root-shoot system                                                                               Taproot-shoot system


How to cite: Barman, J. and Hassan, M.: Can vegetation root simulation in the laboratory lead to better understanding of flow-vegetation interactions?, EGU General Assembly 2026, Vienna, Austria, 3–8 May 2026, EGU26-5549, https://doi.org/10.5194/egusphere-egu26-5549, 2026.

EGU26-5775 | ECS | Posters virtual | VPS26

Fully Automated Unsupervised Machine Learning Framework for Mapping Erosion Hotspots in Quick Clay Areas Using Remote Sensing–Derived Data 

Orkun Türe, Rui Tao, Jean-Sébastien L’Heureux, Emir Ahmet Oguz, and Ankit Tyagi

Quick clays are fine-grained, highly sensitive marine deposits that are widespread across formerly glaciated regions, including Norway, Sweden, Finland, and Canada. The low remoulded strength of the quick clays makes them particularly susceptible to extensive retrogressive landslides, which pose serious challenges to society. Erosion is recognized as one of the most important pre-conditioning and triggering factor for quick clay landslide. Therefore, identification of the erosion hotspots is essential for understanding landslide initiation processes and for effective hazard mitigation in quick clay terrains. Machine learning has emerged as an effective tool for erosion hotspot mapping, allowing complex spatial patterns and nonlinear interactions among erosion-controlling factors to be identified from remote sensing–derived data. Recent studies have demonstrated that Deep Neural Networks can be effectively employed to identify erosion-prone zones in quick clay environments when sufficient labelled data are available. This study investigates whether unsupervised machine learning applied to remote sensing–derived data can effectively identify erosion hotspots in quick clay areas. A fully automated, Python-based workflow was developed for erosion hotspot mapping in quick clay areas using remote sensing–derived data. The dataset includes terrain, hydrological, environmental, and anthropogenic parameters relevant to erosion and slope instability. Initially, a total of twenty input parameters were considered. Pearson correlation coefficients were computed to assess inter-feature dependencies, and principal component analysis (PCA) was employed to evaluate feature importance. The unsupervised analysis was performed using multiple clustering techniques to capture different structural characteristics of the data where each cluster represents a distinct level of erosion susceptibility. The results suggest that the proposed unsupervised framework can effectively delineate erosion hotspots in quick clay areas and constitutes an initial step toward the development of early warning systems.
Acknowledgements
This work was supported by the Research Council of Norway through the SAFERCLAY project (Grant No. 352887). Orkun Türe was supported by the Council of Higher Education of Türkiye under the DOSAP scholarship programme and served as a visiting researcher at NGI and NTNU.

How to cite: Türe, O., Tao, R., L’Heureux, J.-S., Oguz, E. A., and Tyagi, A.: Fully Automated Unsupervised Machine Learning Framework for Mapping Erosion Hotspots in Quick Clay Areas Using Remote Sensing–Derived Data, EGU General Assembly 2026, Vienna, Austria, 3–8 May 2026, EGU26-5775, https://doi.org/10.5194/egusphere-egu26-5775, 2026.

EGU26-5929 | ECS | Posters virtual | VPS26

Controls on the size and mobility of deep-seated landslides in the North Tanganyika - Kivu Rift region, Africa 

Toussaint Mugaruka Bibentyo, Antoine Dille, Axel Deijns, Charles Nzolang, Stijn Dewaele, and Olivier Dewitte

The size and mobility of landslides control their impact on both landscapes and communities. Despite their importance to understanding landslide mechanisms and associated hazards, few studies have examined the factors controlling these two characteristics, particularly at a large scale. This is especially the case for deep-seated landslides that occur across diverse geomorphological and lithological settings. Further, most research focuses on recent landslides and thus fail to consider historical processes that could be associated with environmental conditions that differ from the contemporary ones. Here, we investigate the influence of geomorphology and lithology on the size and mobility of old and recent deep-seated landslides in the North Tanganyika-Kivu Rift region in Africa, an under-researched mountainous environment located in the tropics. Based on a comprehensive inventory of ~2500 landslides, we show that mobility increases with size, especially for the old landslides. These old landslides are significantly larger than the recent ones, likely due to potential progressive landslide growth over time and  influenced by the region’s paleoseismic activity. The main controls on both the size and mobility of deep-seated landslides are lithology and, to a lesser extent, fluctuations in Lake Kivu’s level during the Holocene. Landscape rejuvenation by migrating knickpoints associated with rifting also plays a key role in determining landslide size: in rejuvenated landscapes, landslides tend to be larger than those in relict landscapes. The presence of these large landslides favours the development of smaller ones along their margins, reflecting the influence of path dependency on landslide occurrence and size. Our findings underscore the importance of considering the chronology of landslide occurrence and the long-term legacy of landscape evolution in shaping landslide characteristics.

How to cite: Mugaruka Bibentyo, T., Dille, A., Deijns, A., Nzolang, C., Dewaele, S., and Dewitte, O.: Controls on the size and mobility of deep-seated landslides in the North Tanganyika - Kivu Rift region, Africa, EGU General Assembly 2026, Vienna, Austria, 3–8 May 2026, EGU26-5929, https://doi.org/10.5194/egusphere-egu26-5929, 2026.

EGU26-6006 | ECS | Posters virtual | VPS26

High-energy sediment dynamics in ephemeral Andean mountain streams: The case of Río Seco, Peru 

Lenin Rosales Torres and María Cárdenas-Gaudry

Ephemeral mountain streams on the western Andean slopes remain dry most of the year, yet during intense rainfall events they generate short-lived flash floods with exceptionally high sediment transport capacity. This study investigates the hydraulic response of the upper Río Seco micro-basin (Huaycoloro catchment, Peru) under extreme rainfall scenarios, using a hydraulic–geomorphological framework that links surface hydrology with sediment mobility thresholds. Design discharges were estimated through IDF-based rainfall analysis and classical hydrological methods, while sectional hydraulic modelling using the Manning equation provided flow velocities and bed shear stresses along representative channel reaches. Results indicate mean velocities ranging from 2.4 to 3.4 m/s and shear stresses up to 215 Pa. These values exceed the critical shear stress of the coarse gravel bed by more than five times, indicating generalized sediment mobility and strong incision potential in confined steep reaches. Such conditions promote significant sediment supply from the upper basin, increasing the likelihood of downstream channel aggradation and flood hazard in peri-urban sectors of eastern Lima. To our knowledge, this is the first hydraulic–geomorphological quantification of sediment mobility thresholds in an arid Andean micro-basin under design-storm conditions. The findings provide quantitative evidence supporting the need to transition from purely water-based flood models toward sediment-inclusive risk assessments in steep ephemeral mountain catchments.

How to cite: Rosales Torres, L. and Cárdenas-Gaudry, M.: High-energy sediment dynamics in ephemeral Andean mountain streams: The case of Río Seco, Peru, EGU General Assembly 2026, Vienna, Austria, 3–8 May 2026, EGU26-6006, https://doi.org/10.5194/egusphere-egu26-6006, 2026.

Flood-prone small mountainous catchments hosting critical infrastructure, such as bridges and transport networks, require integrated hydrologic–hydraulic analyses to ensure long-term resilience under changing climatic and land-use conditions. This study develops a coupled HEC-HMS–HEC-RAS modelling framework to quantify design discharges, inundation patterns and local hydraulic controls for the torrential stream crossing the settlement of Kato Nevrokopi in Northern Greece. Using high-resolution topographic data (DEM), GIS-based basin delineation and long-term rainfall records, design storms for multiple return periods are derived and transformed into flood hydrographs at the catchment outlet. These hydrographs force 1D steady-flow simulations in HEC-RAS, explicitly representing bridges, piers and local constrictions that act as morphodynamic bottlenecks and potential failure points under extreme flows. Model results are used to generate flood extent and water-depth maps for events up to the 1,000-year return period, identify critical cross-sections where afflux and backwater effects are most pronounced, and assess the effectiveness of alternative layout and channel-training configurations. The analysis is framed within the current EU Floods Directive 2007/60/EC and Greek legislation for stream delineation, linking quantitative hazard metrics to planning constraints and infrastructure design requirements. The work highlights how relatively simple, openly available tools, when combined with detailed geometric representation of bridges and channel morphology, can support evidence-based decisions on flood protection works, minimise over-engineering, and improve the adaptive management of critical infrastructure in steep, data-scarce basins.

How to cite: Pavlidis, K. and Valyrakis, M.: Hydrologic-hydraulic modelling and flood hazard mapping for infrastructure resilience in a small mountainous catchment on Northern Greece, EGU General Assembly 2026, Vienna, Austria, 3–8 May 2026, EGU26-7986, https://doi.org/10.5194/egusphere-egu26-7986, 2026.


The present study examines the catchment and source morphodynamics of the Palar River, southern Peninsular India. A multidisciplinary approach—remote sensing techniques, lineament analysis, geochemistry, and ground-penetration radar (GPR)—was applied to better understand its evolution during the Holocene. The major lineaments in the Palar River basin predominantly show a NE–SW trend. Five major faults have been identified in the basin, including a transition zone where frequent low-magnitude earthquakes have occurred. The major fault F1, a strike-slip fault, occurs in the upper reaches of the Palar River and follows a NE–SW trend. Other major faults, F2 and F3, are also associated with a transition zone where frequent minor and major tremors have been documented. Fault F4 runs parallel to the Cheyyar River, and significant changes in the river course have resulted from movement along these strike-slip faults. Fault F5, located nearer to the east coast, indicates a passive tectonic activity regime. The after-effects of tectonic activity in the basin are further evident from the GPR profiles.

Sediments of the active Palar River are dominantly litharenite, arkose, and wacke, whereas the paleochannel sediments are predominantly shale. Weathering proxies such as the Chemical Index of Alteration (CIA), Plagioclase Index of Alteration (PIA), elemental ratios, and the A–CN–K plot indicate intense post-depositional weathering of the paleochannel sediments due to climatic variability. In contrast, due to ongoing tectonic activity in the source region along with subsequent aggradation and degradation in the fluvial regime, sediments of the active Palar River exhibit low to moderate weathering.

Geochemical data further reveal that sediments from the active Palar River and the paleochannels are predominantly derived from active continental margin and passive continental margin settings, respectively. Major oxides, trace elements, and rare earth element (REE) data indicate that the Palar River sediments are derived from felsic sources, whereas the paleochannel sediments originate from mafic sources. Overall, the study suggests that the catchment area of the Palar River shifted southward during the Holocene due to tectonic uplift. Subsequently, the paleochannel sediments underwent post-depositional weathering. Ongoing tectonic activity combined with monsoonal variability has enhanced rapid erosion in the catchment, resulting in the deposition of thick sediment sequences from the middle to lower reaches of the active Palar River.

How to cite: m r, R.: Holocene Evolution of the Palar River, Southern India: Evidence for Channel Migration, Provenance Shifts, Weathering Processes, and Tectonic Controls, EGU General Assembly 2026, Vienna, Austria, 3–8 May 2026, EGU26-8742, https://doi.org/10.5194/egusphere-egu26-8742, 2026.

EGU26-8868 | ECS | Posters virtual | VPS26

Natural Riverbed Stability in a Small-to-Medium-Sized Mountainous River: A Baseline Investigation of the Qin River Prior to the Pinglu Canal Construction 

Supeng Zhu, Jian Sun, Changgen Liu, Lihua Chen, and Wenzhou Chen

The construction of mega-canals necessitates a profound understanding of the pre-existing fluvial equilibrium to mitigate adverse geomorphic consequences, particularly in rivers with limited channel capacity. This study focuses on the intrinsic stability mechanisms of the Qin River, a typical small-to-medium-sized mountainous river in South China, prior to the implementation of the Pinglu Canal project. Field surveys and sediment analyses were conducted to characterise the natural bed state, with a focus on a morphologically representative reach. The findings indicate that the riverbed has historically maintained a strong dynamic equilibrium, supported by lateral confinement from riparian vegetation and natural armor processes unique to mountainous fluvial regimes, which are derived from tributary inputs. The analysis reveals that specific hydrodynamic thresholds and sediment connectivity are essential for maintaining this stability. Therefore, rather than hydraulic stress alone, the system's main vulnerability is determined to be the possible disruption of these established equilibrium conditions, particularly with regard to geological substrate constraints and longitudinal continuity. These results establish a scientific standard for assessing the potential disturbance risks of canalization in delicate mountainous river systems by providing a critical morphodynamic baseline.

How to cite: Zhu, S., Sun, J., Liu, C., Chen, L., and Chen, W.: Natural Riverbed Stability in a Small-to-Medium-Sized Mountainous River: A Baseline Investigation of the Qin River Prior to the Pinglu Canal Construction, EGU General Assembly 2026, Vienna, Austria, 3–8 May 2026, EGU26-8868, https://doi.org/10.5194/egusphere-egu26-8868, 2026.

EGU26-10337 | Posters virtual | VPS26

ArtPOP - Automated RecogniTion of Palynomorphs and Organic sedimentary Particles  

Kasia K. Śliwińska and Nikolai Andrianov

The traditional workflow in palynology begins with the removal of rock minerals through acid digestion and heavy liquid separation, followed by mounting the organic residue on a glass slide, and analysing it under a transmitted light microscope. Using the microscope, palynologists manually identify and assign the observed particles to predefined categories within a designated counting area on each slide. Counting typically continues until a target number of particles has been reached (often between 200 to 300).

Beyond the commonly analysed palynomorphs such as pollen, spores, and dinoflagellate cysts, palynological slides may also contain a diverse range of acid resistant organic sedimentary particles, including freshwater algae, phytoclasts, amorphous organic matter, and many others. Examining the full spectrum of these particles is known as palynofacies analysis. It is one of the most powerful methods for reconstructing depositional environments in sedimentary rocks, as it relies on the distribution and relative abundances of these particles.

However, traditional counting methods for palynological and palynofacies analysis present several limitations. The counting area is rarely defined with precision, making it difficult to reproduce analyses. As a result, if any annotations need to be corrected, the entire counting workflow must be repeated. A particularly challenging aspect is the objective estimation of particles such as amorphous organic matter or phytoclasts, which are always fragmented and do not exist as discrete entities. Moreover, identification accuracy can vary substantially between analysts depending on experience, introducing challenges for reproducibility, comparability, and integration across datasets.

Digitizing palynological slides offers a promising opportunity to reduce subjectivity and personal bias by enabling particle annotation directly on high resolution digital images. This approach also supports iterative analysis, allowing annotations to be updated or refined without repeating the microscopy workflow. Through the ArtPOP project, we aim to develop objective, widely applicable annotation tool that enhance the robustness of paleoenvironmental reconstructions and facilitate integration across diverse palynological datasets. In this presentation, we provide an overview of challenges and advantages associated with digitizing the palynological workflow. We also present our preliminary results of the AI-augmented annotation of selected sedimentary particles.

How to cite: Śliwińska, K. K. and Andrianov, N.: ArtPOP - Automated RecogniTion of Palynomorphs and Organic sedimentary Particles , EGU General Assembly 2026, Vienna, Austria, 3–8 May 2026, EGU26-10337, https://doi.org/10.5194/egusphere-egu26-10337, 2026.

EGU26-10713 | ECS | Posters virtual | VPS26

Delayed carbon-cycle stabilization and ecological recovery across the K/Pg boundary: evidence from the Um Sohryngkew River section, Meghalaya (India) 

Subham Patra, Jahnavi Punekar, Priyeshu Srivastava, Suman Rawat, Arun Bhadran, and Drishya Girishbai

The Cretaceous–Paleogene (K/Pg) mass extinction represents one of the most severe crises in Earth history, with marked regional variations in the tempo of pre- and post-extinction environmental stress and ecological recovery. The Um Sohryngkew River (USR) section of Meghalaya (NE India) provides a unique perspective on stress and recovery dynamics in a marine setting proximal to the Deccan Traps. This study integrates planktonic foraminiferal assemblage data with sedimentological observations and bulk-carbonate δ13C measurements to reconstruct the nature and duration of marine stress and to constrain the timing of ecological and carbon-cycle recovery in the eastern Tethyan realm. This integrated, high-resolution multi-proxy approach was previously lacking for this Deccan-proximal archive, and provides a critical constraint on how volcanogenic forcing modulated K/Pg stress and recovery at regional to global scales.

The late Maastrichtian record at USR indicates highly stressed surface-ocean conditions. Planktonic assemblages are dominated by small opportunistic taxa, particularly Guembelitria cretacea (>80%), with strong dwarfing, dominance of thin-walled morphotypes, poor preservation, and a near absence of heavily calcified taxa (e.g., Pseudotextularia spp., Globotruncana spp.). These assemblage and preservation features point to sustained calcification stress and unfavourable conditions for carbonate production in surface waters, consistent with enhanced nutrient input and surface-water acidification under intensified continental weathering/runoff and volcanogenic CO2 emissions. Following the K/Pg boundary, planktonic foraminiferal abundance (4 tests/g) and diversity remained markedly suppressed through the early Danian. The post-boundary interval is similarly characterised by persistent dominance of small opportunistic taxa (>30%; e.g., Guembelitria spp. and Chiloguembelina spp.) and continued dwarfing, indicating sustained calcification stress and hindered ecosystem rebuilding. Bulk-carbonate δ13C indicates delayed carbon-cycle recovery, beginning only after ~750 kyr at USR compared to ~200–300 kyr at many distal sites. Ecological recovery lagged further, with low diversity and small test sizes persisting for ~2 Myr until biozone P1c, indicating decoupling between carbon-cycle recovery and biological reorganization under continued environmental forcing.

The first robust evidence for ecological improvement appears in planktonic foraminiferal biozone P1c, where assemblages become more diverse and better preserved, test sizes increase, and morphogroup proportions stabilise. These changes suggest improved conditions for calcification, progressive strengthening of the pelagic carbonate system, and a more efficient biological pump. By biozones P1c–P2, community structure indicates that ecological balance was largely restored, and carbonate production increased steadily towards a better-developed carbonate-factory environment. Comparison with global K/Pg records suggests that recovery mechanisms in the USR section broadly mirror global ecological and biogeochemical feedbacks, but their timing is substantially delayed relative to distal sections. Importantly, similar evidence for prolonged stress and delayed recovery has also been documented from the Krishna–Godavari Basin of southern India, supporting a coherent regional pattern in marine environments proximal to the Deccan Traps. Together, these Deccan-proximal records highlight strong spatial heterogeneity in post-K/Pg recovery trajectories, including a delayed return to stable carbon cycling, carbonate production, and ecosystem structure.

How to cite: Patra, S., Punekar, J., Srivastava, P., Rawat, S., Bhadran, A., and Girishbai, D.: Delayed carbon-cycle stabilization and ecological recovery across the K/Pg boundary: evidence from the Um Sohryngkew River section, Meghalaya (India), EGU General Assembly 2026, Vienna, Austria, 3–8 May 2026, EGU26-10713, https://doi.org/10.5194/egusphere-egu26-10713, 2026.

EGU26-11152 | ECS | Posters virtual | VPS26

Efficient Hydrodynamic Modeling at the Landscape Scale: Quantifying River Width and Shear Stress Variability to Decode Tectonic Signals 

Boris Gailleton, Philippe Steer, Guillaume Cordonnier, and Fiona Clubb

Basal shear stresses exerted by river flow control the capacity of river to erode and transport sediment. Material properties (e.g. lithology, grain size) modulate how basal shear stress translates into morphological change. Quantifying the spatial variability of basal shear stress is therefore essential to assess fluvial erosion processes and to infer the tectonic and climatic forcings recorded in landscape morphology. 

Direct and systematic measurement of the basal shear stress in rivers is not feasible at large scales, making numerical hydrodynamic modelling the primary tool for its estimation. However, applications beyond the reach scale remain computationally prohibitive due to (i) the need for high-resolution topography to resolve channels, banks, and bars, and (ii) the numerical cost of solving the Shallow Water Equations (SWEs), which require small time steps to propagate changes induced and complex solvers. 

Here, we present a novel numerical framework that substantially reduces the computational cost of hydrodynamic modelling for morphometric analysis, enabling simulations over large, high-resolution DEMs and ranges of hydrological conditions. The approach reformulates the SWEs into a simplified stationary scheme, linearizing algorithmic complexity, and allowing scalable computations. In addition, we employ GPU-accelerated, graph-based flow accumulation algorithms to compute discharge efficiently. Together, these developments reduce computation time by up to three orders of magnitude compared to conventional hydraulic modelling approaches. 

The method is implemented in the pyfastflow package within the TopoToolbox ecosystem. We apply it to more than 100 watersheds in the Mendocino Triple Junction (California, USA), a region characterized by strong spatial gradients in tectonic uplift. Hydrodynamics are computed for five hydrological states constrained by precipitation data, spanning low flow to flood conditions. We quantify spatial variations in river width and shear stress and show that these metrics capture complementary temporal signatures of uplift timing and magnitude. Basin-wide shear stress responds quickly to uplift onset but exhibits a significantly delayed response during relaxation, whereas channel width displays a more variable and spatially contrasted transient signal upstream of the onset. 

How to cite: Gailleton, B., Steer, P., Cordonnier, G., and Clubb, F.: Efficient Hydrodynamic Modeling at the Landscape Scale: Quantifying River Width and Shear Stress Variability to Decode Tectonic Signals, EGU General Assembly 2026, Vienna, Austria, 3–8 May 2026, EGU26-11152, https://doi.org/10.5194/egusphere-egu26-11152, 2026.

EGU26-11678 | ECS | Posters virtual | VPS26

Rare-event detection of incipient sediment motion from smart-particle time series using deep learning 

Ilias Mavris and Manousos Valyrakis


Incipient sediment motion in turbulent flows remains difficult to characterize and predict because the underlying hydrodynamic forces are highly intermittent and events are sparse in time, even in well-controlled experiments. This study investigates whether temporal deep-learning architectures can detect the onset of particle motion directly from high-frequency velocity time series measured by an instrumented “smart sphere” [1, 2], without explicit force or torque measurements. The workflow includes detrending and cleaning of raw signals, physics-informed signal transforms (e.g. smoothed velocity, acceleration, jerk, and kinematic impulse proxies), segmentation with sliding windows, and supervised training of temporal deep-learning architectures, including recurrent, convolutional, and attention-based models, using class-imbalance mitigation such as focal loss, class weighting, and data augmentation.
Hyperparameter optimization is performed automatically with Optuna, and model performance is assessed using ROC and precision–recall curves, confusion matrices and time-resolved prediction performance. Results show that all tested architectures can learn consistent kinematic signatures preceding incipient motion from single-axis velocity time series, with models incorporating attention mechanisms achieving the highest recall on rare motion-onset events, consistent with their ability to focus on intermittent, high-magnitude kinematic bursts preceding entrainment. These findings demonstrate that deep learning applied to smart-particle sensor data can provide an efficient, non-intrusive tool for particle-scale sediment transport monitoring and real-time–capable event detection. The approach is directly relevant to the session’s focus on particle-scale transport mechanics and data-driven upscaling, and opens avenues for integrating deep-learning-based event detection into multi-scale sediment transport models in geophysical and engineered flows.

References
[1] Al-Obaidi, K., Xu, Y., & Valyrakis, M. (2020). The design and calibration of instrumented particles for assessing water infrastructure hazards. Journal of Sensor and Actuator Networks, 9(3), 36.
[2] AlObaidi, K., & Valyrakis, M. (2021). Linking the explicit probability of entrainment of instrumented particles to flow hydrodynamics. Earth Surface Processes and Landforms, 46(12), 2448-2465.

How to cite: Mavris, I. and Valyrakis, M.: Rare-event detection of incipient sediment motion from smart-particle time series using deep learning, EGU General Assembly 2026, Vienna, Austria, 3–8 May 2026, EGU26-11678, https://doi.org/10.5194/egusphere-egu26-11678, 2026.

EGU26-12124 | Posters virtual | VPS26

Seasonal variability at the onset of the Late Palaeozoic Ice Age: insights from Gigantoproductus shells 

Gaia Crippa, Lucia Angiolini, Karem Azmy, Enrico Cannaò, Eamon Doyle, Giovanna Della Porta, John Murray, Michael O’Connell, Marco Viaretti, and David A.T. Harper

Understanding transformations of the climate system in the geological past is essential for predicting and mitigating the effects of global climate change in the next future. The geological record provides a unique archive that documents long-term fluctuations of environmental variables, including seasonality. Seasonality appears to have played a crucial role in extreme climate transitions, highlighting the importance of constraining its variability in the past. Increased seasonality is often associated with colder conditions and the development of ice accumulations, making it a key parameter for understanding and forecasting climate change.

Species of the brachiopod Gigantoproductus are giants within the Palaeozoic sedentary benthos, characterised by exceptional size and thick shells, reaching over 30 cm in width and more than 1 cm in shell thickness. These features make them unparalleled bioarchives for palaeoecological and palaeoclimatic reconstructions, enabling the investigation of long-term changes during key intervals of past climate change.

In this study, specimens of Gigantoproductus semiglobosus from upper Visean (Mississippian, Carboniferous) successions of western Ireland (Aran Islands and the Burren) were subjected to detailed diagenetic screening and subsequently analysed using a sclerochemical approach (δ18O, δ13C). These analyses were used to reconstruct seasonal variability and to provide additional evidence for the timing of Mississippian phases of the Late Palaeozoic Ice Age (LPIA).

Our results show that δ18O profiles from well-preserved shells record high seasonal variations (Δδ18O = 0.9 to 1.9 ‰ corresponding to a ΔT = 4 to 11 °C) for palaeoequatorial settings, as also observed in coeval species of Gigantoproductus from the UK (Angiolini et al., 2019). This seasonal variation is much higher than that recorded in comparable shallow water, low latitude environments both nowadays and in the distant past. The pronounced seasonality recorded by several species of Gigantoproductus from western Ireland and the UK at low palaeolatitudes supports the onset of a sustained Gondwanan glaciation in the late Visean. Also, the palaeogeographic distribution of the species of Gigantoproductus and the geochemical composition of their shells indicate that low-latitude Mississippian ocean waters did not experience a temperature decrease at the onset of the Gondwanan glaciation, but rather a marked increase in seasonal variability.

Overall, this study highlights the importance of resolving long-term changes in seasonality, using fossil carbonate shells as palaeoclimatic archives during different intervals of climate change, in both the recent and distant past, to better understand and predict long-term transformations of the climate system.


References

Angiolini et al. (2019). The giants of the phylum Brachiopoda: a matter of diet? Palaeontology, Vol. 62, Part 6, pp. 889–917

How to cite: Crippa, G., Angiolini, L., Azmy, K., Cannaò, E., Doyle, E., Della Porta, G., Murray, J., O’Connell, M., Viaretti, M., and Harper, D. A. T.: Seasonal variability at the onset of the Late Palaeozoic Ice Age: insights from Gigantoproductus shells, EGU General Assembly 2026, Vienna, Austria, 3–8 May 2026, EGU26-12124, https://doi.org/10.5194/egusphere-egu26-12124, 2026.

EGU26-12898 | ECS | Posters virtual | VPS26

Non-linear ecological responses of Ostracod communities to multi-metal pollution based on tolerance-weighted indices from the Vedaranyam shelf, Bay of Bengal, India. 

Prakasheswar Palanichamy, Sivapriya Vimal Kanth, Sabari Nathan Chellamuthu, Ramya Subramani, and Shaik Mohammad Hussain

Benthic ostracods serve as effective bioindicators of sediment quality and metal enrichment in coastal systems, but quantitative tools linking their community structure to multi-metal contamination are limited. This study develops and validates two ostracod-based biotic indices, the Ostracoda Assemblage Pollution Index (OAPI) and its reduced form, Mini-OAPI, to evaluate benthic ecological responses to metal contamination on the Vedaranyam shelf, Bay of Bengal. Twenty-eight surface sediment samples were analysed for Fe, Mn, Cr, Cu, Ni, Pb, and Zn concentrations along with ostracod assemblage data. The indices integrate species diversity, functional guild composition, and normalized pollution load to produce a tolerance-weighted ecological deviation measure. The OAPI includes diversity, evenness, guild shift, and pollution load, performs best in data-rich settings, while Mini-OAPI shows stable diagnostic behaviour under data-limited conditions and consistently captures ecological responses along contamination gradients. Normalization to a 0-1 scale and the use of standardized disturbance classes (Low = 0.00-0.33; Moderate = 0.34-0.66; High = 0.67-1.00) ensure comparability across marine and estuarine systems. A unimodal diversity-pollution pattern consistent with the Intermediate Disturbance Hypothesis and weak Cu-organic associations indicate complex metal-biota interactions. These indices provide transferable, tolerance-weighted tools for ecological assessment and understanding ecosystem responses to environmental change.

Keywords: Ostracoda Assemblage Pollution Index (OAPI); Mini-OAPI; benthic bioindicators; non-linear ecological modelling; Intermediate Disturbance Hypothesis (IDH); copper paradox; marine pollution assessment.


How to cite: Palanichamy, P., Vimal Kanth, S., Chellamuthu, S. N., Subramani, R., and Hussain, S. M.: Non-linear ecological responses of Ostracod communities to multi-metal pollution based on tolerance-weighted indices from the Vedaranyam shelf, Bay of Bengal, India., EGU General Assembly 2026, Vienna, Austria, 3–8 May 2026, EGU26-12898, https://doi.org/10.5194/egusphere-egu26-12898, 2026.

EGU26-15851 | ECS | Posters virtual | VPS26

Geomorphological controls on the persistence and extent of Landfast Sea Ice in James Bay Region 

Debangshu Banerjee, Kaushik Gupta, and Anirban Mukhopadhyay

Bathymetry plays a critical role in determining the occurrence and stability of landfast sea ice, although its seasonal impact on sub-Arctic ice-covered shelves has yet to be thoroughly quantified and understood. Our study explores the ways in which nearshore bathymetry and coastal topography influence the spatial distribution, seasonal persistence, and variability of landfast sea ice, with an emphasis on shallow embayments of James Bay. Our hypothesis suggests that factors like coastal orientation and bathymetry provide extent and stability to the landfast sea ice in the James Bay region, rather than being exclusively governed by marine and atmospheric factors. Using satellite-derived observations of landfast sea-ice delineations, regional bathymetric datasets, and information on coastal geomorphological configuration, this analysis will quantify statistical relationships among the landfast-ice edge extent and persistence metrics with the bathymetric thresholds and coastal orientations. Initial findings indicate that recurrent landfast ice extents are larger and their persistence is higher when there is a shallow water column, undulating bathymetry with mounds, and/or offshore features. Our observations support the hypothesis that bathymetry plays a crucial role in determining the presence and stability of landfast sea ice. By explicitly correlating bathymetry and geomorphology with landfast ice phenology and stability indicators, our research aims to advance both conceptual and quantitative understandings within coastal ice modelling frameworks and refine projections concerning the response of landfast sea ice to ongoing Arctic amplification and climate change.

How to cite: Banerjee, D., Gupta, K., and Mukhopadhyay, A.: Geomorphological controls on the persistence and extent of Landfast Sea Ice in James Bay Region, EGU General Assembly 2026, Vienna, Austria, 3–8 May 2026, EGU26-15851, https://doi.org/10.5194/egusphere-egu26-15851, 2026.

EGU26-17175 | ECS | Posters virtual | VPS26

Physical geomorphometry: From a concept to practical applications 

Anton Popov and Jozef Minár

Physical geomorphometry is young way that describe land surface morphology through gravitational energy and mass and energy movement. Unlike statistical and general geomorphometric approaches, physical geomorphometry bridging land surface characteristics and fundamental physical processes allows to interpret geomorphological primitives from genetic point of view. In this study we incorporated latest achievements of physical geomorphometry concept to demonstrate a transition from theoretical aspects to practical applications of the concept.

In the research we applied a set of physical geomorphometric (PG) indices that describes landform development from different points of view. Moreover, we used a modified algorithm of physically based elementary land-surface segmentation algorithm that integrates dynamic least-squares DEM generalization with object-based image analysis. The method is evaluated across contrasting environments, including glacial and karst landscapes, and is further extended to marine settings for seabed landform classification. Key contribution is the application of PG signature concept that unify the set of PG indices and therefore quantitatively describes landforms based on the balance and magnitude of geomorphic energies.

Our results demonstrate that the approach allows us to obtain genetically interpretable landforms both in terrestrial and submarine landscapes. Physical geomorphometric signature is highly effective in landform groups comparison and detection of each group’s potential affinity to development i.e. their disequilibrium. It also helped us to define transitional forms of landforms that are usually overlooked by general geomorphological methods.

Overall, the work highlights robustness and applicability of the concept of physical geomorphometry in various application in geosciences and beyond, that was partially demonstrated in the research.

How to cite: Popov, A. and Minár, J.: Physical geomorphometry: From a concept to practical applications, EGU General Assembly 2026, Vienna, Austria, 3–8 May 2026, EGU26-17175, https://doi.org/10.5194/egusphere-egu26-17175, 2026.

EGU26-19944 | ECS | Posters virtual | VPS26

FROM CATCHMENT TO CHANNEL: HIGH-PERFORMANCE PARALLEL MODELING OF SEDIMENT TRANSPORT IN THE TEL RIVER BASIN USING ANUGA Sed 

Akshay Vyankat Dahiwale, Upasana Dutta, Yogesh Kumar Singh, Girishchandra Yendargaye, T S Murugesh Prabhu, and Sekhar Muddu

The Tel River, a major tributary of the Mahanadi River in eastern India, exhibits strong spatial and temporal variability in flow and sediment dynamics due to its monsoon-driven hydrology, heterogeneous terrain, and increasing human interventions. Soil erosion and sediment transport, although naturally driven by rainfall and surface runoff, have been significantly altered by agriculture, urbanization, and water management structures, leading to changes in soil loss, sedimentation, and degradation of water resources. Therefore, in this study, the production of soil erosion in the Tel River Basin is estimated using the Revised Universal Soil Loss Equation (RUSLE), while riverine sediment transport is simulated using ANUGA-Sed, a two-dimensional shallow-water hydrodynamic and sediment transport model based on a finite-volume scheme. The ANUGA flow and sediment modules were calibrated and validated using observed discharge and suspended sediment data from multiple gauging stations along the Tel River. Parallel simulations performed on the Param Pravega high-performance computing systems significantly reduced computation time while maintaining numerical accuracy, enabling high-resolution modelling of the entire Tel River Basin. The model was further evaluated for elasticity, computational accuracy, and optimal grid distribution per node on the HPC system, demonstrating robust scalability and efficient utilization of computational resources.

The model results show strong agreement with observations, with errors in net erosion and deposition generally below 10%. The simulations successfully reproduce the spatial patterns of sediment generation, transport, and deposition along the river network. Importantly, the model provides new insights into sediment dynamics between gauging stations where direct measurements are unavailable and captures cross-sectional channel changes associated with sediment transport processes. These results were further validated using field-based suspended sediment data collected in October 2023 at intermediate river locations using portable sampling instruments. The simulations reveal distinct zones of high erosion and deposition that are critical for understanding flood conveyance and channel stability. Overall, the results confirm that ANUGA-Sed can reliably simulate suspended sediment transport and riverbed changes in monsoon-dominated river systems.

How to cite: Dahiwale, A. V., Dutta, U., Singh, Y. K., Yendargaye, G., Prabhu, T. S. M., and Muddu, S.: FROM CATCHMENT TO CHANNEL: HIGH-PERFORMANCE PARALLEL MODELING OF SEDIMENT TRANSPORT IN THE TEL RIVER BASIN USING ANUGA Sed, EGU General Assembly 2026, Vienna, Austria, 3–8 May 2026, EGU26-19944, https://doi.org/10.5194/egusphere-egu26-19944, 2026.

EGU26-19976 | ECS | Posters virtual | VPS26

Cryoseismic monitoring in the Schirmacher Oasis, East Antarctica 

Nivika Singh Sattasi, Vipul Silwal, Manoj Tm, Ariz Ahamad, Ankit Suthar, and Sanjay Singh Negi

We conducted a two-month-long cryoseismic monitoring study in the Schirmacher Oasis, East Antarctica, to investigate icequake activity caused by the movement and melting of ice sheets. For this purpose, we deployed a Raspberry Shake seismometer on the Antarctic land and ice sheet for a month. Through a comparative analysis of the recorded seismic data, we gained insights into ice dynamics and diurnal icequake patterns. The Raspberry Shake instrumentation, powered by solar energy, offers a cost-effective approach for establishing a dense seismic network. During installation, the seismometer, solar controller, and Li-ion battery were housed in a wooden box lined with nitrile foam for insulation. The analysis suggests that icequake detections follow a distinct diurnal pattern, with more events occurring during the daytime. Furthermore, we also observe interdependence between icequake detections and high wind speeds.We use a multi STA/LTA approach for event detection on a continuous 11-day period while the seismometer was on ice. We detect 2249 icequake events, which are further manually classified into three categories. More than half of icequakes (67%) belong to a shallow origin and some are indicative of deep icequakes (9%).These findings highlight the need for a denser seismic network and more detailed investigations to further understand the impact of climate change on melting ice sheets.

How to cite: Sattasi, N. S., Silwal, V., Tm, M., Ahamad, A., Suthar, A., and Negi, S. S.: Cryoseismic monitoring in the Schirmacher Oasis, East Antarctica, EGU General Assembly 2026, Vienna, Austria, 3–8 May 2026, EGU26-19976, https://doi.org/10.5194/egusphere-egu26-19976, 2026.

EGU26-20785 | ECS | Posters virtual | VPS26

Remote sensing analysis of water dynamics within floodplain lakes in the eastern part of the Mackenzie River delta 

Damian Ciepłowski and Michał Habel

River deltas play a crucial role in the transport of sediments and nutrients between river catchments and the sea. Scientific studies have demonstrated that Arctic deltas have a significant potential for sediment retention. Ongoing climate change is accelerating the thawing of permafrost, which largely constitutes the substrate of Arctic deltas, thereby affecting the morphological and hydrological evolution of these low-lying tundra systems.

The aim of this study is to estimate changes in the surface area and flood storage capacity of deltaic lakes using remote sensing methods. Optical and radar satellite data from Sentinel-2 and RADARSAT-2 were used, obtained under a grant from the Canadian Space Agency (application no. RCM CSA-RC-FORM-0003), together with advanced tools for spatial and radar data analysis. The selected study area is an eastern part of the Mackenzie River Delta (Canada, Northwest Territories), namely Big Lake, located near the city of Inuvik, approximately 130 km from the Beaufort Sea. The Big Lake is a through-flow lake with an area of about 800 ha. It is part of a system of approximately 2,000 lakes that maintain year-round connectivity with the East Channel, one of the main distributary channels conveying water within the delta.

The presented results are based on satellite and hydrological analyses conducted at the beginning of the ice-free water period, occurring at the turn of May and June. The study includes a comparison of satellite observations with gauge data. To determine the extent and volume of floodwaters, the Normalized Difference Water Index (NDWI), advanced radar data analyses, and statistical analyses of hydrological data from Water Survey of Canada (WSC) were applied. Satellite imagery acquired during open-water seasons made it possible to delineate shoreline extents and the associated water surface elevations. Selected years from the period 2011–2024 were analysed; for example, it was estimated that at the turn of May and June 2024 the lake stored approximately 8.2 million m³ of water over a period of 49 days.

Considering sediment transport, the Mackenzie River is the largest supplier to the Arctic Ocean, delivers more than 100 million tonnes of sediment annually. Previous studies characterise these sediments as predominantly fine-grained fractions that are easily transported. The presence of an organic-rich catchment combined with the magnitude of fluvial sediment transport highlights the importance of understanding the mechanisms governing sediment distribution, quantities, and areas of deposition within the delta system.

This research is being conducted with the permission of the Government of Canada – North West Territories (NWT) – research licence number 17694 which was issued under application number 6131 and financed by the Polish Ministry of Education and Science - National Research Agency, title: Evaluation of the settling velocity and trapping capacity of sediments in lakes in the Great Arctic River deltas, grant no. 2023/50/O/ST10/00597.

How to cite: Ciepłowski, D. and Habel, M.: Remote sensing analysis of water dynamics within floodplain lakes in the eastern part of the Mackenzie River delta, EGU General Assembly 2026, Vienna, Austria, 3–8 May 2026, EGU26-20785, https://doi.org/10.5194/egusphere-egu26-20785, 2026.

The non-linear feedback mechanisms and interactions between discharge-sediment supply and instream (riparian) vegetation cover generate spatio-temporal heterogeneity in braided channel forms. The present study examines such relationships among three contrasting braided rivers of India: the Brahmaputra (highly braided), the Brahmani (weakly braided) and the Netravathi (meandering-braided). Long term JRC Surface water layer, vegetation-water remote sensing indices, numerical model derived hydrological datasets and periodic field visits have been integrated to understand the vegetation–hydrology–sediment coupling across these braided river systems.  The results show that the channel forming discharges in the Brahmaputra shows a hierarchical level and extreme events dominate over the effect of sparse vegetated landforms. In weakly braided reaches, channel-in-channel form oscillates between two extreme nodes depending upon the intensity of disturbing events. For rivers with meandering-braided transition form, channels are relatively stable and riparian vegetation cover generate a stable geometry and absence of floodplain sediment storage.   

How to cite: Pradhan, C.: Integrating Google Earth Engine Cloud Computing and Fluvial Surveys to Quantify Vegetation–Hydrology–Sediment Coupling in Contrasting Braided River Systems, EGU General Assembly 2026, Vienna, Austria, 3–8 May 2026, EGU26-21498, https://doi.org/10.5194/egusphere-egu26-21498, 2026.

The influence of dissipating solar diurnal tides in driving the mean zonal wind in the upper mesosphere and lower thermosphere (UMLT) is investigated using the zonal and meridional winds observed by the Michelson Interferometer for Global High-Resolution Thermospheric Imaging (MIGHTI) instrument onboard the Ionospheric Connection Explorer (ICON) satellite over the region of interest having a latitudinal and longitudinal extent of 5° N - 15°N and 67.5°E - 90°E, respectively, for the years 2020, 2021 and 2022. The mean zonal wind exhibits consistent seasonal variation with large westward winds at 91-103 km during January-March and September-December, however with varying intensity (20-40 m/s) in all the three years. The diurnal tidal amplitude in meridional wind (DTV) also displays similar seasonal variation with maximum amplitudes reaching ~80–100 m/s. The seasonal variation of westward acceleration due to diurnal tide momentum deposition is found to be maximum during January-March (18-43 m/s/day) and September-December (40-55 m/s/day) and reveals similar seasonal variation and intensity of the mean westward winds. This clearly indicates that the potential role of diurnal tide in driving the mean zonal flow.  The westward acceleration induced by the vertical gradient of meridional flux of zonal momentum (Fmeridional) due to diurnal tide exceeds the convergence of vertical flux of zonal momentum (Fzonal) due to diurnal tide during January-March, while the westward acceleration induced by both Fzonal and Fmeridional are larger and comparable during September-December.

How to cite: Basu, S. and Sundararajan, Dr. S.: Influence of diurnal tide on the low-latitude UMLT mean zonal wind: Evidence from momentum flux estimation using ICON-MIGHTI winds, EGU General Assembly 2026, Vienna, Austria, 3–8 May 2026, EGU26-2435, https://doi.org/10.5194/egusphere-egu26-2435, 2026.

We performed a one-year long simulation using the upper-atmosphere configuration of the Icosahedral Nonhydrostatic model (UA-ICON). The simulation has a horizontal resolution of 20 km and 180 vertical levels between the ground and 150 km. At 110 km height and every hour we extracted the gravity wave vectors and amplitudes with the small-volume few-wave decomposition method S3D, which is part of the software package JUWAVE. We focus on low-latitudes, i.e. +/- 40 degrees. The model simulates clear signatures of gravity wave activity above convective hotspots over summer continents. Ray tracing shows that the largest perturbations in the thermosphere are likely primary waves from developing convection. These signatures are most prominent in waves with short horizontal scales and long vertical wavelengths. In turn, horizontally short waves with smaller vertical wavelengths cannot be traced down to the lower stratosphere. For horizontally long waves, we find a clear diurnal/longitudinal pattern in the gravity wave activity, which results from interactions with tides. The study has broad implications of how whole-atmosphere high-resolution models may help forecast thermospheric density and ionospheric perturbations, both from the numerical weather prediction perspective, as well as empirically based on known patterns of lower-atmospheric variability.

How to cite: Stephan, C.: Tracing low-latitude thermospheric gravity waves in a whole-atmosphere simulation to their sources, EGU General Assembly 2026, Vienna, Austria, 3–8 May 2026, EGU26-2620, https://doi.org/10.5194/egusphere-egu26-2620, 2026.

EGU26-3064 | ECS | Posters virtual | VPS27

Storm-Time Strip-Like Plasma Density Bulges at Middle Latitudes Shaped by Meridional Wind Gradients 

Wenyu Du, Jiahao Zhong, and Xin Wan

Prior studies identified a fine structure in the middle latitude ionosphere known as the strip-like plasma density bulge. These bulges emerge during geomagnetic storms, exhibiting a broad longitudinal span of over 150° and a narrow latitudinal extent of 1°~5°. The observations from the DMSP and ICON satellites reveal stronger equatorward ion drifts and neutral winds on the poleward side of bulges compared to the equatorward side. Using the Sami2 is Another Model of the Ionosphere (SAMI2), the bulge feature was reproduced for the storm of 4~6 November 2021 by amplifying the default meridional winds. Numerical simulations indicate that global wind disturbances establish a sharp meridional wind gradient within the lower mid-latitude region. This gradient, in turn, drives a divergence in ion transport parallel and perpendicular to the magnetic field lines, which ultimately results in the localized accumulation of plasma. The phenomenon is most pronounced in the vicinity of ±30° quasi-dipole latitude. This region is characterized by a magnetic inclination angle of approximately 45°, a configuration where the meridional wind component acts most efficiently to elevate ions vertically.

How to cite: Du, W., Zhong, J., and Wan, X.: Storm-Time Strip-Like Plasma Density Bulges at Middle Latitudes Shaped by Meridional Wind Gradients, EGU General Assembly 2026, Vienna, Austria, 3–8 May 2026, EGU26-3064, https://doi.org/10.5194/egusphere-egu26-3064, 2026.

EGU26-3726 | Posters virtual | VPS27

Reproduction of Long-Term Variability of Super-Rotation Using Akatsuki Horizontal Wind Data Assimilation 

Yukiko Fujisawa, Norihiko Sugimoto, Nobumasa Komori, Shin-ya Murakami, Hiroki Ando, Masahiro Takagi, Takeshi Imamura, Takeshi Horinouchi, George L. Hashimoto, Masaki Ishiwatari, Takeshi Enomoto, Takemasa Miyoshi, Hiroki Kashimura, and Yoshi-Yuki Hayashi

In Fujisawa et al. (2022) [1], we previously produced an objective analysis of the Venusian atmosphere by assimilating horizontal winds derived from cloud tracking of the UVI camera onboard the Venus orbiter Akatsuki. To produce objective analysis, we used the Venus atmospheric data assimilation system ALEDAS-V (Sugimoto et al., 2017) [2], which is based on the Venus general circulation model AFES-Venus (Sugimoto et al., 2014) [3]. This dataset appropriately corrects both the phase bias of thermal tides and the super-rotation speed in AFES-Venus to be closer to those observed in the real Venusian atmosphere. The dataset was produced by assimilating observations from September to December 2018, a period that includes an intensive observation period of Akatsuki.

Akatsuki has accumulated observational data over a long period from 2015 to 2024, and it has been revealed that the super-rotation speed exhibits both faster and slower periods (Horinouchi et al., 2024) [4]. In this study, we selected five epochs during the Akatsuki observation period that exhibit characteristic super-rotation speeds and performed data assimilation for each epoch. As a result, we confirmed that distinct super-rotation speeds corresponding to each epoch, including their meridional asymmetry, are reproduced. In the presentation, we will show the relationship between the reproduced super-rotation speeds and the structure of the atmospheric circulation.

  • [1] Fujisawa, Y., et al. (2022) Sci. Rep. 12, 14577.
  • [2] Sugimoto, N., et al. (2017) Sci. Rep. 7(1), 9321.
  • [3] Sugimoto, N., et al. (2014) J. Geophys. Res. Planets 119, 1950–1968.
  • [4] Horinouchi, T., et al. (2024) J. Geophys. Res. Planets 129, e2023JE008221.


How to cite: Fujisawa, Y., Sugimoto, N., Komori, N., Murakami, S., Ando, H., Takagi, M., Imamura, T., Horinouchi, T., Hashimoto, G. L., Ishiwatari, M., Enomoto, T., Miyoshi, T., Kashimura, H., and Hayashi, Y.-Y.: Reproduction of Long-Term Variability of Super-Rotation Using Akatsuki Horizontal Wind Data Assimilation, EGU General Assembly 2026, Vienna, Austria, 3–8 May 2026, EGU26-3726, https://doi.org/10.5194/egusphere-egu26-3726, 2026.

EGU26-4537 | Posters virtual | VPS27

Temporal Variations of Jupiter’s Plasma Disk Observed by Juno  

Fran Bagenal and Jian-Zhao Wang

Jupiter’s magnetosphere features internal mass loading from its innermost moon Io. The neutral gases from Io’s escaping atmosphere are ionized to become the plasma torus, which mainly consists of sulfur and oxygen ions. Under centrifugal force, plasma in the torus is transported outward and forms a thin plasma disk near the equator, while the transport mechanism and timescale remain unclear. Since 2016, the plasma disk between 10 and 50 RJ has been continuously observed by the Juno mission. Using multi-year thermal plasma measurements from the JADE ion detector, we perform an analysis that reveals significant temporal variation of plasma disk from a long-term perspective. For different Juno orbits, the plasma disk observations are categorized as either enhanced or depleted based on plasma density. Extreme cases indicate vastly different states of the plasma disk, with variations exceeding one order of magnitude. Further analysis of multiple plasma disk crossings by Juno reveals correlations between density enhancements and fluctuations in plasma density and magnetic field profiles, which are typical features of flux tube interchange. This suggests that flux tube interchange is triggered by an increase in the plasma source and is considered the primary mechanism for outward plasma transport. Finally, Juno’s in-situ measurements also show a correlation with remotely sensed Io’s torus ribbon brightness from the ground-based IoIO observatory, lagged by about 30 to 50 days. This suggests that the temporal variation of the plasma disk is modulated by changes in Io’s torus and that the average plasma transport time from the torus to the plasma disk is around 40 days. 

How to cite: Bagenal, F. and Wang, J.-Z.: Temporal Variations of Jupiter’s Plasma Disk Observed by Juno , EGU General Assembly 2026, Vienna, Austria, 3–8 May 2026, EGU26-4537, https://doi.org/10.5194/egusphere-egu26-4537, 2026.

EGU26-5870 | ECS | Posters virtual | VPS27

Juno Constraints on Io’s Interior: Tidal Response and Melt Stability 

Matteo Paris, Alessandro Mura, Francesca Zambon, Antonio Genova, Federico Tosi, Giuseppe Piccioni, Anastasia Consorzi, Giuseppe Mitri, Roberto Sordini, Raffaella Noschese, Andrea Cicchetti, Christina Plainaki, Scott Bolton, and Giuseppe Sindoni

Jupiter’s moon Io is the most volcanically active body in the Solar System, powered by intense internal heating due to tidal dissipation. Although tidal friction is widely accepted as the main energy source, how this heat is distributed within Io and how it shapes the moon’s internal structure remain open questions. In this study, we use Io’s tidal response, quantified through the degree-2 Love number (k2), to constrain its interior, using recent estimates derived from Juno observations (Park et al., 2025).

We model Io with a three-layer structure consisting of a fluid core, a viscoelastic mantle, and a crust, using an adapted version of the California Planetary Geophysics Code (CPGC). Tidal dissipation is self-consistently coupled to mantle rheology through an Andrade model, with viscosity and shear modulus updated as functions of the local melt fraction. We explore two end-member scenarios that differ in the treatment of the Andrade parameter β: in the first, β is held constant, representing a uniform dissipation regime dominated by deep-mantle heating; in the second, β varies with depth, allowing dissipation to be preferentially localized in the upper mantle. In both scenarios, viscosity and shear modulus evolve with melt fraction.

Our results identify several partially molten mantle configurations whose real part of k2 is consistent with Juno constraints. In all acceptable models, melt fractions remain below the threshold required to form a global magma layer. To test the physical viability of these states, we compare thermodynamic melt production with the capacity for melt migration. We find that melt transport is efficient enough to prevent long-term melt accumulation, favoring a stable, partially molten “magma sponge” rather than a global magma ocean. These results provide new constraints on Io’s thermal state and are consistent with independent estimates of its global volcanic output.

How to cite: Paris, M., Mura, A., Zambon, F., Genova, A., Tosi, F., Piccioni, G., Consorzi, A., Mitri, G., Sordini, R., Noschese, R., Cicchetti, A., Plainaki, C., Bolton, S., and Sindoni, G.: Juno Constraints on Io’s Interior: Tidal Response and Melt Stability, EGU General Assembly 2026, Vienna, Austria, 3–8 May 2026, EGU26-5870, https://doi.org/10.5194/egusphere-egu26-5870, 2026.

EGU26-7948 | ECS | Posters virtual | VPS27

Prototype Design for a Lunar Lander High Resolution Stereo Camera 

Shreya Champakbhai Chauhan, Ralf Jaumann, Matthias Grott, and Christian Althaus

Terrestrial exploration with the help of rovers typically employs traditional stereo cameras, relying on binocular optical designs with large, bulky, and often moving parts. The stereo camera design concept presented in this study was developed and built using commercial off-the-shelf (COTS) components, allowing for rapid-prototyping, cost-effective testing, and performance evaluation under simulated mission conditions. An innovative use of four-mirror optical configuration and a monochrome CMOS sensor introduces a novel approach to achieve high resolution stereo imaging, while maintaining low power consumption and space requirements suitable for compact lander missions. By utilizing a single-detector stereo vision, the camera system can effectively create 3D reconstructions of observed objects with a spatial resolution of 54 μm per pixel, and depth resolution of <1 mm per pixel with the stereo baseline length of 116 mm, an instantaneous field of view of 601 μrad per pixel. The optical performance was validated with experiments such as the resolution and shape measurement test. The scientific applicability was demonstrated by extracting the static angle of repose of regolith simulants EAC-1A and NU-LHT-2M, as well as the relative surface albedo through a photometric stereo method, providing deeper understanding into the physical and optical properties of lunar regolith analogues. The presented camera design offers a balance between performance with compactness, addressing challenges faced by conventional stereo cameras such as baseline constraints, environmental exposure, and computational efficiency. Further design limitations and stereo matching inaccuracies were identified during testing and characterisation. The stereo camera developed in this study demonstrates capabilities for high-resolution, in-situ lunar surface analysis based on regolith characterization and contributes to an in-depth understanding of lunar regolith properties by close-range scientific analysis of its geo-mechanical behaviour.

How to cite: Chauhan, S. C., Jaumann, R., Grott, M., and Althaus, C.: Prototype Design for a Lunar Lander High Resolution Stereo Camera, EGU General Assembly 2026, Vienna, Austria, 3–8 May 2026, EGU26-7948, https://doi.org/10.5194/egusphere-egu26-7948, 2026.

EGU26-8876 | ECS | Posters virtual | VPS27

A New Impact Model for The Norian, Late Triassic Manicouagan Crater 

Sarah Salem, Aisha Al-Suwaidi, and Mohamed El-Maarry

Abstract

Meteorite impacts can lead to significant disruptions of Earth’s systems, potentially affecting the planet's climate, ecosystems, and environment. The Manicouagan impact event is recorded by one of the largest impact craters of the Phanerozoic era, located in Quebec, Canada in the Grenville Province of the Canadian Shield, with a rim-to-rim diameter of 85–100 km. It has a precise age of 215.40 ± 0.16 Ma, yet its environmental aftermath remains poorly constrained, particularly any robust link to the Norian, Late Triassic extinction pulses or carbon-cycle perturbations. Here we present a new impact-Simplified Arbitrary Lagrangian-Eulerian (iSALE) hydrocode simulation against the Manicouagan’s target lithologies to constrain the most plausible impactor diameters and velocities that would reproduce the observed crater morphology. Three best-fit models of crater diameters and velocities of 7.2 km at 20 km s-1, 8.8 km at 15 km s-1, and 10.4 km at 12 km s-1 reproduced crater diameters of 90, 95, and 100 km, respectively. We calculated the kinetic energy delivered by each projectile, which is on the order of 1.17–1.27x10²³ J. The calculated energy is sufficient to vaporize the entire projectile and a considerable amount of the upper target lithologies, and melt large volumes of the target rocks. We then estimated the mass of vapor released into the atmosphere by using scaling relations and assessed the potential post-initial settling of the vapor mass after condensation and re-entry to be ~5x10¹⁷ g. This exceeds the ~1016 g blackout threshold required to cause global cessation of photosynthesis, darkness, and cooling. Our results provide numerical assessments of the environmental consequences of the Manicouagan impact event and a framework for reassessing its potential role in Late Triassic biotic and climatic events.

Keywords

Manicouagan Impact Event, Hydrocode modeling, iSALE simulations, Late Triassic, Environmental consequences.

How to cite: Salem, S., Al-Suwaidi, A., and El-Maarry, M.: A New Impact Model for The Norian, Late Triassic Manicouagan Crater, EGU General Assembly 2026, Vienna, Austria, 3–8 May 2026, EGU26-8876, https://doi.org/10.5194/egusphere-egu26-8876, 2026.

Auroras are the result of charged particles interacting with a planetary atmosphere, driving several processes involving the excitation and ionization of molecules and atoms, leading to spectacular emissions. This study investigates Martian auroral emissions using observations from the Emirates Ultraviolet Spectrometer (EMUS) onboard the Emirates Mars Mission (EMM) Hope Probe. The analysis focuses on the oxygen emission lines at 130.4 nm and 135.6 nm, which are key diagnostics of electron precipitation. EMUS emission images are processed to compute brightness maps and intensity ratios, identify energetic regions using thresholding techniques, and generate histograms that characterize the spatial distribution and statistical properties of auroral energy across different regions of Mars.

In addition, data from the Mars Atmosphere and Volatile EvolutioN (MAVEN) mission, particularly magnetic field measurements from the MAG instrument, are used to correlate auroral observations with the Martian crustal magnetic field. By combining EMM ultraviolet observations with MAVEN magnetic field measurements, the study explores the relationship between auroral morphology, energy deposition, and underlying magnetic field topology.The goal is to assess how magnetic field geometry influences the localization and structure of auroral emissions and to better constrain the coupling between the solar wind, the Martian magnetosphere, and the upper atmosphere.

The combined analysis demonstates the potential of how combined EMM and MAVEN observations improves our understaing of of auroral processes on Mars and their implications for planetary atmosphere studies and space weather interactions.

How to cite: Alblooki, S. and Atri, D.: Exploring Martian Auroras Using EMM/EMUS and MAVEN/MAG: Insights into Ultraviolet Emissions and Crustal Magnetic Field Interactions, EGU General Assembly 2026, Vienna, Austria, 3–8 May 2026, EGU26-8953, https://doi.org/10.5194/egusphere-egu26-8953, 2026.

EGU26-11477 | ECS | Posters virtual | VPS27

A Petrographic and Micro-Analytical Framework for the Study and Classification of Meteorites 

Simone Borghetti, Mario Di Martino, Simona Ferrando, Daniela Faggi, Stefano Ghignone, Marco Morelli, Romano Serra, and Gloria Vaggelli

This contribution presents a petrographic, microstructural, and micro-analytical approach developed for the comprehensive study of ordinary chondrites, as part of a master’s thesis aimed at defining an analytical protocol for the petrological and minerochemical characterization of extraterrestrial materials. The ultimate goal is the establishment of a dedicated laboratory for the petrological study of meteorites, exploiting available instrumentation and acquired micro-analytical expertise to achieve both a complete classification of chondrites and a deeper understanding of the processes governing their genesis and evolution.

The study was carried out in collaboration with the Italian Museum of Planetary Sciences, where an internship allowed the examination of a reference collection of classified meteorite thin sections commonly used for educational purposes. Subsequently, three ordinary unclassified chondrites, provided by the “Museo del Cielo e della Terra” (San Giovanni in Persiceto, Bologna, Italy) and by a private collection, were investigated.

The analytical workflow includes: (i) macroscopic measurements and photographic documentation; (ii) petrographic analysis by transmitted and reflected light optical microscopy for microstructural and mineralogical characterization; (iii) SEM-EDS X-ray compositional mapping on the whole petrographic thin section as well as on selected chondrules and microstructural sites; (iv) SEM-EDS quantitative microanalyses of mineral phases; and (v) micro-Raman spectroscopy.

Preliminary results indicate that, from a chemical perspective, two of the unclassified samples can be assigned to the H group and one to the L group of ordinary chondrites. Petrographic observations classify the investigated meteorites as petrologic types 4 to 6. The most common chondrule textures observed include porphyritic and barred olivine, porphyritic olivine–pyroxene, granular olivine–pyroxene, radial pyroxene, and complex chondrules.

SEM-EDS compositional maps of entire thin sections and selected microstructural domains enable visualization of textural relationships, estimation of modal mineral abundances relative to metallic phases, and the development of a comparative framework among ordinary chondrites. Mineral chemistry data are compared with literature values to refine classification criteria. Micro-Raman spectroscopy is performed on opaque phases or on selected minerals for the correct identification of the polymorphic phase which constrains proper ranges of P-T conditions. Moreover, micro-Raman analyses are employed to characterize solid and fluid/melt inclusions within primary minerals, assess surface alteration features, and investigate dust extracted from fractures, providing insights into secondary processes related to atmospheric entry and post-impact evolution.

How to cite: Borghetti, S., Di Martino, M., Ferrando, S., Faggi, D., Ghignone, S., Morelli, M., Serra, R., and Vaggelli, G.: A Petrographic and Micro-Analytical Framework for the Study and Classification of Meteorites, EGU General Assembly 2026, Vienna, Austria, 3–8 May 2026, EGU26-11477, https://doi.org/10.5194/egusphere-egu26-11477, 2026.

The recent Martian exploration mission has provided substantial evidence for the presence of hydrous sulphate minerals, especially in the Gale Crater and Meridiani Planum. These findings are crucial for understanding the past climate, water activity, and geological history of early Mars. Studying the sulphate formation process, particularly jarosite, has become increasingly important. In this context, terrestrial analog sites with similar mineral deposits can serve as effective models for exploring and analyzing sulphate deposits in detail. The Matanomadh and Harudi formations of Kachchh, Gujarat, India, were chosen as Martian analog sites because they expose well-preserved, clay-rich jarosite layers that may help better understand paleo-environmental conditions during Martian alteration. Here, jarosite is found alongside grey carbonaceous shale, weathered basalt, and gypsum, typically appearing as lenses of variable width, interconnected veins, or veinlets. Pure jarosite samples were collected after detailed field studies from the Matanomadh and Harudi formations of Kachchh. Powdered samples were characterized using X-Ray Diffraction (XRD), High-Resolution Transmission Electron Microscopy (HR-TEM), Field Emission Scanning Electron Microscopy (FE-SEM), X-Ray Photoelectron Spectroscopy (XPS), and Elemental Analyzer-Isotope Ratio Mass Spectrometry (EA-IRMS) for sulfur isotope analysis. All XRD patterns were analyzed with the FullProf program using Rietveld refinement, employing the R-3m space group. The average a- and c-cell dimensions for jarosite were calculated as a = 7.3028 Å and c = 16.6376 Å. The XRD diffractogram displays a distinct peak at (006) at 2θ = 32.29°. FE-SEM images show that jarosite crystals have well-formed pseudohexagonal shapes with defined faces and edges. HR-TEM analysis indicates the dominance of sodium (Na), and elemental mapping confirms homogeneous grains. XPS analysis of jarosite revealed prominent peaks for Fe2p3/2 and S2p at approximately 713.4 eV and 169.9 eV, respectively. S2p peaks were also observed in the host shale rock. δ34S values for jarosite (-8.4 to -16‰) are close to values typical of supergene or steam-heated hydrous sulphates derived from pyrite or H2S oxidation. The cell dimensions obtained from XRD data agree with literature values, confirming the mineral as Natrojarosite. The peak position of the (006) reflection in natrojarosite differs from that of jarosite. In this sample group, iron (Fe) exists in the +3 oxidation state, as confirmed by XPS. Based on the presence of sulfur (S -1) peaks in the associated shale, it is inferred that shale may serve as a sulfur source for natrojarosite formation in the current study area under acidic, oxidizing conditions.

How to cite: Saha, N. and Majumdar, A. S.: Integrated Micro to Nano-Scale Characterization of Hydrous Sulphate Mineral-Jarosite in Kachchh, Gujarat, India: Implication for Mars, EGU General Assembly 2026, Vienna, Austria, 3–8 May 2026, EGU26-12992, https://doi.org/10.5194/egusphere-egu26-12992, 2026.

EGU26-14494 | Posters virtual | VPS27

Radical Terraforming of Mars and Planetary Engineering 

Leszek Czechowski

The radical terraforming of Mars was proposed in 2025 (LPSC2025, 1558.pdf) envisions bringing volatiles with a total mass of approximately 1019 kg from the Kuiper Belt to Mars. This would amount to approximately 1000 asteroids. Upon reaching Mars, these bodies will have velocities ranging from a few to a dozen or so km/s relative to the planet. The impact sites and their parameters will be controlled to some extent. This would be a unique opportunity to use these bodies to modify the surface of Mars. The goal of radical terraforming is also to create open water reservoirs and rivers. The planet's current topography makes these plans very difficult. Large elevation differences would lead to rapid concentration of water in a few low-lying areas. We show examples of possible stable zones that would provide habitable conditions for ecosystems from Earth. Another possibility of using impacts is the targeted transformation of minerals. Asteroids themselves contain not only water and volatile substances but also other compounds. Placing them in appropriate places can make the economy easier for future residents.

How to cite: Czechowski, L.: Radical Terraforming of Mars and Planetary Engineering, EGU General Assembly 2026, Vienna, Austria, 3–8 May 2026, EGU26-14494, https://doi.org/10.5194/egusphere-egu26-14494, 2026.

EGU26-14914 | Posters virtual | VPS27

The Juno PJ57 and PJ58 flybys of Io: Multi-species physical chemistry simulations  

Vincent Dols and Frances Bagenal

The Juno spacecraft made close flybys of Io on Dec. 2023 (PJ57) and Feb 2024 (PJ58) above respectively the northern/southern hemisphere with an altitude at closest approach (CA) of ~1,500 km.

On PJ57, Juno went through the Alfven wing and both the Juno/Waves and Radio-occultation measurements showed a surprising large electron density nel ~ 28,000 near closest approach. On PJ58, Juno flew slightly behind the Alfven wing and the instruments measured a plasma density consistent with the background plasma torus density.

We run numerical simulations of the plasma/atmosphere interaction along teh PJ57 and PJ58 flyby to constrain IO’s polar atmosphere. Our numerical simulations are based on (1) A prescribed atmospheric composition and distribution of S, O, SO2 and SO; (2) A MHD code to calculate the plasma flow into Io’s atmosphere; (3) A multi-species physical chemistry code to compute the change of the plasma properties (ion densities, composition and temperature) during the plasma/atmosphere interaction (4) a formulation of the ionization by the field-aligned electron beams used for auroral electrons on Earth.

We compute the multi-charged ion composition of the plasma along each flyby and compare to the Juno/JADE measurements to infer the atmosphere composition (O, S, SO2, SO) and density at polar latitudes. 

How to cite: Dols, V. and Bagenal, F.: The Juno PJ57 and PJ58 flybys of Io: Multi-species physical chemistry simulations , EGU General Assembly 2026, Vienna, Austria, 3–8 May 2026, EGU26-14914, https://doi.org/10.5194/egusphere-egu26-14914, 2026.

EGU26-16003 | ECS | Posters virtual | VPS27

Cutting-Edge Projects in Aurora Participatory Science 

Vincent Ledvina, Elizabeth MacDonald, Laura Edson, and Feras Natsheh

Participatory science, also called citizen science, connects scientists with the public to enable discovery by engaging broad audiences across the world. In aurora science, direct collaborations, crowdsourced efforts, and community engagement bridge aurora chasers with scientists to do research. These efforts have been fueled by recent large geomagnetic storms, evolving consumer camera technologies, social media, and dedicated citizen science projects. In this presentation, we highlight recent, cutting-edge participatory science efforts with a primary focus on the Aurorasaurus project and how it can be used to study major storm-time auroral activity.

Aurorasaurus is an award-winning citizen science platform that has been operating for over a decade. Aurora observers submit visibility reports and photos, which are filtered and cleaned to generate science-quality datasets. We highlight Aurorasaurus data from recent major geomagnetic storms in 2024 and 2025, emphasizing how rapid, widespread reporting during extreme events enables mapping of storm-time auroral extent and tracking changes in the auroral oval boundary at low latitudes. During the May 10-11, 2024 geomagnetic storm, Aurorasaurus compiled more than 5,000 vetted reports from 50+ countries, allowing for unique data-model comparisons and tracking of the extent of auroral visibility.

We also address the efficacy of using citizen science photos for research. We discuss how submitted images not only provide additional perspectives and validation of reported auroral forms, but can also constitute unique scientific datasets beyond the capabilities of traditional instrument networks. For example, modern consumer cameras can capture high spatial resolution views of fine-scale auroral structure, and photos from multiple observers can be combined to enable stereoscopic and tomographic reconstructions of auroral morphology and its evolution.

Finally, we briefly note complementary campaign-style participatory science efforts, including the AurorEye project’s low-cost deployable all-sky timelapse units, the SolarMaX mission in coordination with SpaceX’s Fram2 launch, and collaborations between aurora chasers and the SuperDARN team to supplement radar measurements with optical aurora data. With the ongoing solar maximum, it is important to harness the excitement and enthusiasm surrounding the aurora and space weather. Participatory science efforts build important relationships between public communities and scientists and unlock unique research benefits.

How to cite: Ledvina, V., MacDonald, E., Edson, L., and Natsheh, F.: Cutting-Edge Projects in Aurora Participatory Science, EGU General Assembly 2026, Vienna, Austria, 3–8 May 2026, EGU26-16003, https://doi.org/10.5194/egusphere-egu26-16003, 2026.

EGU26-21015 | Posters virtual | VPS27

Deciphering mixtures of complex organic compounds in cosmic dust particles using JAXA's Destiny+ Dust Analyzer 

Nozair Khawaja, Ralf Srama, Derek H. H. Chan, Jonas Simolka, Steven P. Armes, Rebecca Mikula, Takayuki Hirai, Yanwei Li, Heiko Strack, Thomas R. O'Sullivan, Partha P. Bera, Anna Mocker, Mario Trieloff, Frank Postberg, Jon K. Hillier, Sascha Kempf, Zoltan Sternovsky, Hikaru Yabuta, and Harald Krüger

Organic compounds are a ubiquitous component of cosmic dust and provide insight into the origin of planetary systems, the availability of carbon for life in the solar system and beyond, and the distribution of potential biosignatures in the universe. Compositional and dynamical analysis of such dust grains can shed insight into their origin. The Destiny Dust Analyzer (DDA) onboard JAXA’s interplanetary space mission DESTINY+ will detect and analyse the composition of (sub-)micron sized dust ejecta during flybys of asteroids Apophis and Phaethon [1,2]. DDA will characterise both interplanetary and interstellar dust grains during the mission’s lifetime [3]. DDA is an impact ionisation time-of-flight mass spectrometer, whereby dust particles incident onto the instrument’s target at hypervelocity (≥ 2 km s-1) vaporise and partially fragment into various constituent ions and neutrals. Here, we investigate the capability of DDA to detect a mixture of complex organic compounds in single cosmic dust particles. An organic cosmic dust analogue is prepared by coating polycyclic aromatic hydrocarbon, perylene (C20H12), microparticles with an ultrathin overlayer of a conductive polymer, polypyrrole H(C4H2NH)nH, to enable acceleration up to hypervelocities with a high-voltage van de Graaff instrument. Time-of-flight mass spectra obtained at impact speeds ~3-20 km/s are recorded in this calibration campaign. The characteristic parent molecular ion for perylene, [C20H12 (+H)]+, is observed at m/z 251 ± 1 in mass spectra arising from impacts between 3 and 8 km s-1. However, between 8 and 18 km s-1, no such parent ion is observed. Instead, impact ionisation mass spectra exhibit a characteristic series of homologous [CnHm]+ fragments originating from both polypyrrole and perylene, alongside some non-sequential ions which may be diagnostic for distinguishing between different organic components in cosmic dust. The contributions of each species to fragmentation patterns in the mass spectra is coupled with the impact velocity. Our results are in agreement with Mikula et al. (2024), who investigated impact ionisation of polypyyrole-coated anthracene particles for the Interstellar Dust EXperiment (IDEX) onboard NASA's Interstellar Mapping and Acceleration Probe (IMAP), and observed a similar relationship between fragmentation pattern and velocity [4].

Additional experiments with a range of PAHs, heterocycles, and lower mass organics at various velocities, will yield further insight into the detection and characterisation of heterogeneous dust likely to be encountered by DDA. Similarly, theoretical chemical calculations could assist in deciphering the contribution of different species to mass spectral features via the analysis of dissociation thermodynamics and kinetics.

[1] Ozaki et al. (2022) https://doi.org/10.1016/j.actaastro.2022.03.029

[2] Simolka et al. (2024) https://doi.org/10.1098/rsta.2023.0199

[3] Krüger et al. (2024) https://doi.org/10.1016/j.pss.2024.106010

[4] Mikula et al. (2024) https://doi.org/10.1021/acsearthspacechem.3c00353


How to cite: Khawaja, N., Srama, R., Chan, D. H. H., Simolka, J., Armes, S. P., Mikula, R., Hirai, T., Li, Y., Strack, H., O'Sullivan, T. R., Bera, P. P., Mocker, A., Trieloff, M., Postberg, F., Hillier, J. K., Kempf, S., Sternovsky, Z., Yabuta, H., and Krüger, H.: Deciphering mixtures of complex organic compounds in cosmic dust particles using JAXA's Destiny+ Dust Analyzer, EGU General Assembly 2026, Vienna, Austria, 3–8 May 2026, EGU26-21015, https://doi.org/10.5194/egusphere-egu26-21015, 2026.

EGU26-22816 | Posters virtual | VPS27

Simultaneous mapping of CO, SO2 and HDO on the night side of Venus  

Therese Encrenaz, Thomas Greathouse, Emmanuel Marcq, Wencheng Shao, Franck Lefèvre, Rohini Giles, Maxence Lefèvre, Thomas Widemann, Bruno Bézard, and Hideo Sagawa

In order to better understand the photochemical and dynamical processes which drive the atmosphere of Venus, we have started in January 2012 an observing campaign to monitor the behavior of sulfur dioxide and water near the cloud top of Venus, using the TEXES (Texas Echelon Cross-Echelle Spectrograph) imaging spectrometer at the NASA InfraRed Telescope Facility (IRTF, Mauna Kea Observatory ; Encrenaz et al. Astron. Astrophys. 703, id.A219, 2025). These data have shown evidence for drastic changes in the SO2 abundance, both on the short term and the long term, the origin of which is unclear, as well as a strong spatial variability at low latitudes. In February 2025, data have  been obtained at 4.7 and 7.4 microns on the night side of Venus (49 arcsec in diameter), allowing us for the first time to map simultaneously  CO, SO2 and H2O (through its proxy HDO) near the cloud top of Venus. The data seem to show a slight enhancement of CO around midnight, consistent with the results previously reported from millimeter/submillimeter observations in the upper mesosphere (Clancy et al. Icarus 217, 779, 2012). The TEXES data will be used in an attempt to constrain coupled dynamical-chemical GCM simulations of the Venus atmosphere (e.g. Shao et al., AGU General Conference, New Orleans, USA, December 2025). 

How to cite: Encrenaz, T., Greathouse, T., Marcq, E., Shao, W., Lefèvre, F., Giles, R., Lefèvre, M., Widemann, T., Bézard, B., and Sagawa, H.: Simultaneous mapping of CO, SO2 and HDO on the night side of Venus , EGU General Assembly 2026, Vienna, Austria, 3–8 May 2026, EGU26-22816, https://doi.org/10.5194/egusphere-egu26-22816, 2026.

EGU26-23072 | ECS | Posters virtual | VPS27

A data-driven approach to multi-ring basin identification on Mercury 

Antonio Sepe, Luigi Ferranti, Valentina Galluzzi, Gene W. Schmidt, and Pasquale Palumbo

Multi-ring impact basins represent some of the oldest and most degraded large-scale structures on terrestrial planetary bodies, making their identification and characterization particularly challenging. Only a few well-preserved examples are known, such as the Orientale basin on the Moon, commonly regarded as the archetype of multi-ring basins. On Mercury, several multi-ring basins were initially proposed based on Mariner 10 imagery (Spudis & Guest, 1988); however, most of these candidates were not confirmed by subsequent analyses using MESSENGER data (e.g., Fassett et al., 2012; Orgel et al., 2020), highlighting the difficulty of recognizing ancient, highly modified basin architectures. Here we present a semi-automatic workflow aimed at the systematic characterization of multi-ring basins on Mercury. The workflow combines manual structural mapping with quantitative, data-driven analyses and consists of four main steps: (1) construction of a structural map of tectonic features; (2) determination of the basin center using concentric deviation analysis (Karagoz et al., 2024); (3) estimation of the multi-ring geometry through a newly developed tool that analyzes the radial distribution of mapped structures using one-dimensional kernel density estimation (KDE). In this step, dominant concentric rings are identified as statistically robust density maxima obtained with a Gaussian kernel and an objectively defined Silverman bandwidth, while ring uncertainty is quantified through the interquartile range (IQR) of associated structures; and (4) comparison of the inferred ring geometry with the basin’s median radial topographic profile, derived from 360 azimuthally distributed radial profiles, to assess geometric and morphological consistency. We apply this workflow to two basins of different confidence levels. For the Orientale basin on the Moon, the method identifies three concentric rings corresponding to the Inner Rook Ring, Outer Rook Ring, and Cordillera Ring, consistent with previous studies (Spudis et al., 2013). For the Andal–Coleridge basin on Mercury, a probable multi-ring basin, the workflow retrieves a four-ring geometry that broadly coincides with rings II–V proposed by Spudis & Guest (1988). These results demonstrate that the combined use of structural mapping, KDE-based ring detection, and radial profile analysis provides a robust and reproducible framework for investigating degraded multi-ring basins. Future work will apply this workflow to additional candidate basins on Mercury to reassess their multi-ring nature and improve constraints on the planet’s early impact and tectonic history.

Acknowledgements: We gratefully acknowledge funding from the Italian Space Agency (ASI) under ASI-INAF agreement 2024-18-HH.0.

How to cite: Sepe, A., Ferranti, L., Galluzzi, V., Schmidt, G. W., and Palumbo, P.: A data-driven approach to multi-ring basin identification on Mercury, EGU General Assembly 2026, Vienna, Austria, 3–8 May 2026, EGU26-23072, https://doi.org/10.5194/egusphere-egu26-23072, 2026.

Ion-scale waves are typically characterized by frequencies near the proton cyclotron frequency, quasi-monochromaticity, propagating quasi-parallel or antiparallel to the background magnetic field, and left-handed or right-handed circular polarization in the spacecraft frame. In collisionless solar wind, one of the major mechanisms determining ion energization and non-thermal ions' energy release is wave–particle interactions of ion-scale waves. Recently, PSP's observations within 0.3 au suggest that there are plenty of ion-scale waves, which are closely related to non-thermal ions. Meanwhile, ion-scale waves (especially for Alfven/ion cyclotron waves) can be the energy source for energizing ions through wave-particle interactions. Therefore, ion-scale waves could be very important medium for ion energization and non-thermal ions' energy release in the mear-Sun solar wind.

How to cite: Liu, W.: An important medium for ion energization and non-thermal ions' energy release in the near-Sun solar wind: ion-scale waves , EGU General Assembly 2026, Vienna, Austria, 3–8 May 2026, EGU26-266, https://doi.org/10.5194/egusphere-egu26-266, 2026.

EGU26-4233 | Posters virtual | VPS28

Effects of solar transients observed in the VLISM  

William Kurth, Allison Jaynes, Federico Fraternale, Tae Kim, and Nikolai Pogorelov

The plasma wave instruments on both Voyager spacecraft have observed electron plasma oscillations in the very local interstellar medium (VLISM).  The generally accepted explanation of these events is that the electron foreshock of shocks in the VLISM comprise electron beams in the range of 10 to 100 eV that are unstable to Langmuir waves, or electron plasma oscillations.  Further, at least some of these events have been tied to solar transients departing the Sun more than a year earlier that evolve as they propagate outward.  These disturbances are led by shocks and the impulse of these on the heliospause results in some of the shock impulse continuing into the VLISM.  Previously, Voyager 1 had detected the most distant evidence of these transients at about 145 AU.  In August 2025 Voyager 2 detected electron plasma oscillations near 140 AU. A simple model of the propagation of this disturbance suggests a transient from the Sun in 2022 as its source, near the beginning of the current solar maximum.  New Horizons observed a series of shocks in 2022 – 2023 at heliocentric distances near 55 AU that could be related to the Voyager 2 event. Given these events occur early in solar cycle 25, it is possible additional shocks will be detected by Voyager and enable us to extend the distance over which these disturbances can travel in the VLISM.

We further relate some of the transients observed by the Voyager plasma wave instruments to global models of the VLISM density and magnetic field (Fraternale et al., 2026).  For example, these models show the increased density and magnetic field associated with the so-called pf2 (pressure front 2) described by Burlaga et al. (2021).  We can now show that the 2-3 kHz radio emissions observed by the Voyagers in the early 1980’s, 1990’s, and 2000’s are related to density structures just beyond the heliopause presumed to be associated with global merged interaction regions stemming from very active solar conditions.

How to cite: Kurth, W., Jaynes, A., Fraternale, F., Kim, T., and Pogorelov, N.: Effects of solar transients observed in the VLISM , EGU General Assembly 2026, Vienna, Austria, 3–8 May 2026, EGU26-4233, https://doi.org/10.5194/egusphere-egu26-4233, 2026.

EGU26-14528 | ECS | Posters virtual | VPS28

Biotic Factors in Long-Term Planetary Habitability 

Joseph Evans, Manasvi Lingam, and Jeremy Riousset

The probability of long-term survival of putative life on exoplanets has direct implications for the prevalence of extant life elsewhere.  Environmental stability can be greatly attributed to abiotic features of a planetary body. However, we know that Earth’s current state is largely the result of life. Untangling biotic and abiotic influence, though, from Earth's deep history is difficult. To study these phenomena, we turn to computer simulation.  We utilize, modify, and, in some cases, combine Planets Model Code (Tyrrell 2020), Tangled Nature Model (Christensen et al. 2002), and Daisy World (Watson & Lovelock 1983) to conduct a series of computer experiments.  First, we modify and utilize Planets Model Code (Tyrrell 2020) to investigate worlds that harbor passive biota, which can only affect the environment in a random and unchanging manner over time. In this model, findings from a moderate sample study suggest that the probability of survival ( ps ) of life grows considerably with the increase in life's viable temperature range ( ΔT ) and follows the power law: ps ΔT 4. Also, we find that the chances of survival of any life on a given planet decrease linearly with time.  Finally, we discern that the chances of survival of eukaryotic analogues remain low regardless of their emergence time in a planet's history. We complement these findings with two additional studies. Our current endeavor is to create a new model that adds an active set of evolving and competing species which can affect temperature only on a local scale and temporary basis. To build this adaptive ecology simulation, we modify and merge Planets Model Code (Tyrrell 2020) and Tangled Nature Model (Christensen et al. 2002). Planets Model Code (Tyrrell 2020) is utilized to simulate the climactic characteristics of the exoplanet.  Tangled Nature Model (Christensen et al. 2002), which is utilized to run the ecological evolutionary model, operates in the form as modified by Arthur and Nicholson (2023), but with a few additional modifications of our own.  Findings from this effort are soon forthcoming.  Finally, we comment on plans for a future study, in which we propose a separate model wherein an active ecosystem is the dominant driving force in the stability, or lack thereof, of its home planet.  By assessing ps in these limiting cases, we seek to understand if life can be a driver of planetary environmental stability.  

References: 

Arthur, Rudy and Arwen Nicholson (2023). “A Gaian Habitable Zone”. In: Monthly Notices of the Royal Astronomical Society 521.1. Publisher: Oxford University Press, pp. 690–707.

Christensen, Kim et al. (2002). “Tangled Nature: a Model of Evolutionary Ecology”. In: Journal of Theoretical Biology 216.1. Publisher: Elsevier, pp. 73–84.

Tyrrell, Toby (Oct. 2020). Planets Model code. DOI: 10.5281/zenodo.4081451.

Watson, Andrew J. and James E. Lovelock (Jan. 1983). “Biological Homeostasis of the Global Environment: the Parable of Daisyworld”. In: Tellus B: Chemical and Physical Meteorology 35.4, p. 284. ISSN: 1600-0889, 0280-6509.

How to cite: Evans, J., Lingam, M., and Riousset, J.: Biotic Factors in Long-Term Planetary Habitability, EGU General Assembly 2026, Vienna, Austria, 3–8 May 2026, EGU26-14528, https://doi.org/10.5194/egusphere-egu26-14528, 2026.

EGU26-14985 | ECS | Posters virtual | VPS28

A rapid route for even big planets to get big moons 

Jacob Kegerreis, Vincent Eke, Thomas Sandnes, and Harrison Davies

Earth’s Moon is really big. Both the satellite and the giant impact that created it have played key roles in our planet’s evolution into a life-supporting world; stabilising the planet’s spin for a consistent climate, and driving the ocean tides that could stimulate prebiotic chemistry. Giant impacts are common across planet formation. So, as observational techniques improve, we might expect to find large moons among the now thousands of detected exoplanets, many of which are more massive than Earth. A barrier to this is that giant impacts onto larger planets create hotter debris disks of mostly vapour, especially for ice-rich worlds. This gas would drag any small growing moonlets to rapidly spiral down to the planet, prohibiting any large moons from forming out of the disk.

However, using high-resolution 3D smoothed particle hydrodynamics (SPH) simulations of giant impacts, we find that big moons can be immediately placed onto wide orbits, safely outside the thick, dragging disk. This could allow large rocky and even large icy worlds to gain a big moon.

This impact scenario had previously been demonstrated as an option for forming Earth’s Moon, for a limited range of tested parameters. Here we identify multiple regions of parameter space across which large immediate satellites can form (of order 1% the mass of the planet), for target planets ranging from 0.5 to 10 Earth masses, inclusive. We also confirm consistent results using the new SPH scheme REMIX, designed to improve the treatment of mixing and discontinuities in impact simulations. Furthermore, the rate of increase of the vapour mass-fraction with the system mass depends on the impact scenario, such that the post-impact disks of even the largest of these planets may not be fully vaporised.

Large moons may still be uncommon in general, but giant impacts offer a pathway for Super-Earths and even mini-Neptunes to gain fractionally massive satellites and the potential benefits of one for life.

How to cite: Kegerreis, J., Eke, V., Sandnes, T., and Davies, H.: A rapid route for even big planets to get big moons, EGU General Assembly 2026, Vienna, Austria, 3–8 May 2026, EGU26-14985, https://doi.org/10.5194/egusphere-egu26-14985, 2026.

EGU26-15149 | ECS | Posters virtual | VPS28

Magnetosphere response to a spatially non-uniform solar wind stream 

Simone Di Matteo, Dario Recchiuti, and Umberto Villante

Interpreting the response of the magnetosphere to solar wind driving is being historically limited by the sparse measurements of upstream conditions. Recent investigations, using multiple upstream monitors, revealed that properties of the solar wind are often non uniform on spatial scales comparable to the size of the Earth’s magnetosphere. This aspect remarks the limitation of the common assumption of the impact of a uniform solar wind front based on single probe observations. Here, we perform a critical investigation of a case study in which a particular solar wind mesoscale structure, in the form of a periodic density structure (PDS), shows coherence on a limited extent of the Earth’s upstream region. First, we examine the possible reasons behind discrepancies in the measurements among different solar wind monitors. Then, we discuss the response of the magnetosphere in terms of Ultra-Low-Frequency (ULF) waves based on properties of the solar wind driver including the periodicities of the PDSs, the extent of their spatial coherence, and the associated interplanetary magnetic field properties.

How to cite: Di Matteo, S., Recchiuti, D., and Villante, U.: Magnetosphere response to a spatially non-uniform solar wind stream, EGU General Assembly 2026, Vienna, Austria, 3–8 May 2026, EGU26-15149, https://doi.org/10.5194/egusphere-egu26-15149, 2026.

EGU26-15364 | Posters virtual | VPS28

Status of MEGA-H: An Ultra-Wide-Field Camera for Heliophysics Applications 

Joshua Eskin, Amir Caspi, Craig DeForest, Phil Oakley, Briana Brown, Tim Finch, John Frye, Jackson Lage, Jai Sharma, Ryan Speck, Peter Spuhler, and Rachel Turner

MEGA-H is a multi-detector, wide-field telescope system that produces ultra-high-resolution, seamless images.  The optical path employs pickoff mirrors that partition the image field onto three individual detectors.  The detectors can be located conveniently apart from each other while preserving the whole FOV and producing a recombined image without any gaps. This architecture enables a scientist to choose the best detector for the task, which may have the good detection properties but insufficient number of pixels, and combine multiple detectors to achieve the desired pixel count. This camera system will initially be mounted behind a wide FOV white light imager and be capable of both wide FOV (10 degrees on diagonal) and high instantaneous field of view (iFOV) (<1.5”) to observe the Sun’s corona.

We describe our progress in assembling and testing the instrument, which is built around COTS telescope optics and camera heads.  Alignment features facilitate fine positioning of the two pickoff mirrors and three camera heads.  Stray light control features prevent ‘sneak path’ rays from falling on the wrong detector. The instrument is designed to work in an airborne environment.  A thermal control subsystem incorporates four thermal zones, to maintain tight focus and alignment under dynamic environmental conditions, while a focus mechanism compensates for large changes in temperature.  The data path is sized to store full-resolution data from three 127 Mpixel cameras, at a rate of 10 GB/s. A real time viewer produces fused images from the three cameras for monitoring of the image acquisition process. 

MEGA-H is sponsored by HESTO,  NASA’s Heliophysics Science and Technology Office.

How to cite: Eskin, J., Caspi, A., DeForest, C., Oakley, P., Brown, B., Finch, T., Frye, J., Lage, J., Sharma, J., Speck, R., Spuhler, P., and Turner, R.: Status of MEGA-H: An Ultra-Wide-Field Camera for Heliophysics Applications, EGU General Assembly 2026, Vienna, Austria, 3–8 May 2026, EGU26-15364, https://doi.org/10.5194/egusphere-egu26-15364, 2026.

EGU26-21494 | ECS | Posters virtual | VPS28

Molecular and Crystalline Structures in a Highly Irradiated Protoplanetary Disk in NGC 6357 

María Alejandra Lemus Nemocon, María Claudia Ramírez-Tannus, and Mario Armando Higuera Garzón

Understanding star and planet formation in extreme environments is crucial for uncovering the origins of our solar system. While most knowledge comes from nearby, isolated regions such as Taurus and Lupus, over half of all stars and planetary systems form in environments exposed to strong far-ultraviolet (FUV) radiation emitted by massive OB stars, with energies below the Lyman limit (E <13.6 eV).

NGC 6357—a young (~1–1.6 Myr), massive star-forming complex located 1690 pc away and hosting over 20 O-type stars—provides a unique opportunity to study the effects of FUV radiation on protoplanetary disks. This is the focus of the XUE (eXtreme UV Environments) collaboration.

Here, we present results from XUE2, a disk in the Pismis 24 cluster, based on spectra from JWST/MIRI and VLT/FORS2, complemented by photometric data. We first characterize the central star through spectrophotometric fitting, a fundamental step since protoplanetary disks are shaped by their host stars.

To evaluate the potential for rocky planet formation, we conduct a molecular and mineralogical analysis of the disk. We identify CO and CO₂ and report a tentative detection of CH₃⁺, key molecules for organic chemistry. Additionally, we identify predominantly amorphous silicates, as well as crystalline species such as enstatite and forsterite—molecules and minerals also observed in disks exposed to lower irradiation levels.

These findings offer new insights into the composition of inner disk regions under strong FUV irradiation, helping to constrain the formation conditions of rocky planets in massive clusters—an essential contribution to understanding the origins of the diverse exoplanets observed today.

How to cite: Lemus Nemocon, M. A., Ramírez-Tannus, M. C., and Higuera Garzón, M. A.: Molecular and Crystalline Structures in a Highly Irradiated Protoplanetary Disk in NGC 6357, EGU General Assembly 2026, Vienna, Austria, 3–8 May 2026, EGU26-21494, https://doi.org/10.5194/egusphere-egu26-21494, 2026.

Stable isotopes of oxygen and hydrogen are a powerful multipurpose tool widely used across multiple disciplines in Earth and Planetary sciences. In hydrology, δ18O and δ2H in the water molecule are commonly used in stream water source apportionment and transit time analyses. In paleoclimate research, ice core water isotope records are used as a temperature proxy, documenting past climate variability over hundreds of thousands of years. Oxygen and hydrogen isotopes are also versatile fingerprints for retracing the formation of planets and other celestial bodies.

These examples should not obscure the fact that many unknowns and uncertainties remain inherent to the use of stable isotopes of O and H as tracers and fingerprints of processes in terrestrial and extra-terrestrial environments. To this date, only a few experimental studies have investigated water ice sublimation rates and the effect of isotopic fractionation processes – notably on water ice under lunar environmental conditions.

Here we present results from a combined experimental and modelling approach. With an instrumental set-up developed at LIST, we simulate the sublimation of water ice under extreme environmental conditions (very high vacuum and/or very low temperatures) with the goal of exploring O-H isotopic fractionation processes in both (extreme) terrestrial and extraterrestrial environments. An understanding of these processes is necessary for interpreting the isotope signatures of water in planetary exploration missions, such as ESA’s PROSPECT project for lunar exploration, and in terrestrial hydrology of cold regions.

The current experimental setup consists of a sublimation chamber capable of operating at pressures down to 10⁻⁶ Pa and temperatures as low as 110 K, with high stability and control over sublimation conditions. The system can simulate controlled environments for the phase transition of water (ice-vapor), isotopic fractionation, and the movement of water vapor across different phases of the experimental run. This includes transferring gas to a series of parallel cold traps, analyzing isotopic content using laser spectroscopy.

We have developed a stochastic lagrangian numerical model to verify the existing theories of phase transition, diffusion, and O-H isotopic fractionation based on the Langevin equation. The model allows for sublimation, diffusive transport, and condensation of water and its isotopes through an isothermal domain representing the volume of the experimental prototype. Lagrangian models are highly adaptive for handling complex boundary conditions and well-suited for solving fluid mechanics problems with various types of particles.

A sensitivity analysis of the model using different sublimation temperatures shows consistent results with our experimental data. Results obtained from the dual isotope analysis (δ¹⁸O and δ²H) of ice samples obtained from Greenland Summit Precipitation (GRESP) and Antarctica snow show trends consistent with theoretical predictions and meteoric water line, suggesting that the setup is operating reliably. Observed deviations in the isotopic compositions indicate influences from environmental variables such as humidity, pointing towards the need for tighter control and validation. Our experimental set-up lays a foundation for further investigations into the problems of fast diffusion, non-equilibrium thermodynamics, and the isotopic signature of water.

How to cite: Kumawat, M., Barnich, F., Pfister, L., Zehe, E., and Hadler, K.: Water ice sublimation and O-H isotopic fractionation in terrestrial and extraterrestrial environments: new insights gained from numerical modelling and laboratory experiments, EGU General Assembly 2026, Vienna, Austria, 3–8 May 2026, EGU26-23186, https://doi.org/10.5194/egusphere-egu26-23186, 2026.

In the Chundi–Malakonda–Ayyavaripalle region of the Nellore Schist Belt, part of the Dharwar Craton, six north-south (N–S) trending, elongated Banded Magnetite Quartzite (BMQ) bands have been identified. These bands are exposed within meta-rhyolite and quartzite formations and are associated with biotite–muscovite schist. The BMQs vary in width from 20 to 40 meters and extend in length from 1.5 to 4.5 kilometres. ​ High-resolution aeromagnetic surveys with a terrain clearance of 80 meters have revealed significant magnetic anomalies over the study area (source: https://geodataindia.gov.in). These anomalies range from –3,900 to +5,000 nanoteslas (nT), indicating a high concentration of magnetic minerals within the exposed BMQs, designated as Bands 1 to 6. In addition to these exposed bands, a concealed, parallel, N–S trending BMQ band has been identified through detailed analysis of aeromagnetic data. 2D and 3D Interpretation of the magnetic anomalies suggests that meta-rhyolites exist up to an average depth of 250 m from the surface and might be associated with BIF bands at depth. This depth extent highlights the substantial vertical continuity of the magnetite-rich formations in the region. The integration of geological mapping and aeromagnetic data provides a comprehensive understanding of subsurface geology, highlighting the potential for significant mineralization within the Nellore Schist Belt.

How to cite: Dharavathu, S., Kosuri, S. K., Vappangi, P. K., and Kumar, P.: Unveiling concealed Banded Magnetite Quartzites (BMQs) through high-resolution aeromagnetic surveys: New insights from the Nellore Schist belt of Eastern Dharwar Craton, India, EGU General Assembly 2026, Vienna, Austria, 3–8 May 2026, EGU26-2063, https://doi.org/10.5194/egusphere-egu26-2063, 2026.

Within the comprehensive framework of the Sun–Earth system, plasma environments exhibit an exceptionally wide range of physical conditions. These encompass the ultra-high-temperature, high-pressure, and high-density liquid metallic outer core of Earth, which generates the geomagnetic field through the geodynamo process; the tenuous, partially ionized ionosphere; and the magnetosphere, which provides essential shielding against energetic cosmic and solar radiation while exerting substantial influence on human technological systems, most notably microwave communication infrastructure. In addition, transient ultra-high-temperature plasmas generated by solar flares and coronal mass ejections (CMEs) represent the primary drivers of disturbed space electromagnetic environments, as they propagate through interplanetary space and subsequently interact with Earth's magnetosphere.Although prior research has extensively employed the first-principles quantum Monte Carlo method coupled with the lattice Boltzmann approach (FPQM-LBM) to address various theoretical and computational aspects of plasma behavior in this context, no existing modeling framework has successfully integrated — within a single consistent methodology — the extreme conditions of the Earth's outer core plasma, the low-density ionospheric plasma, the magnetospheric plasma, and the highly energetic, transient flare/CME plasmas. As a result, a unified and comprehensive understanding of particle transport mechanisms and internal structural properties across the full spectrum of plasma regimes in the Sun–Earth system remains elusive.The present study aims to address this critical gap by developing novel theoretical frameworks and advanced computational methodologies for elucidating the particle migration mechanisms and structural characteristics of space electromagnetic plasmas throughout the panoramic Sun–Earth system. To this end, we will enhance the first-principles quantum Monte Carlo–lattice Boltzmann method (FPQM-LBM) to establish robust techniques capable of modeling particle transport under the complex electromagnetic conditions prevailing in space environments. The improved FPQM-LBM framework will be systematically applied to simulate particle dynamics across the aforementioned plasma regimes — namely, the ultra-high-temperature/pressure/density outer core plasma, the low-density ionosphere, the magnetosphere, and transient flare/CME plasmas — with particular emphasis on ionic characteristics, microstructural evolution, fine-scale particle transport processes, internal structural transformations, and the response of plasma properties to external electromagnetic perturbations. The anticipated results are expected to furnish a solid theoretical foundation and valuable predictive capabilities for advancing solar–terrestrial space physics and enhancing electromagnetic monitoring and forecasting in space weather research.

How to cite: Zhu, B.: Theoretical Foundations and Methodological Developments in the Study of Particle Transport Mechanisms and Microstructural Evolution Employing the Hybrid Quantum Monte Carlo–Boltzmann Transport Model, EGU General Assembly 2026, Vienna, Austria, 3–8 May 2026, EGU26-3254, https://doi.org/10.5194/egusphere-egu26-3254, 2026.

EGU26-5611 | Posters virtual | VPS29

Improving GIC modelling and validation with high-quality information on power network parameters 

Ciaran Beggan, Gemma Richardson, and Ewelina Lawrence

Space weather can affect the operation of high voltage AC transformers in power grids by applying an offset DC current during periods of heightened geomagnetic activity. Modelling GIC requires knowledge of magnetic field variation, the response of the local subsurface geoelectric field (related to conductivity) and a representation of the connections between transformers and various resistance parameters of the power network. Presently, in Britain, the largest uncertainty in this chain applies to the resistance parameters of the network, as these values come from open-source data which are known to have many approximations.

Recent work with a transmission network operator in the UK has provided us with an improved dataset of resistance parameters of transformers, power lines and substation grounding. The grounding resistance at electrical substations has not been known before and so historically was set at 0.5 Ω in our models. The new dataset of 110 sites around central Scotland reveals substation grounding resistance varies from 0.04 Ω to 11.7 Ω with a mean of 0.54 Ω but a median of 0.2 Ω. Combined with line and transformer resistance information, we have created an improved representation of the power grid in Scotland.

Using GIC measurements from three sites (Torness, Strathaven and Neilston) for the largest geomagnetic storms in the past 25 years (October 2003, September 2017 and May 2024), we are able to validate the new model, demonstrating its improved accuracy.

The new model demonstrates that our previous assumptions of grounding resistance were too high but our estimate of line resistance was too low, thus balancing out the overall GIC magnitude on average. However, in detail, some locations show large differences in GIC compared to the original model. This highlights the importance of using accurate resistance information to correctly capture GIC.

How to cite: Beggan, C., Richardson, G., and Lawrence, E.: Improving GIC modelling and validation with high-quality information on power network parameters, EGU General Assembly 2026, Vienna, Austria, 3–8 May 2026, EGU26-5611, https://doi.org/10.5194/egusphere-egu26-5611, 2026.

During intense solar atmospheric activity—such as major solar flares and geomagnetic storms—magnetic energy is converted into plasma kinetic and thermal energy through three-dimensional turbulent magnetic reconnection within large-scale, extended current sheets. This process releases enormous amounts of stored energy, often accompanied by the rapid ejection of high-energy particles into interplanetary space. These high-energy particles include electrons, protons, helium nuclei, and heavier ions, forming a complex multi-component, multi-abundance, and multi-isotopic population. Their energies span from ~100 keV to ~100 MeV and even into the GeV range, making them a primary driver of space weather hazards. Understanding the sources and acceleration mechanisms of these particles remains one of the most critical challenges in space weather research. Previous studies have shown that high-energy particle acceleration is highly complex, involving multiple species, a variety of mechanisms, and interactions across scales. It remains an open and challenging problem in solar and plasma physics. This paper provides a systematic review and forward-looking perspective on recent advances in high-energy particle acceleration during the fine-scale evolution of large-scale current sheets. The discussion is organized around three key pillars: theory, observations, and numerical simulations. First, we summarize the turbulence-fractal model as it applies to typical solar atmospheric events. We focus on acceleration mechanisms in turbulent magnetic reconnection within large spatiotemporal current sheets, with particular emphasis on: Turbulent (second-order) Fermi acceleration, Turbulent shock acceleration, and Turbulent wave-particle resonant acceleration. These mechanisms operate synergistically in the turbulent environment generated by reconnection, enabling efficient energy transfer to particles. Second, we review recent progress in coupling macroscopic (hydrodynamic and magnetohydrodynamic) dynamics to microscopic kinetic processes in high-energy particle acceleration. This includes multi-scale modeling of turbulence, reconnection, and particle transport. Finally, we outline promising future research directions, including improved multi-spacecraft observations, higher-resolution simulations that incorporate kinetic effects, and integrated models that bridge MHD turbulence and particle-in-cell approaches. We also highlight several urgent unresolved issues, such as the relative contributions of different mechanisms across energy regimes, the role of fractal structures in particle trapping and escape, and the origin of observed abundance enhancements in heavy ions. This review synthesizes recent theoretical, observational, and computational developments to provide a comprehensive framework for understanding high-energy particle acceleration in large-scale turbulent current sheets, with implications for solar flares, space weather forecasting, and broader astrophysical plasma processes.

How to cite: Zhu, B.: Research Progress on SEPs on the Fine Structures of the Large Temporal-spatial Current Sheets in Solar Flares/CMEs, EGU General Assembly 2026, Vienna, Austria, 3–8 May 2026, EGU26-6969, https://doi.org/10.5194/egusphere-egu26-6969, 2026.

EGU26-8141 | ECS | Posters virtual | VPS29

A Late Holocene Paleomagnetic Record from Lago del Desierto, Southern Patagonia (Argentina) 

Romina Valeria Achaga, Claudia Susana Gabriela Gogorza, Maria Alicia Irurzun, Christian Ohlendorf, Torsten Haberzettl, and Bernd Zolitschka

Lago del Desierto (49°02′S, 72°51′W) is located in a climatically sensitive sector near the Southern Patagonian Ice Field (Argentina). Three sediment cores collected from two sites in the lake were analyzed using a multi-proxy approach to reconstruct past environmental variability (Kastner et al., 2010). Numerous turbidites were identified in the sedimentological record. After excluding these event layers, a new age–depth model was developed for the first 3 sections of the core DES05-3 (289 cm), and paleosecular variations (PSV) were reconstructed for the interval between ~1000 and 3500 cal. BP.

Standard paleomagnetic measurements (alternating-field demagnetization) were performed on 125 samples from the same core. In addition, rock-magnetic measurements, including Anhysteretic Remanent Magnetization (ARM, 100 mT peak AF, 0.05 mT DC field), Isothermal Remanent Magnetization (IRM, acquisition up to 1.5 T and backfield curves), hysteresis loops and thermomagnetic analyses, were applied to extract complementary paleoenvironmental information from the sediment cores.

Rock-magnetic measurements indicate that the magnetic mineralogy is dominated by a low-coercivity component (magnetite-type), accompanied by a secondary high-coercivity fraction (hematite/goethite-type). This downcore distribution mirrors the paleoenvironmental shift described by Kastner et al. (2010): the lower part of the sequence shows an enhanced contribution of high-coercivity Fe oxides, consistent with more stable and chemically weathered catchment conditions. In contrast, the upper part shows an increasing dominance of detrital magnetite, indicating strengthened minerogenic supply and enhanced erosion, matching the onset of warmer conditions and glacier retreat during the Medieval Climate Anomaly as inferred from geochemical and lithological proxies. This agreement between magnetic and non-magnetic sediment parameters suggests coherent changes in the provenience of the sediment and in catchment dynamics over the last millennia. As expected from the catchment instability and the numerous turbidites in the upper part of the sequence, this interval could not be used for PSV reconstruction due to its discontinuous directional record. In contrast, samples from the lower part (~1000–3500 cal. BP) provided a continuous sequence suitable for paleosecular variation analysis. Although samples from this unit were not completely demagnetized at 100 mT, due to the presence of a high-coercivity component, magnetization directions consistently decayed toward the origin with high precision. Characteristic remanent magnetization (ChRM) directions were determined using principal component analysis, with maximum angular deviation (MAD) values below 2.5° for all non-turbidite samples. The resulting PSV record compares well with geomagnetic field models and other Patagonian paleomagnetic reconstructions. Inclination values range from −40° to −70°, displaying coherent directional variability over the last ~3500 years.

References:
Kastner, S., Enters, D., Ohlendorf, C., Haberzettl, T., Kuhn, G., Lücke, A., Mayr, C., Reyss, J.-L., Wastegård, S., & Zolitschka, B. (2010). Reconstructing 2000   years of hydrological variation derived from laminated proglacial sediments of Lago del Desierto at the eastern margin of the South Patagonian Ice Field, Argentina. Global and Planetary Change, 72(3), 201-214. https://doi.org/10.1016/j.gloplacha.2010.04.007

How to cite: Achaga, R. V., Gogorza, C. S. G., Irurzun, M. A., Ohlendorf, C., Haberzettl, T., and Zolitschka, B.: A Late Holocene Paleomagnetic Record from Lago del Desierto, Southern Patagonia (Argentina), EGU General Assembly 2026, Vienna, Austria, 3–8 May 2026, EGU26-8141, https://doi.org/10.5194/egusphere-egu26-8141, 2026.

EGU26-8566 | Posters virtual | VPS29

Pc3 geomagnetic pulsations excited by earthquakes and their commonality with solar wind-originated Pc3 

Toshihiko Iyemori, Tadashi Aoyama, and Yoshihiro Yokoyama

The source of compressional Pc3 magnetic pulsations has been considered to be the plasma process in the solar wind or in the magnetosphere. However, we found some strong inland earthquakes that occur on the dayside also excite Pc3s. The Lamb waves generated by the January 2022 Tongan undersea volcanic eruption are also believed to have excited large amplitude and short period compressional Pc3 geomagnetic pulsations in the dayside plasmasphere (Iyemori et al., 2025). Increases in power spectral density (PSD) in the Pc3 frequency band were observed 10-30 minutes after the origin time of large inland earthquakes (M>6.5) during the daytime (10-14 LT). During these large earthquakes, seismic waves with period of 10-30 seconds propagate far away (even more than several thousand km), causing slight fluctuations in the orientation of magnetometer sensors, resulting in apparent Pc3-like fluctuations. To avoid such sensor tremor effect, we analyzed the total force of magnetic field, or analyzed comparing with seismometer data. We also used the Swarm satellite observation. The PSD of Pc3s caused by earthquakes or by Lamb wave show many spectral peaks having interval of 3-5 mHz, and this is similar with the characteristic reported by, for example, Samson et al. (1995) for normal, i.e., solar wind origin Pc3s. In this paper, we will also show the commonality between the Pc3s caused by earthquakes or Lamb waves and those originated from the solar wind and discuss what the commonality means.

How to cite: Iyemori, T., Aoyama, T., and Yokoyama, Y.: Pc3 geomagnetic pulsations excited by earthquakes and their commonality with solar wind-originated Pc3, EGU General Assembly 2026, Vienna, Austria, 3–8 May 2026, EGU26-8566, https://doi.org/10.5194/egusphere-egu26-8566, 2026.

EGU26-8852 | Posters virtual | VPS29

High-resolution magnetic record of environmental changes during Middle – Late Pleistocene from a loess-palaeosol sequence in NE Bulgaria – pilot data from the LOEs-CLIMBE project 

Diana Jordanova, Bozhurka Georgieva – Ishlyamska, Daniel Veres, Yunus Baykal, Marius Robu, Neli Jordanova, Ulrich Hambach, Daniel Ishlyamski, Dimo Dimov, Andrew Trott, and Guido Wiesenberg

Continental sedimentary sequences of alternating loess and palaeosol horizons preserve detailed records of past global climate changes during the Pleistocene. Obtaining deeper and genuine knowledge on the history of past climates using proxy data depends on interdisciplinary approaches, novel techniques and thinking “out-of-the-box”. The LOEs-CLIMBE team members gather around this concept and present here the first pilot magnetic data from the Kolobar loess-palaeosol section in NE Bulgaria. The 25 m thick section is exposed in an active quarry and was sampled at 2-cm-resolution, covering the Holocene soil, seven palaeosol units and loess horizons L1 to L7 of varying thicknesses. New high resolution magnetic susceptibility data, delineates palaeosol horizons with high values of mass specific magnetic susceptibility except the special case of fourth palaeosol S4, showing no magnetic enhancement as compared to the underlying thin loess. Such depletion of pedogenic magnetic enhancement in paleosol units from the Lower Danube area is rarely reported. This phenomenon will be further examined by detailed magnetic and colorimetric methods. The strongest pedogenic magnetic signal is observed in the three youngest palaeosol units S1, S2 and S3, tentatively related to the interglacial stages MIS 5, MIS 7 and MIS 9. The weakest magnetic susceptibility is typical for the younger part of the loess unit L2, punctuated by the signal of a tephra layer, which is a widespread chronostratigraphic marker in the region.  This research is carried out and financed within the framework of the second Swiss Contribution MAPS, LOEs-CLIMBE project № IZ11Z0_230102.

How to cite: Jordanova, D., Georgieva – Ishlyamska, B., Veres, D., Baykal, Y., Robu, M., Jordanova, N., Hambach, U., Ishlyamski, D., Dimov, D., Trott, A., and Wiesenberg, G.: High-resolution magnetic record of environmental changes during Middle – Late Pleistocene from a loess-palaeosol sequence in NE Bulgaria – pilot data from the LOEs-CLIMBE project, EGU General Assembly 2026, Vienna, Austria, 3–8 May 2026, EGU26-8852, https://doi.org/10.5194/egusphere-egu26-8852, 2026.

EGU26-9301 | ECS | Posters virtual | VPS29

The influence of the heterogeneity (stratification) of the outer core fluid on the variation of the geomagnetic field 

Shichao Wang, Yongbing Li, Bojing Zhu, Yang Zhao, Qian Wang, and Hanfen Liu

The Earth's magnetic field is divided into internal and external sources, with the internal field including the main magnetic field, the crustal magnetic field, and the induced magnetic field. Among these, the main magnetic field accounts for approximately 95% of the Earth's total magnetic field. Data from paleomagnetic records in rocks, various geomagnetic observatories, and satellites indicate that the main magnetic field exhibits westward drift, polarity reversals, intensity decay, and brief geomagnetic excursions at the core-mantle boundary. To explain these phenomena, several models have been proposed in previous studies. The prevailing view is that the outer core is composed of liquid metal, and the Earth's main magnetic field is generated by the turbulent fluid motion of this liquid metal, influenced primarily by factors such as its composition and properties, thermal convection, Lorentz force, and Coriolis force. Considering the strong Coulomb forces between electrons and ions, previous research has usually treated the electrons and ions in the outer core's metallic fluid as a unified component, greatly simplifying the study and achieving satisfactory results. However, existing studies have not taken into account the differences in motion between ions and electrons under the dynamics of the outer core, the resulting spatial distribution differences of electrons and ions in the outer core, or the impact of these differential distributions on the Earth's main magnetic field. In view of this, This paper studies the effect of the factors generating outer core dynamics on the distribution of electrons and ions in the outer core. It examines the distribution of electrons and ions in the outer core space under equilibrium conditions and estimates their contribution to Earth's main magnetic field. Then, by changing parameter conditions (such as temperature gradients) and adding convective terms (non-equilibrium state), the calculations are redone. These results are used to explain changes in Earth's magnetic field.

How to cite: Wang, S., Li, Y., Zhu, B., Zhao, Y., Wang, Q., and Liu, H.: The influence of the heterogeneity (stratification) of the outer core fluid on the variation of the geomagnetic field, EGU General Assembly 2026, Vienna, Austria, 3–8 May 2026, EGU26-9301, https://doi.org/10.5194/egusphere-egu26-9301, 2026.

EGU26-10911 | Posters virtual | VPS29

Mineralogical Drivers of Ground Failure in Neogene Sediments: a Case Study from Northwest Bulgaria 

Zornitsa Dotseva, Dian Vangelov, and Tsveta Stanimirova

The stability of critical infrastructure in Northwest Bulgaria (Western Moesian Platform) could be compromised by ground instability within Neogene sediments that cover the region. This is evidenced by the collapse of the I-1 national road near Dimovo town in 2006, which involved vertical displacements of 3–4 meters. The purpose of this study is to identify the underlying geological drivers of this failure and to evaluate the specific hazard in the area resulting from the interaction between the sediments and the local environmental conditions. We hypothesize that the instability is not merely a result of conventional failure mechanisms but is governed by an anomalous mineralogical composition, specifically by the presence of aragonite and gypsum layers, which could create a dual hazard.

To elucidate geological drivers, we employed a methodology that integrates field mapping and sampling with laboratory analyses. Samples from the Neogene sediments in the area of 2006 damage underwent mineralogical analyses using X-ray diffraction (XRD) and Scanning Electron Microscopy (SEM) to determine phase composition and morphology. These analyses were coupled with X-ray fluorescence (XRF) for chemical profiling and standard geotechnical testing to determine grain size distribution, Atterberg limits, and Activity index according to Skempton’s classification.

The analysis reveals a heterogeneous sediment succession with the presence of inorganic clays with high plasticity. The XRD and SEM results identified a mineralogical anomaly where the high concentrations of metastable, acicular aragonite coexist with active swelling phyllosilicates (smectite/illite). Furthermore, various amounts of gypsum were detected in some of the samples, indicating an evaporitic paleoenvironment. Geotechnically, these materials exhibit extreme reactivity. Liquid limits range from 34.85% to 67.88%, and plasticity indices reach up to 47.39%. The Activity index peaks at 2.00, categorizing the sediments as "highly active" and prone to volume change driven by moisture variations.

The study concludes that ground failure is a direct consequence of a synergistic hydro-chemo-mechanical mechanism driven by the sediments' mineralogy. The specific aragonite fabric allows rapid water infiltration, triggering the hydration of smectites that could lead to loss of shear strength. Simultaneously, gypsum dissolution could create secondary porosity, reduce effective stress, and release sulfate ions, which could pose a potential chemical hazard to concrete foundations through sulfate attack. Furthermore, the high silt content facilitates internal erosion and possible piping through fracture networks, which could explain the sudden loss of support and large vertical displacements observed in the 2006 case. These findings imply that standard geotechnical data alone are insufficient for risk assessment in this region. Effective mitigation strategies must integrate mineralogical analysis to address both the physical swelling and the chemical durability risks.

Acknowledgements: This research was funded by the European Union-NextGenerationEU, through the National Recovery and Resilience Plan of the Republic of Bulgaria, Project No BG-RRP-2.004-0008-C01.

How to cite: Dotseva, Z., Vangelov, D., and Stanimirova, T.: Mineralogical Drivers of Ground Failure in Neogene Sediments: a Case Study from Northwest Bulgaria, EGU General Assembly 2026, Vienna, Austria, 3–8 May 2026, EGU26-10911, https://doi.org/10.5194/egusphere-egu26-10911, 2026.

EGU26-14934 | ECS | Posters virtual | VPS29

Effects of the Historical Geomagnetic Field on Earth's Energetic Particle Environment: Magnetic Anomalies and Auroral Regions  

Kirolosse Girgis, Maximilian Arthus Schanner, Sanja Panovska, and Akimasa Yoshikawa

Three centuries ago, auroral emissions could be observed over the Korean sector, where the West Pacific Anomaly (WPA) coexisted with the South Atlantic Anomaly (SAA). To investigate this phenomenon, the present study builds upon our recent numerical simulations of the inner proton radiation belt [Girgis et al., JSWSC (2021), Girgis et al., SW (2023,2024)], in which we examined the effects of space weather on the near-Earth particle environment. Here, we extend our modeling framework to explore the historical distribution and state of the radiation environment. A key aspect of this research is the incorporation of a geomagnetic field configuration representative of the year 1650, and the comparison of the resulting particle environment with that derived from contemporary magnetic field models.  The primary objective is to model the near-Earth particle environment in a manner that enables future coupling with atmospheric models, while also accounting for the influence of external space weather conditions. A comprehensive understanding of both the present-day and historical particle dynamics in the near-Earth environment is essential for predicting radiation conditions relevant to low Earth orbit (LEO) missions and for assessing the potential impact on Earth’s atmosphere. 

How to cite: Girgis, K., Arthus Schanner, M., Panovska, S., and Yoshikawa, A.: Effects of the Historical Geomagnetic Field on Earth's Energetic Particle Environment: Magnetic Anomalies and Auroral Regions , EGU General Assembly 2026, Vienna, Austria, 3–8 May 2026, EGU26-14934, https://doi.org/10.5194/egusphere-egu26-14934, 2026.

EGU26-18706 | ECS | Posters virtual | VPS29

SwarmDF: A toolbox for analysing high-latitude ionospheric electrodynamics 

Margot Decotte, Karl M. Laundal, and Fasil T. Kebede

The Swarm Data Fusion (SwarmDF) toolbox is designed as an easy-to-use Python module for analysing the local electrodynamics of the high-latitude ionosphere by combining measurements from ESA’s Swarm satellites with additional ionospheric and thermospheric datasets. Given a Swarm satellite ID, a regional grid, and a time interval, the toolbox automatically retrieves and combines available observations from SuperDARN, SuperMAG, Iridium/AMPERE, and Swarm electromagnetic field measurements. SwarmDF uses the local mapping of polar ionospheric electrodynamics (Lompe) technique to reconstruct two-dimensional maps of key electrodynamic parameters in the vicinity of the Swarm satellite tracks. To assess and quantify reconstruction performance, SwarmDF integrates the LompeOSSE Python module, which generates controlled synthetic electrodynamics datasets based on Gamera simulations and enables systematic comparisons with the toolbox outputs under different data availability and configuration scenarios. Featuring a user-friendly graphical interface, SwarmDF simplifies data handling and model setup for high-latitude ionospheric electrodynamic studies using Swarm observations.

How to cite: Decotte, M., Laundal, K. M., and Kebede, F. T.: SwarmDF: A toolbox for analysing high-latitude ionospheric electrodynamics, EGU General Assembly 2026, Vienna, Austria, 3–8 May 2026, EGU26-18706, https://doi.org/10.5194/egusphere-egu26-18706, 2026.

EGU26-21147 | ECS | Posters virtual | VPS29

Dimensionality Analysis of the Iberian Pyrite Belt Lithosphere derived from the Magnetotelluric Impedance Tensor. 

Pedro Baltazar-Soares, Francisco José Martinéz-Moreno, Lourdes Gonzaléz-Castillo, Jesús Galindo-Zaldívar, Fernando Monteiro Santos, Antonio Mateus, and Luis Matias

The Iberian Pyrite Belt (IPB) hosts one of the largest concentrations of massive sulfide deposits in Europe, yet its lithosphere architecture remains incompletely understood. In this study, we employ magnetotelluric (MT) impedance tensor data to investigate the dimensionality and structural characteristics of the IPB crust. The analysis combines two complementary approaches: WAL invariants, computed from the MT impedance tensor using the Waldim code (Martí et al., 2013), which are scalar, rotation invariant quantities providing a robust, frequency dependent measure of three-dimensionality and highlighting anisotropic features in the conductivity distribution; and the Phase Tensor, following the methodology of Caldwell et al. (2004), which offers distortion free insights into the orientation and geometry of regional conductive structures. Integrating these methods enables a systematic dimensional analysis of the impedance tensor, revealing lateral heterogeneities, preferred orientations of conductive features, and depth dependent variations in lithospheric responses.

The results demonstrate that WAL invariants and Phase Tensor analysis together allow the separation of near surface distortions from deeper geoelectric structures, providing a robust framework for characterizing the lithospheric architecture of the IPB. This study highlights the enhanced resolution and robustness achieved by complementing the tensor based analysis of MT data with invariant derived quantities that provide rotationally independent measures of three-dimensionality and anisotropy.

Consequently, this dimensional and structural assessment constitutes a critical prerequisite for subsequent MT data inversion, as it provides essential constraints on model dimensionality, structural orientation, and the treatment of near surface distortion. By supporting the choice between 2D and 3D inversion strategies, the proposed framework enhances the stability of the inversion process, increases the reliability of the conductivity distributions, and ensures greater geological consistency of the resulting models.

Acknowledgment

This work is supported by FCT, I.P./MCTES through national funds (PIDDAC): LA/P/0068/2020, https://doi.org/10.54499/LA/P/0068/2020,UID/50019/2025,  https://doi.org/10.54499/UID/PRR/50019/2025, UID/PRR2/50019/2025

References

Caldwell, T.G., Bibby, H.M. and Brown, C. (2004). The magnetotelluric phase tensor. Geophysical Journal International, 158: 457-469. https://doi.org/10.1111/j.1365-246X.2004.02281.x

Castro, C., Hering, P., Junge, A. (2020). FFMT: a MATLAB-based toolbox for Magnetotellurics (MT). 10.13140/RG.2.2.12465.92007.

F. E. M. Lilley. (1998). Magnetotelluric tensor decomposition; Part, Theory for a basic procedure. Geophysics; 63 (6): 1885–1897. doi: https://doi.org/10.1190/1.1444481.

Martí, A., Queralt, P., Ledo, J., Farquharson, C. (2010). Dimensionality imprint of electrical anisotropy in magnetotelluric responses, Physics of the Earth and Planetary Interiors, Volume 182, Issues 3–4, 2010, Pages 139-151, ISSN 0031-9201. https://doi.org/10.1016/j.pepi.2010.07.007.

Martí, A., Queralt, P., Ledo, J. (2013). WALDIM: A code for the dimensionality analysis of magnetotelluric data using the rotational invariants of the magnetotelluric tensor. Computers & Geosciences. 2295-2303. 10.1016/j.cageo.2009.03.004

Miensopust, M. P. (2017). Application of 3-D electromagnetic inversion in practice: Challenges, pitfalls and solution approaches. Surveys in Geophysics, 38(5), 869–933. https://doi.org/10.1007/s10712-017-9435-1.

Vozoff, K. (1991). The magnetotelluric method: Electromagnetic methods. In M. N. Nabighian (Ed.), Applied Geophysics (pp. 641–712).

Kelbert, A., Meqbel, N., Egbert, G. D., & Tandon, K. (2014). ModEM: A modular system for inversion of electromagnetic geophysical data. Computers & Geosciences, 66, 40–53. https://doi.org/10.1016/j.cageo.2014.01.010.

How to cite: Baltazar-Soares, P., Martinéz-Moreno, F. J., Gonzaléz-Castillo, L., Galindo-Zaldívar, J., Monteiro Santos, F., Mateus, A., and Matias, L.: Dimensionality Analysis of the Iberian Pyrite Belt Lithosphere derived from the Magnetotelluric Impedance Tensor., EGU General Assembly 2026, Vienna, Austria, 3–8 May 2026, EGU26-21147, https://doi.org/10.5194/egusphere-egu26-21147, 2026.

EGU26-3508 | Posters virtual | VPS30

Subsurface structural mapping using high-resolution gravity data and advanced processing techniques in the Ouarzazate Basin, Southern Morocco. 

Brahim Bouali, Fatima-Zahra Tabayaoui, Hassan Sahbi, Ahmed Manar, Abderrahime Nouayti, Mustapha Boujamaoui, and Nour eddine Berkat

This study investigates the deep structure of the Ouarzazate Basin, located between the Central High Atlas and the Anti-Atlas, using gravity data analysis. Gravimetric methods were applied to map subsurface structural lineaments beneath the sedimentary cover. The resulting structural map reveals that the basin is mainly controlled by ENE-WSW oriented faults, with subordinate E-W and NE-SW trends related to Variscan deformation, Triassic-Jurassic rifting, and Atlas tectonic inversion. Positive gravity anomalies show preferential NE-SW and E-W orientations and are linked to the structural configuration of the Central High Atlas, which acted as a major source area for the basin. The identified fault systems and compressional structures in the Central High Atlas and Anti-Atlas are consistent with the regional geodynamic evolution. These results highlight the strong tectonic connection between the Ouarzazate Basin and adjacent Atlas basins, particularly the Central High Atlas, and provide new insights into the basin’s geodynamic development.

How to cite: Bouali, B., Tabayaoui, F.-Z., Sahbi, H., Manar, A., Nouayti, A., Boujamaoui, M., and Berkat, N. E.: Subsurface structural mapping using high-resolution gravity data and advanced processing techniques in the Ouarzazate Basin, Southern Morocco., EGU General Assembly 2026, Vienna, Austria, 3–8 May 2026, EGU26-3508, https://doi.org/10.5194/egusphere-egu26-3508, 2026.

EGU26-5809 | ECS | Posters virtual | VPS30

Rotation of tectonic blocks controlled by strike-slip component along the Zahedan fault, Iran 

Zahra Paktarmani, Andrzej Konon, and Mateusz Mikołajczak

The Zahedan fault zone in Iran constitutes an active tectonic zone characterised by a complex network of strike-slip faults that dominate the local deformation pattern. This area is located within a large-scale transpressional shear zone accommodating relative motion between the Central East Iranian block and the Afghan Helmand block. The region provides a natural laboratory for investigating the relationship between strike-slip faulting and tectonic blocks rotated around vertical axes.

We present herein, based on high-resolution 2025 Airbus satellite imagery and cartographic and geophysical data, a new strike-slip fault pattern that facilitated the development of the rotated tectonic blocks.

Our observations show that the major strike-slip fault zones are accompanied by dense networks of second-order faults, including single sets of antithetic and synthetic strike-slip faults, conjugate strike-slip fault sets, restraining and releasing stepovers, and thrust faults. In several sectors along the major faults occur the zones of deformation consisting of the rotated tectonic blocks. The scale, orientation, and spatial organisation of the mapped structures indicate that block rotation is controlled by the interaction between major strike-slip faults and subsidiary fault networks.

The individual second-order antithetic faults display that these faults commonly accommodate small displacements, but the faults play a critical role in allowing internal deformation within blocks and facilitate the progressive block rotation. The sense of movements along the major fault and the antithetic strike-slip faults bounding the tectonic blocks allows us to consider the structures as the blocks rotated around vertical axes in a domino-like orientation. Recognised examples of structures show that some rotating blocks are rigid, with no evidence of significant internal deformation, while other rotating blocks exhibit strong internal deformation.

Understanding these spectra of behaviours and the determination of the relationships between them will improve our knowledge of fault interaction processes in eastern Iran and related patterns of seismicity, and it also has implications for seismic hazard assessment in active transpressional settings.

How to cite: Paktarmani, Z., Konon, A., and Mikołajczak, M.: Rotation of tectonic blocks controlled by strike-slip component along the Zahedan fault, Iran, EGU General Assembly 2026, Vienna, Austria, 3–8 May 2026, EGU26-5809, https://doi.org/10.5194/egusphere-egu26-5809, 2026.

Charnockite is generally regarded as a product of high-temperature melting; however, its specific origin, generation, and preservation mechanisms, as well as its relationship to high-grade metamorphism or deep crustal reworking, remain poorly constrained. During the early Paleozoic, the South China Block underwent intense orogeny that resulted in significant crustal shortening and thickening, subsequently inducing widespread anatexis and extensive S-type granites. This study identifies ~431 Ma charnockites containing granulitic enclaves that were exposed in the Yunkai massif, providing key insights into the early Paleozoic crustal reworking and deep crustal melting behaviors in South China. The body displays A-type characteristics with crustal reworking zircon isotopic features (δ18O = 8.0–9.8 ‰; εHf(t) = - 11.5 to - 3.4). The charnockite and its enclaves show identical mineral assemblages and comparable orthopyroxene chemical compositions. The two anhydrous minerals of orthopyroxene and garnet are identified as of peritectic and magmatic origins given their textural features and geochemical compositions. Moreover, petrographic observations and bulk geochemical data argue that the peritectic minerals were derived from the entrainment of their granulitic sources. Crystallization phase modeling indicates orthopyroxene would have been completely hydrated and formed biotite when water contents exceed ∼0.3 wt.% near the solidus. Water-in-zircon analysis and thermodynamic modeling indicate low magma water contents (∼0.15 wt.%; 135 ppm, zircon water medians) for the Gaozhou charnockite from early crystallization to final solidification. CO2‐rich fluids flushed the charnockite reservoir further contributing to the stabilization of the orthopyroxene. Accordingly, the Yunkai charnockite reveals deep crustal melting processes involving anhydrous minerals entrained in a low-water environment. This low-water environment correlates with high-temperature melting of granulite-facies rocks in the lower crust and the presence of CO₂-rich fluids within the system. Regional magmatic-metamorphic-tectonic data indicate that the formation of the Yunkai A-type charnockite occurred within a post-orogenic extension regime, representing the peak of intracrustal reworking in South China.

How to cite: yang, H. and Yao, J.: Formation of A-type charnockite and constraints on deep crustal anatexis in early Paleozoic orogen, South China, EGU General Assembly 2026, Vienna, Austria, 3–8 May 2026, EGU26-8520, https://doi.org/10.5194/egusphere-egu26-8520, 2026.

EGU26-9303 | Posters virtual | VPS30

A New Approach to Rift Kinematics During the Formation of the Black Sea Basin 

Armagan Kaykun and Russell Pysklywec

As recent hydrocarbon discoveries rekindle exploration activities in the Black Sea Basin (BSB), efforts to understand the geodynamic processes that led to the formation and evolution of the basin have started to play a significant role in understanding the structural trends formed during rifting. The debate on whether the basin rifted open as one east-west oriented basin, or as two separate basins named the Eastern and Western Black Sea Basins, has been discussed in numerous models. Evidence for the two-basin hypothesis focuses on the basin's semi-parallel ridge and depression architecture, which trends NW-SE in the east and W-E in the west. Conversely, the single-basin model is supported by the correspondence between the regional structure and geodynamic rifting models, specifically those involving an asymmetrical rift pivoting on an eastern hinge caused by slab roll-back of the subducting plate located in the south of the basin.
To address existing tectonic uncertainties, we established a new structural framework for the BSB by reinterpreting 24 long-offset 2D seismic lines. These structural constraints enabled the development of two 2D computational models, allowing us to simulate the distinct kinematic evolution of the basin's western and eastern sections. Our 2D sectioned models show that rift velocities vary significantly in the east-west direction. This contradicts previous analog models showing that the formation of the BSB was related to a simple asymmetrical rift with constantly increasing velocities towards the west from a hinge point located at the eastern margin of the basin. The complex velocity changes throughout the rift axis suggest an uneven movement throughout the subduction zone that drives the back-arc rift. Ultimately, proposing a new complex kinematic history during the evolution of the rift and alternating rift velocities throughout the rift axis, provide a better understanding of the timing of all tectonic events and the final ridge depression geometry observed throughout the BSB.

How to cite: Kaykun, A. and Pysklywec, R.: A New Approach to Rift Kinematics During the Formation of the Black Sea Basin, EGU General Assembly 2026, Vienna, Austria, 3–8 May 2026, EGU26-9303, https://doi.org/10.5194/egusphere-egu26-9303, 2026.

EGU26-16222 | ECS | Posters virtual | VPS30

Quantitative lineament network analysis of a folded crystalline terrain using FracPaQ: The Kadavur Anorthosite Complex, Southern Granulite Terrane 

Aravind Prathapachandran, Arunima Manilal Girija, and R Senthil Kumar

The Kadavur Anorthosite Complex represents a distinctive structural domain within a folded high-grade crystalline terrain, where a massif-type anorthosite body occupies the core of a regional-scale fold and is surrounded by folded quartzite ridges. This study examines the relationship between lineament development and the pre-existing ductile fold architecture through integrated DEM–SRTM data analysis and quantitative lineament network characterisation using FracPaQ. The objective is to assess how fold geometry and lithological contrasts influence the spatial distribution and mechanical behaviour of brittle structures. DEM analysis reveals a coherent folded morpho-structural architecture characterised by a well-defined core, axial-plane domains, and limbs expressed as quartzite ridges. FracPaQ-derived results show that lineaments are non-randomly distributed and define multiple dominant orientation sets, reflecting systematic structural control rather than random patterns. Spatial variations in lineament density and lineament intensity show pronounced localisation within and adjacent to the fold core, whereas lineament attributes vary systematically between the anorthosite-dominated core and the surrounding folded quartzite limbs.

Slip tendency analysis indicates that brittle deformation is predominantly shear-controlled across the study area, while dilation tendency values are generally low to moderate, suggesting a subordinate role for opening-mode fracturing. Lineaments within the anorthosite core are comparatively longer, less densely spaced, and display lower orientation dispersion, reflecting brittle stress accommodation within a mechanically competent lithology. In contrast, lineaments developed in the folded quartzite ridges are shorter, more closely spaced, and strongly influenced by lithological layering and fold-related bending stresses.

Although comparable lineament orientation patterns occur across the fold core, axial planes, and limbs, their geometric characteristics, spatial distribution, and inferred mechanical roles differ significantly, indicating that brittle deformation was modulated by local fold geometry and lithological contrasts. The results indicate a structural association between ductile folding and later brittle deformation; however, the tectonic conditions responsible for anorthosite exhumation cannot be uniquely constrained from the present dataset. This study highlights the importance of domain-specific lineament analysis in folded crystalline terrains and emphasizes the role of inherited ductile architecture in controlling later brittle deformation.

How to cite: Prathapachandran, A., Manilal Girija, A., and Kumar, R. S.: Quantitative lineament network analysis of a folded crystalline terrain using FracPaQ: The Kadavur Anorthosite Complex, Southern Granulite Terrane, EGU General Assembly 2026, Vienna, Austria, 3–8 May 2026, EGU26-16222, https://doi.org/10.5194/egusphere-egu26-16222, 2026.

EGU26-17196 | ECS | Posters virtual | VPS30

Progressive evolution of paleostress in the Hutti-Maski Greenstone belt, Eastern Dharwar Craton, southern India 

Shalini Goswami and Manish A. Mamtani

This study presents a paleostress reconstruction of the metavolcanic and granitoid rocks of the Hutti-Maski greentone belt, Eastern Dharwar Craton (EDC), southern India, aimed at evaluating progressive changes in the regional stress field at ca. 2.5 Ga. Paleostress was constrained using quartz vein orientations, Anisotropy of Magnetic Susceptibility (AMS) fabrics, and fault–slip data from metavolcanic and granitoid rocks.

Anisotropy of Magnetic Susceptibility (AMS) data from granitoids reveal a dominant NNW–SSE–striking magnetic fabric developed during earlier D1/D2 deformation. Paleostress analysis using vein orientations of dilational quartz veins in the granitoids yields an apparent NE–SW compressional stress field. However, kinematic analysis demonstrates that these veins in the granitoids were formed by dextral simple shear along the pre-existing NNW–SSE–oriented fabric under a regional N–S–directed D3 compression. From previous studies it is already well established that this regional N–S–directed D3 compression was responsible for D3 folds with E–W–striking axial planes found in different parts of EDC. N-S-oriented dilational quartz veins in the metavolcanic rocks of this greenstone belt were also formed due to this N-S oriented D3 compression. This interpretation is further supported by comparable stress ratio values obtained from three-dimensional Mohr circle analyses of vein populations in both lithologies.

Fault–slip analysis of displaced veins in granitoids reveals a late-stage NNE–SSW compressional stress field, indicating localised brittle deformation during the final stages of D3. This late brittle overprint is interpreted as resulting from late-D3 brittle deformation during the cratonization of the Dharwar Craton at approximately 2.5 Ga.

Therefore, this study demonstrates that there are pitfalls in the direct evaluation of paleostress using only vein orientations and that it is crucial to integrate kinematic constraints with vein orientation data during paleostress analysis of dilational veins.

How to cite: Goswami, S. and Mamtani, M. A.: Progressive evolution of paleostress in the Hutti-Maski Greenstone belt, Eastern Dharwar Craton, southern India, EGU General Assembly 2026, Vienna, Austria, 3–8 May 2026, EGU26-17196, https://doi.org/10.5194/egusphere-egu26-17196, 2026.

EGU26-18303 | Posters virtual | VPS30

Anisotropy of fracture nodes using wavelet analysis 

Pradeep Gairola and Sandeep Bhatt

 Abstract:

Fracture networks play a critical role in controlling rock mechanics, fluid flow, and crustal deformation. However, many conventional analytical approaches do not adequately account for the spatial anisotropy of fracture nodes. This study introduces a wavelet-based angular variance method to quantify multiscale anisotropy in fracture network nodes, including I-, Y-, X-, and X + Y-nodes, as well as barycenters, using both synthetic and natural datasets.

Synthetic experiments demonstrate that isotropic fracture systems produce spatially random node distributions, whereas anisotropic systems generate distinct directional clustering, such as cross-shaped patterns aligned along NE–SW and NW–SE orientations. Application of the method to field data reveals strong correspondence between node anisotropy and underlying structural features. In the Jabal Akhdar dataset, X- and X + Y-nodes show pronounced elongation along an ENE–WSW direction, I-nodes exhibit weaker lobation in the same orientation, and barycenters remain largely isotropic. In contrast, the Getaberget dataset displays significant anisotropy across barycenters and multiple node types (Y, X, and X + Y), with dominant N–S to NNW trends consistent with NE–SW and NW–SE fracture sets.

These results demonstrate that wavelet-based node analysis is capable of detecting subtle, scale-dependent anisotropy in fracture systems. The proposed approach provides a sensitive, continuous, and scalable framework for quantifying fracture network organization, offering valuable insights for reservoir characterization, geothermal resource assessment, and the analysis of fracture-controlled fluid flow in geological systems.

 Keywords: Fracture network; Nodes; Spatial analysis; Point anisotropy; Wavelet analysis

 Acknowledgement

PG acknowledges the Indian Institute of Technology Roorkee and the Ministry of Human Resource Development (MHRD), Government of India, for support through a PhD fellowship. SB acknowledges financial support from the Department of Science and Technology (DST), Government of India (Project No: SRG/2021/001903), and from FIG (Grant No: FIG-100886-ESD), Indian Institute of Technology Roorkee, India.

How to cite: Gairola, P. and Bhatt, S.: Anisotropy of fracture nodes using wavelet analysis, EGU General Assembly 2026, Vienna, Austria, 3–8 May 2026, EGU26-18303, https://doi.org/10.5194/egusphere-egu26-18303, 2026.

EGU26-18367 | ECS | Posters virtual | VPS30

Quantitative Characterization of Fracture Networks Based on Geometric-Topological Integration and Its Application in Hydrocarbon Migration Prediction in the Western Junggar Basin 

Ye Tao, Lijie Cui, Yuxi Niu, Yawen Huang, Song Bai, Guoan Zhao, Paerhati Piluolan, and ying liu

With the continuous advancement of geological research, quantitative analysis of fracture networks has become a crucial research direction in geological exploration and resource development. To overcome the limitations of traditional methods in quantitatively analyzing fault data under complex geological conditions, we adopt a quantitative fracture characterization method based on geometric and topological theories. This study focuses on the overlay analysis of multi-period and multi-layer faults in a typical area of the western Junggar Basin, aiming to reveal their significant role in hydrocarbon exploration. By means of this method, we achieve multi-dimensional automatic quantification of geometric features (including fracture network length, orientation, and Pxy system), as well as node/branch types and topological parameters. Through the construction of a fracture topological network, we can quantitatively analyze the connectivity characteristics of each period and the vertically favorable conduction zones across multiple periods, thereby providing valuable guidance for hydrocarbon migration path prediction.

How to cite: Tao, Y., Cui, L., Niu, Y., Huang, Y., Bai, S., Zhao, G., Piluolan, P., and liu, Y.: Quantitative Characterization of Fracture Networks Based on Geometric-Topological Integration and Its Application in Hydrocarbon Migration Prediction in the Western Junggar Basin, EGU General Assembly 2026, Vienna, Austria, 3–8 May 2026, EGU26-18367, https://doi.org/10.5194/egusphere-egu26-18367, 2026.

The Achankovil Shear zone (AKSZ), juxtaposing the Trivandrum Granulite Block (TB) and the Madurai Granulite Block (MB) of the Southern Granulite Terrane (SGT), represents a paleo-suture zone related to the late Neoproterozoic to early Cambrian Gondwana assembly (Rajesh et al., 1998; Praharaj et al., 2021). The polyphase deformational history of the Achankovil Shear Zone (AKSZ) reveals progressive transition from a ductile to brittle deformation regime concomitant with high-grade granulite facies metamorphism and subsequent cooling–exhumation of the granulites. Progressive evolution of the state of stress and the variation of crustal dynamics during the ductile to brittle deformation regime transition, and the genetic link between these two contrasting episodes, if any, have been evaluated from statistical analysis of solid-state fabric and kinematic analysis of brittle fractures.

Three ductile deformation phases, D1, D2, and D3, and associated solid-state fabrics, i.e., S1, S2, and S3, are discernible at the mesoscopic scale. S1 fabric is gneissic in character and is only preserved in strain shadow regions. Elsewhere, S1 is transposed along the later S2 fabric, which is axial planar to fold on S1. Prevalence of high-temperature deformation conditions during D2 and D3 deformation stages is manifested by the presence of S2-parallel stromatic leucosomes and diatexite leucosome along dilatant S3 fabric, developed parallel to the axial planes of fold on S2. Significant simple shear component during D3 deformation is evidenced from the asymmetric nature of S2 folds, asymmetric porphyroclast tail and other shear sense markers. Eigen vector analysis reveals a change of maximum eigen vector, i.e., pole to the mean foliation, from NW-SE (D1: 311⁰/62⁰ NE) to N-S (D3: 187⁰/80⁰ W). The maximum eigen vector of D2 (125⁰/53⁰ SW), though similar in trend with D1, shows a reversal of dip direction. Fabric shape analysis reveals a progressive change from girdle to a strong clustered distribution of solid-state fabric from D1 to D3 deformation regime, suitably accounting for intense ductile shearing and transposition of earlier fabric during the D3 deformation stage.

Minor conjugate faults are ubiquitous at different locations along the AKSZ. Dihedral angle of ~60 or less for these faults suggests a shear or hybrid fracture origin, diagnostic of a compressive stress regime. Also, the observed slip of striations on slickensides suggests a consistent oblique reverse kinematics. Fault kinematic and paleo-stress analysis further reveals two distinct stress regimes with NW-SE and NE-SW directed maximum compressive stress (s1). Stress ratios for these faults imply a compressional to transpressional tectonic regime. Superposition of the slip tendency of NW–SE directed stress tensor over NE–SW directed stress tensor and vice-versa suggests that the NW-SE stress tensor precedes the NE-SW stress tensor during a progressive brittle deformation regime. Summarily, the cooling and exhumation and the switch over from ductile to brittle deformation regimes of the granulites took place under a compressive stress field developed during terrane accretion along the AKSZ. The brittle faults seemingly result from the relaxation of the orogenic far-field stress.

How to cite: Manilal Girija, A. and Bhadra, S.: Ductile to brittle tectonic evolution of the Achankovil Shear Zone, Southern Granulite Terrane – Constraints from statistical analysis of fabric and paleostress inversion, EGU General Assembly 2026, Vienna, Austria, 3–8 May 2026, EGU26-20066, https://doi.org/10.5194/egusphere-egu26-20066, 2026.

EGU26-21372 | ECS | Posters virtual | VPS30

Dynamic Triggering and Effects of Crust Heterogeneities on Propagating Waves due to the 2025 Mw 7.7 Myanmar Earthquake 

Sneha Gupta, Vipul Silwal, and Sanjay Singh Bora

We investigate the heterogeneity of the Indian subcontinent using seismic recordings from the Mw 7.7 Myanmar earthquake that occurred on 28 March 2025. This event was recorded by broadband stations across India. These variations in waveforms at different stations highlight the influence of radiation pattern, crustal structure, wave-propagation paths, and local site conditions. Sedimentary basins, characterized by relatively soft sediments, are known to amplify seismic energy and modify ground motion characteristics, often resulting in enhanced shaking. Understanding these effects is essential for assessing seismic hazard.

We use time-series data from approximately 88 seismic broadband stations provided by the National Centre for Seismology (NCS), India. We apply frequency spectrum analysis, horizontal-to-vertical spectral ratio (HVSR) analysis, and surface wave dispersion analysis. The frequency spectrum helps identify frequency bands where seismic energy is amplified while HVSR analysis is used to estimate the site’s fundamental resonance frequency and the corresponding amplification factor. Surface wave dispersion analysis provides shear-wave velocity information, which is crucial for characterizing near-surface geological conditions.

Together, these analyses help us to understand the influence of local geological conditions at the receiver sites and contributes to a better analysis of regional seismic wave propagation and site-specific ground motion characteristics across the Indian subcontinent.

How to cite: Gupta, S., Silwal, V., and Bora, S. S.: Dynamic Triggering and Effects of Crust Heterogeneities on Propagating Waves due to the 2025 Mw 7.7 Myanmar Earthquake, EGU General Assembly 2026, Vienna, Austria, 3–8 May 2026, EGU26-21372, https://doi.org/10.5194/egusphere-egu26-21372, 2026.

EGU26-21385 | ECS | Posters virtual | VPS30

Constraining Late Pleistocene to Holocene seismic fault activity in NE Iberia: The value of integrating complementary techniques in a low-strain region 

Marc Ollé-López, Julián García-Mayordomo, John Gallego-Montoya, Júlia Molins-Vigatà, Fabian Bellmunt, Anna Gabàs, Juvenal Andrés, Albert Macau, Altug Hasözbek, Anna Martí, Paula Figueiredo, Ángel Rodés, David García, María Ortuño, and Eulàlia Masana

The northeastern margin of the Iberian Peninsula, extending from the Vallès-Penedès Graben to the Valencia Depression, constitutes a passive margin related to the opening of the Valencia Trough during the Neogene. It comprises a series of extensive basins bounded by several mountain ranges, where numerous NNE–SSW-oriented normal faults are present, commonly associated with mountain fronts. Previous studies show that some of these faults, such as the El Camp fault, remain active, although at very low slip rates, as low as 0.02 m/kyr for Late Pleistocene.
Recent analyses of high-resolution Digital Elevation Models (DEMs) have revealed several additional morphological escarpments crosscutting different Quaternary alluvial fan systems across the region. These scarps, found from the Sant Jordi Plain to the La Salzadella Basin, share the same orientation as the Neogene faults, suggesting a common tectonic origin. They are discontinuous, arranged in a right-stepped pattern, and locally display vertical offsets of up to 8 m. Furthermore, several geomorphic features indicate recent tectonic activity, including aligned fissures within the fans and entrenched channels developed on the upthrown block that fade out after crossing the escarpments. Each family of escarpments exceeds 10 km in length, with important implications for the seismic hazard of the region.
Geophysical surveys (ERT, GPR, SRT, HVSR, and MT), validated with borehole data, confirm the presence of faults beneath each analysed escarpment system. At the Vinaixarop escarpment, for instance, ERT profiles revealed a steeply dipping discontinuity plane with a vertical offset of approximately 40 m affecting upper Pliocene sediments.
The faulted alluvial fans are interpreted as Lower to Middle Pleistocene in age and are mainly composed of carbonate gravels. Paleoseismological trenches excavated at four sites (L’Ampolla, Vinaixarop, and two at Sant Rafael del Riu) on different scarps revealed consistent evidence of late Quaternary faulting, such as ruptured strata. Additionally, ground-based hyperspectral cameras (400–1700 nm) were deployed on trench walls as an ancillary tool to map faulted
stratigraphic layers and to detect subtle coseismic deformation. As sedimentation on the fans ceased by the Middle Pleistocene, subsequent activity has been primarily recorded through the deformation of pedogenic features (calcretes), commonly found in the study area. To constrain the timing of this activity, U–Th dating was performed on fault-related carbonates and deformed calcretes. Preliminary results indicate that tectonic activity along these faults persisted at least until the Late Pleistocene. However, a deformed colluvial wedge and the presence of open fissures observed on trench walls suggest Holocene activity.
Additionally, three cosmonuclide depth-profiles were sampled to date displaced geomorphic surfaces, and hence estimating the long-term slip rates of the faults. Ongoing analyses aim to demonstrate Holocene seismic activity and to further characterize paleoearthquakes and their seismic parameters.
In summary, studies of active tectonics in regions of very low strain are inherently challenging, especially when recent sedimentation is scarce and pedogenic processes are intense. Nevertheless, this work highlights that integrating multiple complementary techniques is the most effective approach to address such settings.

How to cite: Ollé-López, M., García-Mayordomo, J., Gallego-Montoya, J., Molins-Vigatà, J., Bellmunt, F., Gabàs, A., Andrés, J., Macau, A., Hasözbek, A., Martí, A., Figueiredo, P., Rodés, Á., García, D., Ortuño, M., and Masana, E.: Constraining Late Pleistocene to Holocene seismic fault activity in NE Iberia: The value of integrating complementary techniques in a low-strain region, EGU General Assembly 2026, Vienna, Austria, 3–8 May 2026, EGU26-21385, https://doi.org/10.5194/egusphere-egu26-21385, 2026.

EGU26-694 | ECS | Posters virtual | VPS31

Adverse Birth Outcomes Attributable to High Heat in Nigeria  

Doris Seyinde and Sagnik Dey

Exposure to fine particulate matter (PM2.5) has been linked with adverse birth outcomes in Nigeria. Emerging evidence suggests that high temperatures may also be associated with these outcomes. However, this association, as well as whether temperature modifies the effects of PM2.5 on these outcomes, has not been explored in Nigeria.
Using data from the 2018 Nigerian Demographic and Health Survey, we examined the association between maternal exposure to maximum temperature (Tmax) during pregnancy and adverse birth outcomes, including Low Birth Weight (LBW), Preterm Births (PTB), and Stillbirths (SB). A daily maximum near-surface air temperature gridded dataset (2012-2018) at 1-km2 resolution was obtained from Zhang et al. (2022) and linked to birth clusters based on geographic coordinates. Temperature metrics (hot days and heatwave events) were derived from the 90th percentile threshold of the daily Tmax values, based on all pregnancy periods. Logistic regression analysis was used to estimate the association between these metrics and birth outcomes. The intensity, frequency, and duration of these temperature metrics in relation to the birth outcomes were also evaluated. We then estimated the Relative Excess Risk due to Interaction (RERI) using interaction terms for each temperature metric during the corresponding PM2.5 exposure period.
We observed a strong correlation (r=0.93) between the model temperature data and observational data (2012-2018). An increasing positive association was observed between the duration of hot days and PTB, while an increase in heatwave events was positively associated with LBW. Intensity in hot days was positively associated (1.59; 95% CI: 1.28-1.96) with LBW. At the same time, frequency in hot days showed no significant relationship with any of the birth outcomes. Positive additive interaction between high temperature and PM2.5 was observed across exposure categories for LBW and SB. The magnitude of interaction was greater at moderate PM2.5 levels (Q2) for LBW, while the highest levels (Q3) had a greater effect for SB. As global temperatures rise, these findings provide evidence that maximum temperature can intensify the health burden of ambient PM2.5 during pregnancy, underscoring the need for climate-adaptive maternal health interventions.

How to cite: Seyinde, D. and Dey, S.: Adverse Birth Outcomes Attributable to High Heat in Nigeria , EGU General Assembly 2026, Vienna, Austria, 3–8 May 2026, EGU26-694, https://doi.org/10.5194/egusphere-egu26-694, 2026.

EGU26-707 | ECS | Posters virtual | VPS31

Data-Driven Modelling and Assimilation of the Sub-Seasonal Evolution of Sea Surface Temperature 

Sai Hemanth Yagna Kasyap Madduri, Manikandan Mathur, and Aniketh Kalur

Sea Surface Temperature (SST), due to its influence on air-sea interactions, is a critical input into weather models. While physics-based ocean models are continually improving to better represent SST in weather models, data-driven methods offer a promising alternative. In this work, we present an implementation of nonlinear operator inference on a satellite-based SST field (10 km spatial resolution, 1 day temporal resolution) in the northern Indian Ocean, which is known to significantly impact the Indian monsoon. For the prediction of SST, a reduced-order model with a polynomial structure is built non-intrusively from satellite data over a 30-day training period, showing the first five proper orthogonal decomposition modes to capture the SST evolution. A moving-window assimilation scheme utilises the reduced-order model adjoint to correct the prior state, enforcing the model equations over the assimilation window with state observations. Results show that this framework corrects drift, extending the prediction horizon from one week to twenty days. We demonstrate the efficacy of the discovered models using error metrics and their ability to accurately capture lateral SST gradients. Importantly, the inferred operators from the reduced-order model enable the derivation of an explicit adjoint directly from the data, overcoming the computational constraints of General Circulation Models that prohibit rapid adjoint-based assimilation. The performance of the reduced-order model over multiple seasons will also be presented, including the effects of training with data from several years.

How to cite: Madduri, S. H. Y. K., Mathur, M., and Kalur, A.: Data-Driven Modelling and Assimilation of the Sub-Seasonal Evolution of Sea Surface Temperature, EGU General Assembly 2026, Vienna, Austria, 3–8 May 2026, EGU26-707, https://doi.org/10.5194/egusphere-egu26-707, 2026.

EGU26-1331 | Posters virtual | VPS31

Impact of deer traffic on physical soil erosion and changes in infiltration capacity at forest edges 

Hiromi Akita, Satoru Yusa, Hitoshi Yokoyama, Masataka Kawasaki, Keigo Kamida, Yuichiro Usuda, and Masako Ikeda

This study investigated forest edge areas adjacent to a residential road in a hilly area of Nagano Prefecture, Japan, to examine the impact of Cervus nippon (hereafter referred to as “deer”) movements on physical erosion and changes in infiltration capacity of forest soils. The survey area included the edges of cypress and larch forests bordering a residential road west of the Mochizuki Highland Ranch in Mochizuki-machi, Saku City, Nagano Prefecture. Soil erosion was assessed by measuring the height and direction of exposed roots at multiple points. Analysis of root system exposure height (Rh) revealed higher values in the larch forest than in the Japanese cypress forest. Furthermore, the polar coordinate distribution of exposed roots indicated predominant exposure in the steepest slope direction, with some deviations, suggesting that slope angle influences deer movement patterns. Comparisons of cumulative infiltration capacity showed lower values in the cypress forest compared to the larch forest. Soil with clear deer hoof prints exhibited lower infiltration capacity in both areas. The unsaturated hydraulic conductivity (K) for disturbed soil along the deer migration route was approximately half that for natural soil, and in soil with clear deer hoof prints, it decreased to about 1/10 that for natural soil. These findings demonstrate that deer traffic significantly reduces soil infiltration capacity. The results indicated that in forested areas with high levels of deer traffic, K may decrease to 1/2 to 1/10 of normal levels, highlighting the substantial impact of deer activity on forest soil properties.

How to cite: Akita, H., Yusa, S., Yokoyama, H., Kawasaki, M., Kamida, K., Usuda, Y., and Ikeda, M.: Impact of deer traffic on physical soil erosion and changes in infiltration capacity at forest edges, EGU General Assembly 2026, Vienna, Austria, 3–8 May 2026, EGU26-1331, https://doi.org/10.5194/egusphere-egu26-1331, 2026.

Urban renewal is not only a transformation in urban development models but also a shift in urban governance approaches. Implementing urban renewal initiatives is a crucial component of the new urbanization strategy. After experiencing rapid urbanization characterized primarily by "extensive expansion," Chinese cities are gradually shifting toward "intensive development," entering a stage of optimizing existing urban stock through renewal. As a new engine for promoting high-quality urban development, urban renewal is increasingly becoming a key force in optimizing urban spaces and enhancing people's quality of life. It serves as a vital means to advance modernization and achieve the construction of livable cities. Clarifying the thermal environmental effects of urban renewal and their driving mechanisms can provide targeted management strategies for improving urban thermal environments and enhancing livability.

This study focuses on renewal areas within Fuzhou's built-up zones where significant changes have occurred in building structures while the underlying surfaces remain impervious. We analyzed the spatiotemporal distribution characteristics of heat island intensity at key time nodes and the changes in heat island patterns within the renewal area. Additionally, the differences in thermal environmental effects across different types of urban renewal areas at the block scale have been quantified. On this basis, we explored the driving mechanisms of these thermal environmental effects.

The main findings are as follows: (1) From 2000 to 2022, the urban renewal area of Fuzhou City covered approximately 67 km², with the renewal zone concentrated in the old urban area. Renewal during this period mainly focused on the transformation from high-density mid-to-low-rise buildings to low-density mid-to-high-rise buildings, as well as the transformation of industrial sites.

(2) The spatial distribution of changes in urban heat island intensity aligns closely with urban development types. Areas where heat island intensity weakens are mainly concentrated in urban renewal zones, while areas where it strengthens appear in urban expansion zones. The distribution of extremely strong heat islands shows a migration trend from northwest to southeast, consistent with Fuzhou’s urban development strategy.

(3) Overall, urban renewal has improved the thermal environment of Fuzhou. The average intensity of the urban heat island in the updated area decreased by 1.00°C. The primary change in heat island intensity was the transition from extremely strong heat islands to lower intensity categories, effectively mitigating extreme thermal risks.

(4) The analysis of driving mechanisms shows that the thermal environmental effects of urban renewal are driven by the interaction of the water vapor index (NDMI), vegetation index (NDVI), bare soil index (BSI), building coverage rate (BCR), building height (BH), POI mixture degree, and distance to adjacent green spaces and factories. Among these, BSI and BCR are the main driving forces for the increase in heat island intensity, while BH, POI mixture degree, and distance to adjacent factories are the primary factors driving the decrease in heat island intensity.

How to cite: Liu, Z.: Urban Renewal Makes Cities More Livable-An Empirical Study of Fuzhou City from the Perspective of Thermal Environment, EGU General Assembly 2026, Vienna, Austria, 3–8 May 2026, EGU26-1620, https://doi.org/10.5194/egusphere-egu26-1620, 2026.

EGU26-1736 | ECS | Posters virtual | VPS31

Assessing Socio-Economic Impacts of Climate Change in the Arctic through Geoinformatics: the contribution of EO-PERSIST project  

Michail Starakis, Nikolina Myofa, Eleftheria Volianaki, Georgios Nektarios Tselos, Konstantina Petropoulou, Spyridon E. Detsikas, Antonis Litke, and George P. Petropoulos

In the context of a rapidly changing climate, there is a growing need to assess the impacts of climate change on natural systems, infrastructure, and human activities. Arctic regions are particularly vulnerable, as climate-driven changes extend beyond environmental degradation to significantly affect multiple socioeconomic dimensions. Therefore, there is an increasing need for holistic frameworks capable of capturing and analysing the socioeconomic impacts of climate change on local Arctic communities. In this regard, recent advances in geoinformation technologies - particularly Earth Observation (EO), cloud computing, Geographic Information Systems (GIS), and WebGIS platforms - offer unprecedented opportunities for Arctic climate change research. Nevertheless, a notable gap remains in existing methodological approaches for the effective integration of geoinformatics with socioeconomic studies. This study aims to provide an overview of the EO-PERSIST project, an EU-funded project under the MSCA Staff Exchanges scheme, which aims at developing a cloud-based geospatial platform for understanding the socioeconomic impacts of climate change on Arctic communities. In addition, this study presents the proposed methodological frameworks integrating socioeconomic and geoinformation data developed under EO-PERSIST project, alongside key results from the socioeconomic modeling and the project’s Use Cases. Overall, this work highlights the need for an interdisciplinary and integrated approach that combines EO data, geospatial technologies, and socioeconomic analysis to support informed decision-making in Arctic regions. The EO-PERSIST geospatial platform contributes to this effort by providing key research outputs and methodological approaches that support adaptation strategies and policy development, ultimately enhancing resilience in Arctic permafrost environments.

Keywords: GIS; Earth Observation; Geoinformatics; EO-PERSIST, Cloud Platform, Arctic, Socioeconomic Impact; Acknowledgement The present research study is supported by the project “EO-PERSIST”, funded by the European Union’s Horizon Europe research and innovation program (HORIZON-MSCA-2021-SE-01-01, under grant agreement no. 101086386

How to cite: Starakis, M., Myofa, N., Volianaki, E., Tselos, G. N., Petropoulou, K., Detsikas, S. E., Litke, A., and Petropoulos, G. P.: Assessing Socio-Economic Impacts of Climate Change in the Arctic through Geoinformatics: the contribution of EO-PERSIST project , EGU General Assembly 2026, Vienna, Austria, 3–8 May 2026, EGU26-1736, https://doi.org/10.5194/egusphere-egu26-1736, 2026.

EGU26-3515 | ECS | Posters virtual | VPS31

EcoScapes: LLM-Powered Advice for Crafting Sustainable Cities 

Martin Röhn, Nora Gourmelon, and Vincent Christlein

Climate adaptation is critical for the functionality and quality of life in urban areas under more frequent and severe extreme weather events, such as heatwaves, droughts, and floods. Smaller towns, however, may struggle to adapt because of funding issues, administrative burdens and difficulties using environmental data. This study presents EcoScapes, a decision-support framework to enhance LLM advisory with local Earth observation data. EcoScapes integrates three key components: automated acquisition and preprocessing of Sentinel-2 imagery; Vision Language Models (VLMs) for structured interpretation of satellite-derived representations; and a downstream knowledge-based advisory workflow inspired by prior work.

Given a user-provided town or city name, EcoScapes geocodes the location and retrieves Sentinel-2 imagery for a 5 km bounding box around the urban center. To minimize cloud interference, we use a 1% cloud cover filter, which enables usability but might bias towards drier conditions and miss seasonal water bodies. EcoScapes processes satellite data rendered by the Sentinel-2 API, which includes RGB, water, and moisture views. The system uses a modular analytical pipeline, with an RGB analysis module employing a VLM to describe urban structures, like built-up areas, green spaces, and roads, via focused prompts. This approach reduces hallucinations and ensures more accurate analyses. Separate water and moisture modules analyze the outputs. Water analysis removes small, likely irrelevant features before an RGB-based step connects identified water bodies to their environment and infrastructure. Moisture analysis is used to find heat islands. Finally, a local small language model combines outputs into a single “Climate Report”. This report is subsequently used as context for a ChatClimate-style [1] system that is grounded in the IPCC AR6. This enables a comparison between a baseline advisory system relying on the knowledge base alone and the same system augmented with EcoScapes’ local report.

Since EcoScapes generates varied text outputs, we qualitatively assess its performance using two contrasting case studies: Roßtal, a small rural community of 10,000 people, and Erlangen, a medium-sized city with a population exceeding 100,000. The results indicate EcoScapes can provide useful local context where pre-existing model knowledge is limited. EcoScapes’ report made Roßtal’s adaptation recommendations more relevant and usable, correcting geographically inaccurate suggestions in the baseline. However, EcoScapes’ own inconsistencies and occasional hallucinations remain a limiting factor. The downstream recommendations were affected by errors in interpreting water data in Erlangen, relative to the baseline system, which was more familiar with the city because of its training data. EcoScapes demonstrates Sentinel-2 data’s potential to improve climate advice in smaller towns. Achieving generalization will require improved multimodal reasoning and higher resolution images, while broader evaluation is necessary to determine whether such generalization holds.

More information can be found at our GitHub repository (https://github.com/Photon-GitHub/EcoScapes) and the corresponding paper on arXiv (https://arxiv.org/abs/2512.14373).


References

[1] S. Vaghefi et al., “Chatclimate: Grounding conversational ai in climate science,” Communications Earth & Environment, vol. 4, no. 1, pp. 480, 2023

How to cite: Röhn, M., Gourmelon, N., and Christlein, V.: EcoScapes: LLM-Powered Advice for Crafting Sustainable Cities, EGU General Assembly 2026, Vienna, Austria, 3–8 May 2026, EGU26-3515, https://doi.org/10.5194/egusphere-egu26-3515, 2026.

There is a pressing need for developing pedagogical frameworks that respond to the damaged, uneven, and entangled planetary conditions of the Anthropocene. I propose “patch-based learning” as a new pedagogical concept, in order to engage learners with the deep predicaments of the Anthropocene. The case study focuses on Yongsan in central Seoul, South Korea—a site marked by layered histories of militarization, displacement, and environmental degradation. Attending to ferality, terrestrial traceability, and denizenship as guiding vectors for traversing Yongsan, I explore ways of reading the site as Anthropocene patches and consider the pedagogical significance of such a reading. I argue that patch-based learning may offer a way to work with the ruptures, leaks, and feral dynamics that characterize planetary landscapes in the Anthropocene.

How to cite: Ahn, S.: How to Reimagine Education in the Anthropocene: Patch-based Learning of Feral Beings and Effects, EGU General Assembly 2026, Vienna, Austria, 3–8 May 2026, EGU26-4187, https://doi.org/10.5194/egusphere-egu26-4187, 2026.

EGU26-5100 | ECS | Posters virtual | VPS31

A People-Centric Approach to Repurposing Coal Mines in India 

Amrapali Tiwari, Aishwarya Ramachandran, and Vaibhav Chowdhary

As coal-dependent regions increasingly transition away from fossil fuels, questions about how to responsibly close and transform coal mines have gained global attention. In India, where coal mining has created monoeconomies with considerable informal and semi-/unskilled employment opportunities, the closure and transition of coal mines has significant implications for mining communities’ livelihoods and landscapes. However, existing approaches to post-mining land management globally tend to prioritize technical remediation and environmental compliance associated with mine closure and often overlook the voices and priorities of affected communities. Where stakeholder perspectives are solicited, it is most often through structured, quantitative multicriteria decision analysis (MCDA) techniques incorporating the perspectives of mining personnel and geotechnical experts rather than community members. Even while India and other countries (e.g., Australia) champion the use of participatory methods and stakeholder involvement in mine‑closure planning, there is still no agreed-upon set of protocols for fostering consistent, in-depth engagement. A critical gap persists between grassroots, community‑led initiatives and more technical top-down approaches, and research from the social sciences on mining remains notably scarce.

This study addresses this gap in the post-mining land use (PMLU) literature by explicitly incorporating social and community priorities into suitability assessments of PMLUs in the Indian context. We propose a “people-centric” approach integrating spatial‑decision support tools with social‑ecological systems thinking, which enables the identification of PMLUs which are not only suitable to the specificities of the mine site, but in line with more pressing socio-economic needs faced by surrounding stakeholders, particularly mining communities. Our three phase approach includes I) compiling information about the mine site, key stakeholders, and the regional context, II) understanding the social-ecological system the mine site is situated in, and III) developing spatially-explicit PMLU recommendations that are both technically appropriate for the site and match stakeholder needs and priorities. 

Phase I involves (re)assessing the mine site to ensure the site meets baseline environmental standards as well as engaging with regional and local stakeholders to solicit priorities, build trust, and set expectations. Phase II uses qualitative system dynamics modelling and causal loop diagrams to understand key social-ecological linkages and feedbacks, and then match the most relevant PMLUs to stakeholder priorities. Phase III involves identifying relevant geotechnical, biophysical, and socioeconomic criteria for each selected PMLU, and conducting a geographic information system (GIS)-MCDA with conflict resolution algorithms to map the most suitable locations within the mine site for each use.

Our workflow is designed to be flexible and responsive to changes in context; each phase operates along a spectrum of Low‑Medium‑High complexity, allowing for differences in data availability and time/resource constraints for stakeholder consultations, which is particularly important in low and middle income contexts like India. By foregrounding community priorities and embracing mixed-methods, we seek to bridge the gap between geotechnical and socio-cultural approaches to coal mine repurposing, identifying PMLUs that are not only technically feasible, environmentally sound, and economically viable, but deliver tangible livelihood benefits while preserving sociocultural ties to the landscape.

How to cite: Tiwari, A., Ramachandran, A., and Chowdhary, V.: A People-Centric Approach to Repurposing Coal Mines in India, EGU General Assembly 2026, Vienna, Austria, 3–8 May 2026, EGU26-5100, https://doi.org/10.5194/egusphere-egu26-5100, 2026.

EGU26-7766 | Posters virtual | VPS31

Automated Taxonomic Identification of Calcareous Nannofossils from Microscopic Imagery Using Convolutional Neural Networks 

Cristian Cudalbu, Bianca Cudalbu, and Mihaela Melinte - Dobrinescu

Calcareous nannofossils represent a key proxy for biostratigraphy and paleoenvironmental reconstructions, due to their high abundance, widespread distribution and rapid evolutionary turnover. However, conventional taxonomic identification under optical or electron microscopy remains time-consuming and strongly dependent on expert interpretation, especially when working with large datasets and heterogeneous assemblages. This limitation is critical for high-resolution stratigraphic studies in complex sedimentary settings where reworking, redeposition and tectonic transport may generate mixed-age associations.

This poster focuses on qualitative and quantitative investigations of Quaternary calcareous nannofossils based on microscopic analyses and the development of an automated taxonomic identification workflow. We propose a deep learning approach using a convolutional neural network (CNN) trained on curated image catalogues of nannofossil taxa, aiming to achieve end-to-end classification of microfossil imagery. The targeted temporal interval spans approximately on the last 25,000 years (since the LGM – Last Glacial Maximum), focused on samples from the NW Black Sea cores.

Beyond accelerating routine identifications, automated classification has the potential to provide more objective and reproducible taxonomic assignments, enabling consistent quantitative counting and supporting multidisciplinary analyses linking nannofossil variability to paleoenvironmental controls such as salinity, nutrient input and temperature. The proposed workflow represents a step toward scalable microfossil taxonomy, supporting robust stratigraphic correlations and palaeoceanographic interpretations in Quaternary successions.

Keywords: nannofossils, neural networks, image recognition

How to cite: Cudalbu, C., Cudalbu, B., and Melinte - Dobrinescu, M.: Automated Taxonomic Identification of Calcareous Nannofossils from Microscopic Imagery Using Convolutional Neural Networks, EGU General Assembly 2026, Vienna, Austria, 3–8 May 2026, EGU26-7766, https://doi.org/10.5194/egusphere-egu26-7766, 2026.

In May 2024, Samcheok Blue Power Unit 1, a coal-fired thermal power plant in Samcheok, Gangwon Province, South Korea, began commercial operation. Together with Unit 1 (completed in October 2023) and Unit 2 (scheduled for completion by the end of 2025), the Samcheok Blue Power complex will reach an installed capacity of 2,100 MW. Considering that fossil fuels are a decisive contributor to climate change and that South Korea has officially pledged to phase out coal by 2050, the continued construction and operation of a new coal plant in 2024 appears paradoxical. This puzzle becomes even more striking given that Samcheok has been widely recognized as a region with a successful anti-nuclear movement, suggesting the presence of an active environmental politics and a history of resistance to energy megaprojects.

To explore this contradiction, this research investigates how fossil fuel infrastructure is sustained through intertwined “circuits” of capital, material, and affect. In doing so, the study engages with debates on the technosphere, understood as a global assemblage of energy systems, infrastructures, institutions, and material interdependencies that shape, and often constrain, social and ecological futures. Rather than treating infrastructure as a self-contained system with clear boundaries, the study proposes the concept of infra-circuits. This concept emphasizes that infrastructures function as nodal points within circuits that are simultaneously connected and closed: they enable specific forms of connection while restricting others, much like electronic circuits that allow flow only through certain configured pathways. Infra-circuits are also chained, meaning that if one link is disrupted, the stability of the entire configuration is threatened unless alternative routes can be mobilized.

Importantly, infra-circuits are not only spatial but also temporal. They operate through inherited material pathways, regulatory arrangements, financial instruments, and labor regimes that bind present energy decisions to past investments and future obligations. While this resonates with socio-technical systems theory and its emphasis on path dependence, the concept of infra-circuits allows for analytical dimensions that remain underdeveloped in conventional approaches to technological adoption and innovation. Specifically, it draws attention to how infrastructures endure by assembling heterogeneous circuits of matter, finance, and affect, thereby revealing the intimate relationship between fossil development and patterned forms of public sentiment, attachment, fear, and aspiration.

By highlighting the chained and temporally extended nature of these circuits, this study argues that fossil infrastructure persists not merely due to economic rationality or policy failure, but because it is embedded in technospheric arrangements that stabilize particular futures while foreclosing others. Ultimately, the concept of infra-circuits offers a framework for rethinking fossil energy infrastructure as a material and affective formation situated at the apex of ecological crises in the Anthropocene.

How to cite: Kim, J.: Infra-circuits of fossil capital and Technosphere: More-than-human politics of the Samcheok thermal power plant, EGU General Assembly 2026, Vienna, Austria, 3–8 May 2026, EGU26-8729, https://doi.org/10.5194/egusphere-egu26-8729, 2026.

EGU26-8747 | ECS | Posters virtual | VPS31

Formalizing the Anthropocene: an interplay between normative knowledge-making and societal norm-making 

Kyungbin Koh and Buhm Soon Park

How, and to what extent, can societal norms legitimately enter scientific knowledge-making, or can science intervene in societal norm-making? This question has become a key matter in defining and studying the Anthropocene as a new geological epoch. This paper aims to enrich the discussion by examining how two kinds of norms – one operating primarily within the boundary of science and the other originating from broader societal concerns – came to intersect in the debate over formalizing the Anthropocene as a new geological epoch. The first part of the paper traces the historical development of the GSSP practice as the central normative backbone of modern chronostratigraphy. Drawing on archival documents from the International Subcommission on Stratigraphic Classification (ISSC), in which the concept of GSSP was first debated and negotiated, it shows how the classification of geological time became a GSSP-based institutional practice through specific procedures, standards, and conventions for recognizing particular stratigraphic signals as valid evidence for defining geological time. Against this historical backdrop, the second part points out that, from its inception, the Anthropocene has carried the reflexive mode of thinking about the consequences of human activities, such as climate change, biodiversity loss, and habitability, hence calling for planetary stewardship. Since a new geological epoch can only be ratified through the acceptance of a specific GSSP proposal, formalizing the Anthropocene became a site at which the scientific norms constructed in the late 20th century for the development of GSSP are brought into contact with the 21st-century societal norms embedded in the concept of a human-driven Earth-system change. In a nutshell, the very term “Anthropocene” connotes both descriptive and prescriptive practices.

In 2023, the Anthropocene Working Group (AWG) submitted a GSSP proposal identifying plutonium-239 fallout from the mid-20th-century nuclear testing as a globally synchronous marker, supported by multiple auxiliary stratigraphic proxies. As maintained by Skelton and Noone (2025) and the members of the AWG, this proposal has met the formal GSSP requirements with evidential robustness exceeding those of many previously ratified epochs. Nevertheless, the Subcommission on Quaternary Stratigraphy (SQS) voted to reject the proposal. This paper argues that the difficulties surrounding the formalization of the Anthropocene do not stem from matters of empirical evidence, but from matters of normative science: i.e., how existing scientific norms are to be interpreted, negotiated, and sometimes reconstructed when they encounter the pressure of societal imperatives to address planetary transformations. The paper thus asks how scientists should navigate the deeply humanistic implications of their stratigraphic decision about the Anthropocene.

How to cite: Koh, K. and Park, B. S.: Formalizing the Anthropocene: an interplay between normative knowledge-making and societal norm-making, EGU General Assembly 2026, Vienna, Austria, 3–8 May 2026, EGU26-8747, https://doi.org/10.5194/egusphere-egu26-8747, 2026.

EGU26-9385 | Posters virtual | VPS31

Urban-rural interdependencies from an Earth system’s view 

Barbara Warner and Mike Müller-Petke

Urban-rural interdependencies from an Earth system’s view

Global demand for resources such as food, building materials and water is rising, while land take —driven significantly by urbanization—is accelerating and has become a critical factor. This surge in demand is accompanied by the spatial decoupling of production and consumption regions, leading to unevenly distributed environmental damage. Consequently, issues like soil degradation, water pollution, and greenhouse gas emissions are externalized and cause the deterioration of natural conditions in the hinterland or in teleconnected rural areas. Accordingly, sustainability balancing ecological, social and economic aspects can hardly be achieved.

While the Earth system sciences in the Anthropocene also deal with the cumulative effects of human activity on environmental change, research on urban-rural interdependencies in the context of global sustainability remains rare. However, compliance with Earth system boundaries requires integrated approaches across resources, sectors and spatial scales. This necessitates rethinking urban-rural relationships beyond the traditional dichotomy of producers and consumers and instead views them as cooperative socio-ecological systems.

Based on the thematic examples of food, material, water and land use, we highlight regional approaches and derive three fundamental principles—‘circularity’, ‘spatial justice’, and ‘participation’—alongside with two heuristic perspectives: ‘socio-ecological systems thinking’ and ‘framing and governance'. hey are used to propose an advanced research agenda covering (i) an integrated framework for system knowledge on the complex and dynamic urban-rural interdependencies, (ii) scientific references for regional target knowledge informed by Earth boundaries, and (iii) the examination of governance structures as transformation knowledge to enable cross-regional design and implementation.

How to cite: Warner, B. and Müller-Petke, M.: Urban-rural interdependencies from an Earth system’s view, EGU General Assembly 2026, Vienna, Austria, 3–8 May 2026, EGU26-9385, https://doi.org/10.5194/egusphere-egu26-9385, 2026.

Climate models are not designed to provide detailed information on local rainfall that may trigger an outbreak of diarrhoea, but are nevertheless able to reproduce large-scale climatic conditions, processes, and phenomena. Hence, they have a minimum skillful scale, and downscaling makes use of skilfully simulated large-scale aspects in addition to information about how local rainfall depends on those larger scale conditions. The SPRINGS project studies the link between climate change and diarrhoea outbreak through a chain of models, where one stage provides input to the next. It’s important to design such model chains so that they provide a flow of salient and relevant information. This framework also needs to ensure robust results, as different global climate model simulations may give a different regional outlooks. It also needs to involve proper evaluation, and it's important that it is designed for both how the end-results are being used in decision-making, and that the end-results are correctly interpreted in terms of what they really represent. Here, such a framework used in SPRINGS is presented.

How to cite: Benestad, R.: Using global climate model simulations for outlooks on how climate change affects future diarrhoea risks, EGU General Assembly 2026, Vienna, Austria, 3–8 May 2026, EGU26-9608, https://doi.org/10.5194/egusphere-egu26-9608, 2026.

EGU26-10525 | ECS | Posters virtual | VPS31

Clocking the Heat: Projected Diurnal Patterns of Thermal Discomfort Across Saudi Arabia Under Future Climate Scenarios 

Nisreen Abuwaer, Buri Vinodhkumar, and Sami Al-Ghamdi

Rising extreme temperatures driven by climate change are expected to significantly degrade outdoor thermal conditions, stretching the day of extreme heat and leaving fewer hours for comfortable and safe outdoor activity, while increasing the health risks associated with outdoor exposure. This study investigates the impact of climate change on thermal discomfort across the Kingdom of Saudi Arabia. Projections from two CMIP6 models, at 6-hour temporal resolution, were used to compute the Discomfort Index (DI) based on dry-bulb temperature and relative humidity, and to assess diurnal variations in thermal stress at 03 UTC (06:00 AST), 09 UTC (12:00 AST), 15 UTC (18:00 AST), and 21 UTC (00:00 AST) under SSP1-2.6, SSP2-4.5, and SSP5-8.5 scenarios. Changes were evaluated for the near (2021–2040), mid (2041–2060), and far future (2081–2100). Thermal discomfort across Saudi Arabia intensifies progressively from the historical period to the far future, exhibiting pronounced spatial and diurnal variability. Historically, daytime discomfort (09–15 UTC) had a mean DI value of ~25.4 °C, corresponding to uncomfortable conditions across most regions, with some areas, particularly in the southeast and coastal regions, reaching very uncomfortable conditions. Early morning and evening hours (03–21 UTC) were slightly lower, with mean DI values around 22.8–23.4 °C, corresponding to slightly uncomfortable conditions. Future projections indicate a substantial increase in discomfort magnitude, particularly in coastal and southeastern areas. In the near-future (2021–2040), mean DI values increase to ~25–26 °C during daytime and ~23 °C during early morning and evening hours. By the mid-future (2041–2060), at 09 UTC (12:00 AST), the southeast and coastal regions are very uncomfortable and can reach extremely uncomfortable conditions under SSP5-8.5, reflecting peak thermal stress during the day. In the far-future period (2081–2100), at 09 UTC (12:00 AST), mean DI values reach ~27–28.6 °C under SSP2-4.5 and SSP5-8.5 scenarios, with maximum values exceeding 32 °C in the southeast region under SSP5-8.5, corresponding to dangerous conditions, highlighting the severity of midday thermal stress and its potential impacts on outdoor activities and urban livability. Evening and early morning mean DI values also rise substantially compared to historical conditions, reaching ~25–27 °C (uncomfortable), with some regions, particularly in the southeast, reaching up to ~30.5 °C (extremely uncomfortable), indicating that nighttime relief is markedly reduced and thermal discomfort persists even outside peak daytime hours. These findings emphasize the necessity of adaptive strategies to ensure the resilience, safety, and comfort of outdoor environments under increasing heat stress.

How to cite: Abuwaer, N., Vinodhkumar, B., and Al-Ghamdi, S.: Clocking the Heat: Projected Diurnal Patterns of Thermal Discomfort Across Saudi Arabia Under Future Climate Scenarios, EGU General Assembly 2026, Vienna, Austria, 3–8 May 2026, EGU26-10525, https://doi.org/10.5194/egusphere-egu26-10525, 2026.

High-quality, temporally consistent training samples are the cornerstone of accurate long-term urban Land Use/Land Cover (LULC) mapping. However, traditional sample generation relies heavily on labor-intensive manual interpretation and often lacks reproducibility. To address this, we developed PRTS-AI (Primary Regulated Time-series Sampling), an open-source system that integrates OpenStreetMap (OSM) data extraction, Large Language Model (LLM)-driven semantic classification, and LandTrendr-based temporal filtering into an automated workflow. By leveraging generative AI (e.g., DeepSeek/ChatGPT/Gemini) to interpret polygon attributes and using POI-based consistency checks, the system significantly reduces manual workload while ensuring semantic accuracy.

The PRTS-AI system integrates multi-source spatial and temporal data into a streamlined workflow, including:

(1) extraction of OpenStreetMap (OSM) features for user-defined study areas;

(2) semantic classification of polygon features using large language models;

(3) detection and filtering of change pixels using the LandTrendr time-series algorithm;

(4) recommendation of city-specific sampling parameters based on a six-dimensional urban typology framework.


This system enables reproducible multi-temporal sample generation, spatial heterogeneity validation, and fine-scale classification support across diverse urban settings. Furthermore, this system can operate in parallel with the usual land cover sample selection and subsequent classification processes.

We applied PRTS-AI to map the urban evolution of diverse cities in Liaoning and Shandong provinces, China, from 2000 to 2020. The framework achieved an overall mapping accuracy of ~80%, with residential categories reaching 90%. Beyond mapping, we utilized the fine-grained Local Climate Zone (LCZ) metrics generated by the system to investigate the transferability of samples. Through Principal Component Analysis (PCA) of residential morphologies, we quantitatively identified that cities cluster into distinct typologies driven by macro-factors (e.g., coastal vs. resource-based industrial cities) rather than administrative hierarchies. These findings challenge the assumption of universal sample transferability, suggesting that sample migration is most effective within specific urban typologies. Consequently, PRTS-AI incorporates a typology-based parameter recommendation module to guide city-specific sampling. This study presents a scalable, AI-empowered solution for urban mapping and offers new insights into the spatiotemporal heterogeneity of urban forms.


However, limited sample transferability may still be achieved between cities with similar characteristics, based on a preliminary six-dimensional classification framework.

PRTS-AI provides a lightweight, reproducible, and extensible solution for urban LULC research, supporting both academic investigations and practical urban planning applications.

How to cite: Tian, T., Yu, L., Chen, B., and Gong, P.: From Generative Sampling to Urban Typology: A PRTS-AI Supported Framework for Multi-Decadal Urban LULC Mapping and Cross-City Transferability Analysis, EGU General Assembly 2026, Vienna, Austria, 3–8 May 2026, EGU26-13942, https://doi.org/10.5194/egusphere-egu26-13942, 2026.

The net zero (NZ) agenda is one of the foremost planetary challenges facing urban policymakers - presenting both localised impacts, along with transnational co-operation and governance challenges. Data is fundamental to measuring policy success and failure and taking informed intervention decisions, and global Earth Observation data has enhanced evidence bases in terms of where local actions are needed. In the face of evolving national politics, it is common for city-regions to lead on NZ policy. However, the distribution of multi-level powers and resources fundamentally shapes what urban leaders can do and who they need to work with to respond to the climate emergency. Given this complex policy architecture, progress towards NZ is dependent on the effective use of data. Many intermediate city-regions need support to build capacity and marshal data effectively, and questions about which data sources to deploy at specific contexts can be difficult to resolve. This leads to the possibility for a gap between the sophistication of data which may be able to support policymakers – increasingly available from breakthrough techniques and modelling – and capability, governance and communication issues in subnational policymakers’ ability to act. Starting with the end users of data at city-region level, we explore the need for better understanding between the policy and data/science communities.

How to cite: Allan, G., Oda, T., and Waite, D.: How does the growing availability of novel data interact with the uses of data by policymakers in city-regions on their journey to net zero?, EGU General Assembly 2026, Vienna, Austria, 3–8 May 2026, EGU26-14570, https://doi.org/10.5194/egusphere-egu26-14570, 2026.

EGU26-16322 | Posters virtual | VPS31

Feeling at Home as a Dimension of Resilience in Architecture for Extreme Environments  

Mónica Alcindor, Francesco Salese, Valentino Sangiorgio, Alexandra M. Araújo, Pedro F. S. Rodrigues, and Emília Simão

As human exploration advances into increasingly hostile and isolated environments, such as extraterrestrial habitats on Mars, the Moon, or deep-sea stations, the concept of resilience must evolve beyond its traditional technical and physiological dimensions.

This need becomes particularly critical in contexts of long-duration habitation, where survival alone is insufficient to guarantee long-term operational stability and human wellbeing.

Central to this assertion is the recognition that resilience entails examining construction in relation to permanence, which may also be understood as a sense of feeling at home, shifting resilience from a purely performance-based concept to a relational and experiential condition.

This perspective requires redirecting science, technology, and design toward the conditions that enable habitation to become sustainable, meaningful, and socially durable.

This includes environmental adaptation, understood as the strategic use of local raw materials and regenerative systems, reducing dependency on external supply chains and increasing environmental compatibility, as well as the processes accompanying construction, which involve the complex relationships between these local materials, the tools, crafts, and other elements that make construction possible.

These construction–material ecologies play a decisive role in transforming temporary shelters into places of permanence.

Finally, it encompasses cultural embeddedness, which acknowledges the importance of cultural identity, symbolic practices, and sensory experiences that converge in the creation of an atmosphere of resilience, influencing perception of safety, cohesion, and long-term habitability.

The literature on this concept is fragmented due to the complexity and interdisciplinary nature of the aspects involved in the state of feeling at home.

Architecture, design, sociology and anthropology, nutrition, indoor environmental quality (thermal, acoustic, lighting, olfactory), tactile experience, physical activity, structural safety, and risk perception all contribute to this condition, yet are rarely addressed within a unified framework.

A common view across disciplines is missing in the related literature, yet it is of fundamental importance to understand and to design the future of resilient spatial architecture, both in extraterrestrial settings and in climate-stressed environments on Earth.

This abstract proposes a theoretical framework for understanding resilience in these terms, emphasizing the integration of cultural, psychological, material, and collaborative factors in the sustainable design of long-term human settlements in hostile environments.

By reframing resilience as the capacity to sustain a sense of “being at home”, the framework offers a shared conceptual ground for interdisciplinary dialogue across environmental sciences, engineering, architecture, and the social sciences.

 It challenges the prevailing techno-centric framing of resilience in extreme environments, arguing instead for a holistic approach that embraces human complexity, cultural roots, and collaborative innovation, with direct implications for climate adaptation, remote communities, and future off-Earth settlements.

How to cite: Alcindor, M., Salese, F., Sangiorgio, V., Araújo, A. M., Rodrigues, P. F. S., and Simão, E.: Feeling at Home as a Dimension of Resilience in Architecture for Extreme Environments , EGU General Assembly 2026, Vienna, Austria, 3–8 May 2026, EGU26-16322, https://doi.org/10.5194/egusphere-egu26-16322, 2026.

India, with its rapid urbanisation, faces high pollution levels and continues to fail to meet World Health Organisation (WHO) standards, accounting for 17 of the 30 most polluted cities globally.  The annual economic losses incurred due to its polluted air are equivalent to almost 3 per cent of the nation’s GDP.  Effective air pollution management requires adequate budgetary support and resource allocation. To address this, the National Clean Air Programme (NCAP), launched in 2019, is India’s flagship programme aimed at achieving a 40 per cent reduction in particulate concentration by 2026 in 130 non-attainment cities. NCAP implementation is supported through multiple funding streams, including convergence of existing national schemes like Smart Cities Mission, Swachh Bharat Mission, etc., as well as Fifteenth Finance Commission (XV-FC) and NCAP grants. Through this, India established a framework for financing clean air action, but challenges related to capital absorption and impact persist. As of October 2025, only 59.15 per cent of the NCAP funds and 77 per cent of XV-FC funds have been utilised, and by 2024-25, only 25 out of 130 cities have reduced PM 10 levels by 40 per cent.

This study critically examines the evolution of the fund disbursal mechanism (pre-requisites, performance assessment criteria and disbursement) over the years, by tracing the fund flow mechanism and Portal for Regulation of Air pollution in Non-Attainment cities (PRANA) records. Furthermore, it compares allocation versus absorption and assesses structural and operational complexities that limit the impact of fund utilisation and overall cost-effectiveness. This study leverages a mixed-methods approach, integrating insights from secondary literature and city-level field consultations. The analysis identifies a set of design and implementation constraints, including limited mechanisms for assessing the effectiveness of fund utilisation, sectoral prioritisation that is not consistently aligned with air quality outcomes, weak interdepartmental coordination and capacity limitations at the city level. It also highlights inadequate recognition of city-level initiatives within performance assessment frameworks, the absence of a sufficiently targeted and results-oriented approach, and delays in state-level financial systems that affect the timeliness of fund disbursal, and in turn, the overall progress of the programme. In addition, issues pertaining to data availability, pollution monitoring representativeness, and operation and maintenance requirements continue to influence programme performance. The study emphasises the value of integrating procedural and statutory costs and considerations into financial planning processes, strengthening institutional capacities and promoting effective fund utilisation. The findings aim to inform policy deliberations on air quality governance and financing in India. 

How to cite: Tiwari, A., Srivastava, R., and Goel, U.: Fund Flows and Absorption Challenges under India’s National Clean Air Programme (NCAP) — Evidence from public financial management systems and city-level consultations, EGU General Assembly 2026, Vienna, Austria, 3–8 May 2026, EGU26-17008, https://doi.org/10.5194/egusphere-egu26-17008, 2026.

EGU26-17758 | ECS | Posters virtual | VPS31

Prioritization of planetary health through health technology assessment: A scoping review  

Andres Madriz Montero, Frederike Kooiman, Francis Ruiz, Jane Falconer, Vanessa Harris, and Fiammetta Bozzani

Background

Policymakers lack structured, evidence-based processes and robust value assessments to guide planetary health investments. Health technology assessment (HTA)—a well-established framework for evidence-informed priority setting—has been proposed to address human and planetary health challenges under climate change. We aimed to assess whether existing evidence on adaptation can inform the prioritisation of planetary health interventions by examining their alignment with HTA criteria and decision-support tools.

Methods

We conducted a scoping review of adaptation interventions targeting climate-sensitive diarrheal disease or its determinants. Nine databases were searched from inception to May, 2025: BIOSIS Citation Index, CINAHL Complete, Econlit, Embase Classic+Embase, Global Health, GreenFILE, Medline ALL, Scopus and Web of Science Core Collection. Data was extracted on climate hazards, adaptation characteristics, outcomes, and HTA-relevant dimensions. Narrative synthesis and evidence gap maps were used to summarise patterns and identify gaps.

Findings

In total, 2924 studies were identified of which 88 studies describing 129 distinct adaptations were analysed. The findings highlight a disparate evidence base, with minimal alignment with HTA evaluative criteria or tools that facilitate prioritization within HTA, such as standardized criteria, economic evaluation and methods for addressing uncertainty.

Interpretation

As climate change alters diarrheal disease patterns, governments must balance investments between current service delivery and future climate risks. Evidence on adaptation for diarrheal disease remains limited to inform such trade-offs from an HTA perspective. These findings highlight research needs for advancing adaptation evaluation and evolving HTA from a human to a planetary health focus.

How to cite: Madriz Montero, A., Kooiman, F., Ruiz, F., Falconer, J., Harris, V., and Bozzani, F.: Prioritization of planetary health through health technology assessment: A scoping review , EGU General Assembly 2026, Vienna, Austria, 3–8 May 2026, EGU26-17758, https://doi.org/10.5194/egusphere-egu26-17758, 2026.

EGU26-17834 | ECS | Posters virtual | VPS31

An Early Warning System for sand fly-borne diseases in the Iberian Peninsula 

Sergio Natal, Daniel San-Martín, Carla Maia, Rafael Marme, Eduardo Berriatua, Elena Verdú-Serrano, Jose Risueño, Pedro Pérez-Cutillas, Maribel JImenez, and Ricardo Molina

Climate-sensitive vector-borne diseases are increasingly influenced by environmental and climatic variability, posing growing challenges for public health preparedness under climate change. Within the Planet4Health project, an Early Warning System (EWS) is being developed to support anticipatory decision-making for climate-sensitive diseases by integrating climate, environmental, and epidemiological information into operational risk products.

This contribution presents an EWS focused on the sand fly vector (Phlebotomus spp.) and leishmaniasis over the Iberian Peninsula, using machine learning–based modelling approaches. The system integrates high-resolution climate data, climate-derived indicators (e.g. temperature, humidity, and precipitation-related indices), land and environmental variables, and vector presence information to model conditions favourable for sand fly activity and disease transmission. The modelling strategy prioritises interpretable machine learning techniques to ensure transparency and usability for public health and veterinary stakeholders.

The EWS operates across multiple temporal scales, addressing short-term and seasonal forecasts, while also incorporating climate projections to assess potential future changes in  environmental suitability for sand flies and associated disease risk. Machine learning models are trained and evaluated using historical climate and entomological data, capturing non-linear relationships between environmental drivers and vector presence while explicitly accounting for uncertainty. Model outputs are translated into spatially explicit risk maps and alert-oriented indicators designed to support operational surveillance and decision-making.

Results from the Iberian sand fly–leishmaniosis case study demonstrate that the EWS successfully reproduces known spatial patterns of vector suitability and seasonal dynamics across the Peninsula, as well as interannual variability linked to climatic anomalies. The modular and data-driven design of the system supports adaptation of the framework to other regions and climate-sensitive diseases, in line with the broader objectives of Planet4Health.


Funding: The PLANET4HEALTH consortium is funded by the European Commission grant 101136652. The five Horizon Europe projects, GO GREEN NEXT, MOSAIC, PLANET4HEALTH, SPRINGS, and TULIP, form the Planetary Health Cluster. The data for EDENext was obtained from the Palebludata website (https://www.palebludata.com). The data for Vectornet was obtained from the ECDC.

How to cite: Natal, S., San-Martín, D., Maia, C., Marme, R., Berriatua, E., Verdú-Serrano, E., Risueño, J., Pérez-Cutillas, P., JImenez, M., and Molina, R.: An Early Warning System for sand fly-borne diseases in the Iberian Peninsula, EGU General Assembly 2026, Vienna, Austria, 3–8 May 2026, EGU26-17834, https://doi.org/10.5194/egusphere-egu26-17834, 2026.

EGU26-19141 | ECS | Posters virtual | VPS31

Towards a citizen-based green transition: Nature-Based Solutions in mediterranean areas: CARDIMED project 

Emanuela Rita Giuffrida, Liviana Sciuto, Giuseppe Luigi Cirelli, Ainhoa Quina Gomez, Diana Beatriz Muñoz Gonzalez, Brais Garcia Fernandez, Andres Felipe Zamudio Correa, and Feliciana Licciardello

Mediterranean territories are increasingly exposed to growing environmental fragility, risks linked to climate change and associated environmental disasters, as well as persistent socioeconomic challenges exacerbated by long-established patterns of urbanization. In this context, nature-based solutions (NBS) have been promoted by European policy frameworks as key tools for addressing these challenges. However, despite their growing political relevance, NBS often encounter barriers to implementation related to low public acceptance, limited social legitimacy, concerns about environmental and social justice, and insufficient integration of local knowledge and everyday practices.

This study addresses this gap by examining how local communities perceive, interpret, and interact with NBS in Mediterranean contexts through public participation processes in urban environments. The analysis focuses on several case studies located in Italy (Catania and Ferla, Demo 4), France (Saint-Jérôme and Saint-Charles, Marseille, Demo 5), Spain (Zaragoza, Demo 6), and Cyprus (Nicosia, Demo 9), within the CARDIMED project. These cases include various implementations of NBS, such as rain gardens, vertical green walls, green facades with vertical gardening and hydroponic systems, photobioreactor systems, biological drainage channels, and other nature-based interventions.

The study is theoretically grounded in socio-ecological governance and sustainability transition theories, conceptualizing NBS not only as technical measures but as relational and well-being-oriented solutions capable of reshaping human-environment relationships and strengthening social cohesion The participatory methodology draws on behavioral economics principles to analyze the underlying human behaviors, attitudes, and perceptions that condition NBS acceptance. To explore these dynamics, structured focus groups were conducted with key community representatives  (5 - 14 participants per group) to investigate shared perceptions, experiences, and concerns towards NBS, as well as their role in shaping narratives on water conservation, climate resilience, and sustainable land-use practices. The qualitative data were then analyzed using content analysis and ATLAS.ti software.

The results indicate that participatory processes play a decisive role in improving the awareness, legitimacy, and long-term governance of NBS, while revealing the structural and institutional constraints that risk undermining their transformative potential. These findings provide critical insights and pave the way for further investigation into justice-based and socially rooted NBS implementation pathways, supporting greater societal acceptance and strengthening collective ownership.

How to cite: Giuffrida, E. R., Sciuto, L., Cirelli, G. L., Quina Gomez, A., Muñoz Gonzalez, D. B., Fernandez, B. G., Zamudio Correa, A. F., and Licciardello, F.: Towards a citizen-based green transition: Nature-Based Solutions in mediterranean areas: CARDIMED project, EGU General Assembly 2026, Vienna, Austria, 3–8 May 2026, EGU26-19141, https://doi.org/10.5194/egusphere-egu26-19141, 2026.

EGU26-20080 | Posters virtual | VPS31

Designing mitigation pathways in Czech agriculture 

Eliška Krkoška Lorencová, Lenka Suchá, Magdaléna Koudelková, and Zuzana Harmáčková

Climate change adaptation and mitigation take place in a complex world associated with deep uncertainties related to external factors, among others population growth, new technologies, socio-economic developments and their subsequent impacts (Haasnoot et al., 2013, 2024). Therefore, there is a need for flexible framework that can respond to these challenges, bridge the social and environmental sciences and support climate change mitigation. Scenario planning can assist in developing integrative mental models to deliver pathways of change while incorporating alternative policies, evolving innovative practices and management options (Sroufe and Watts, 2022). The fundamental strength of the pathways approach is their ability to deal with uncertainty by assessing possible future impacts and navigating across multiple future trajectories. Pathways are designed to achieve future vision and assess whether the desired objectives have been accomplished (Coulter, 2019). Specifically, this approach can help to explore potential future trajectories, investigate innovation for carbon sequestering and more sustainable agriculture (Sroufe and Watts, 2022). So far, limited literature concerning development of pathways approach to GHG mitigation in agriculture exists.

Our approach aims to combine SSPs (Shared-socioeconomic pathways) downscaled for the Czech Republic within AdAgriF project with Mitigation pathways developed for Czech agriculture. Such integration enables us to assess the full potential of particular SSP-pathway combinations while considering future uncertainties. These SSP-independent pathways are not tied to a single SSP storyline, but instead each pathway is assessed for robustness across SSPs. This approach avoids over-commitment to one socio-economic future and highlights no-regret and robust mitigation pathways (bundles of measures).

This presentation highlights the process of interdisciplinary cooperation in order to support the pathway co-development, which involves exploring potential trajectories of pathways and their mitigation measures as well as SSPs with modelling using various agro-ecosystem simulation models that will be applied.


References:

Haasnoot, M., Di Fant, V., Kwakkel, J., & Lawrence, J. (2024). Lessons from a decade of adaptive pathways studies for climate adaptation. Global Environmental Change, 88, 102907. https://doi.org/10.1016/j.gloenvcha.2024.102907

Haasnoot, M., Kwakkel, J. H., Walker, W. E., & Ter Maat, J. (2013). Dynamic adaptive policy pathways: A method for crafting robust decisions for a deeply uncertain world. Global Environmental Change, 23(2), 485–498. https://doi.org/10.1016/j.gloenvcha.2012.12.006

Sroufe, R., & Watts, A. (2022). Pathways to Agricultural Decarbonization: Climate Change Obstacles and Opportunities in the US. Resources, Conservation and Recycling, 182, 106276. https://doi.org/10.1016/j.resconrec.2022.106276

How to cite: Krkoška Lorencová, E., Suchá, L., Koudelková, M., and Harmáčková, Z.: Designing mitigation pathways in Czech agriculture, EGU General Assembly 2026, Vienna, Austria, 3–8 May 2026, EGU26-20080, https://doi.org/10.5194/egusphere-egu26-20080, 2026.

The most critical blind spot in contemporary climate crisis response is the reliance on standardized macro-metrics, which obscure the specific reality of individual suffering. Just as economics uses consumer sentiment to capture household realities and meteorology uses apparent temperature to reflect physiological truths, occupational safety must transition toward integrating perceived risks that exist beyond mere numerical thresholds. This study argues that human perception functions as a high-fidelity biological integration of environmental stressors and conceptualizes it as a Perceptual Trigger: an embodied risk signal with diagnostic and policy relevance. The 2023 fatality of a young logistics worker in Korea illustrates the lethal failure of current systems; while sensors recorded ambient conditions within regulatory thresholds, the system failed to register the worker’s chest tightness—a critical physiological survival signal.

To bridge this gap, a Living Lab for Heatwave Adaptation was implemented in August 2025, engaging 30 port workers from Incheon and 6 technicians from a specialized manufacturer of surface treatment additives as active co-creators. In this study, workers were not treated as mere subjects for data extraction but were empowered as epistemic agents who fundamentally identified and defined hazards within their real-world micro-climates. This study employed the Living Lab methodology as a requisite mechanism to derive Worker Perception Data, which can only be captured within the complex real-world context of the field. Through the systematic qualitative analysis of this co-creation process, the researcher demonstrated that complex heat risks—such as localized radiant heat, engine emissions, and entrapped micro-climates—which are systematically overlooked by standardized sensor arrays, can be effectively rendered into data via worker perception.

The core contribution of this research lies in its translational process: converting Worker Perception Data into systematic risk signals (Information), consolidating them into collectively validated Evidence, and establishing the Policy Grounds for the right to stop work. The researcher proposes a Complementary Governance Model that precisely fills the blind spots of technical sensor monitoring with the acute sensitivity of worker perception data, arguing that this model is a vital mechanism for ensuring site-specific climate adaptation. By framing the datafication of lived experience as an act of Industrial Democracy, this approach serves as an essential interface for connecting grassroots experience with institutional decision-making.

How to cite: Kim, J.: Beyond Metric-Centric Adaptation: Redefining Occupational Heatwave Governance through Living Lab Co-creation, EGU General Assembly 2026, Vienna, Austria, 3–8 May 2026, EGU26-20084, https://doi.org/10.5194/egusphere-egu26-20084, 2026.

EGU26-20253 | Posters virtual | VPS31

Progress of the Twin-ER project: pilot digital twin for earthquake risk 

Alejandra Staller, Jorge Gaspar-Escribano, Yolanda Torres, Sandra Martínez-Cuevas, José Juan Arranz, César García-Aranda, Teresa Iturrioz, and José Luis García Pallero and the Twin-ER Team

We present the progress of the project Twin-ER: Pilot Digital Twin for Earthquake Risk. The goal of the project is the integration of digital models of the city and the Earth into the structure of a digital twin, focused on seismic risk.

The Earth model includes the generation of new seismic source models based on maps correlating surface deformation and seismic activity rates. Deformation maps will be determined through the analysis of GNSS time series and InSAR images for several dates. Seismic activity rates will be calculated by combining statistical analyses of the seismic catalog with mechanical analyses of earthquake-related stress changes in the crust. The derived maps will show location-, magnitude-, and time-dependent activity rates. Seismic source models will form the basis for the development of seismic hazard maps and constitute the main component of the Earth model.

The city model integrates innovative exposure models based on Cadastral data, enhanced with machine learning and deep learning algorithms to identify building typologies and their seismic vulnerability. These analyses will incorporate data of different nature, such as cadastral reference value or exposure time to high temperatures, with the aim of extending the exposure to a multi-hazard and multi-risk context. The exposure and vulnerability models constitute the main component of the city model.

By combining seismic hazard models on one hand, and exposure and vulnerability models on the other, the seismic risk model will be obtained. This model represents the expected damage and losses in a city in the event of an earthquake. Therefore, it is a crucial piece of information for proposing risk mitigation measures and planning emergency response.

Both Earth and city models are embebed into the digital twin seismic risk. This digital twin is conceived in a pilot phase. The model will be fed with the results of risk simulations, which can be visualized in a web environment, leaving aspects of data loading automation from updated sensors or external servers and subsequent simulations with that updated data for future developments.

The project is applied in two study areas of similar size but different, complementary characteristics. One is southeastern Spain, where (1) seismic activity is moderate, and major earthquakes occur rarely, (2) cities have a relatively old building stock and are more vulnerable to earthquakes, and (3) the availability and accessibility to cadastral data are optimal. The other study area is El Salvador, where (1) there is high seismic activity with frequent large earthquakes, (2) cities have a relatively modern building stock with abundant informal construction, and (3) there is no free access to cadastral data.

 The advances presented here include the UML model of the entire digital twin, the seismic activity and deformation maps in SE Spain, and the city 3D models of two scenarios of application.

How to cite: Staller, A., Gaspar-Escribano, J., Torres, Y., Martínez-Cuevas, S., Arranz, J. J., García-Aranda, C., Iturrioz, T., and Pallero, J. L. G. and the Twin-ER Team: Progress of the Twin-ER project: pilot digital twin for earthquake risk, EGU General Assembly 2026, Vienna, Austria, 3–8 May 2026, EGU26-20253, https://doi.org/10.5194/egusphere-egu26-20253, 2026.

EGU26-20658 | Posters virtual | VPS31

Assessing Agricultural Production within Planetary Boundaries using an Integrated Monitoring and Hybrid Modelling Approach 

Krishnagopal Halder, Amit Kumar Srivastava, Bruna Almeida, Larissa Nowak, Mahlet Degefu Awoke, Heiko Stuckas, Susanne Fritz, Katharina Helming, and Frank Ewert

Planetary Boundaries (PBs) define biophysical limits that safeguard Earth system stability. Exceeding these limits undermines ecosystem services, food security, economic stability, and climate resilience. Humanity is currently transgressing several of the PBs, demanding integrative and transformative research approaches that connect biophysical monitoring, sustainability targets, and societal decision-making. Despite its conceptual strength, the PB framework remains difficult to operationalize for regional agricultural systems. Global-scale assessments obscure the pronounced spatial heterogeneity of farming landscapes, where localized exceedances in nitrogen cycling, freshwater use, climate sensitivity, and biosphere integrity accumulate to drive broader Earth system risks. Consequently, there are limited guidance on where, how, and under which biophysical constraints agriculture can remain productive without breaching local environmental limits. This study proposes an integrated monitoring and modelling paradigm to assess regional agricultural production within planetary boundaries.

Our method moves beyond static, indicator-based assessments toward a dynamic, process-aware evaluation of local biophysical variables. We integrate high-resolution climate, soil, and land-use data with a spatially explicit crop model (SIMPLACE) to define regional control variables, including yield thresholds, nitrate leaching, and water-stress limits. To address structural uncertainties and capture non-linear climate-crop-soil interaction, we develop a hybrid modelling approach that couples SIMPLACE with machine learning algorithm (XGBoost).

Using SSP5-8.5 projections, we quantify specific yield and environmental constraints for Winter Wheat and Silage Maize in the Berlin–Brandenburg region in Germany. Hybrid simulations significantly outperform standalone process-based models, reducing mean absolute percentage error by ~9% for Winter Wheat and yielding consistently higher skill for Silage Maize. Our results reveal that emerging local boundaries are increasingly governed by compound climate extremes, particularly heat stress and precipitation deficits during flowering and early grain filling.

By framing PBs at the regional scale, hybrid modelling approaches enable the identification of conditions under which agricultural productivity, climate adaptation, and environmental integrity remain compatible—and where biophysical limits impose fundamental constraints. This approach offers a transferable pathway for embedding planetary stewardship into regional agricultural planning, climate adaptation strategies, and land-system governance.

How to cite: Halder, K., Srivastava, A. K., Almeida, B., Nowak, L., Awoke, M. D., Stuckas, H., Fritz, S., Helming, K., and Ewert, F.: Assessing Agricultural Production within Planetary Boundaries using an Integrated Monitoring and Hybrid Modelling Approach, EGU General Assembly 2026, Vienna, Austria, 3–8 May 2026, EGU26-20658, https://doi.org/10.5194/egusphere-egu26-20658, 2026.

EGU26-21166 | ECS | Posters virtual | VPS31

Psychosocial effects and intervention challenges during the re-emergence of Crimean–Congo Hemorrhagic Fever (CCHF) in Senegal 

Fatou Ndoye, Mansour Sène, Albert Gautier Ndione, Abdourahmane Sow, Jean Augustin Tine, Marjan Leneman, Kees Boersma, Andree Prisca Ndour, and Helena Aminiel Ngowi

Climate change contributes to the emergence of multiple hazards, including zoonotic diseases whose transmission dynamics are closely linked to environmental and socio-ecological transformations. Following the Covid-19 pandemic, a re-emergence of CCHF was observed in Senegal, particularly in rural areas where livestock farming plays a central role. This emerging zoonosis, transmitted mainly through ticks and infected cattle, remains poorly understood by the general population and disproportionately affects women involved in agro-pastoral activities. While epidemiological responses currently use a One Health framework, the approach often lacks community inclusion and adequate consideration of mental health. Previous global health emergencies (Ebola and Covid-19) have led to social, psychological, and emotional disruptions, causing fear and reinforcing misconceptions about health measures and denial of disease, particularly in contexts where cultural beliefs and mistrust hinder public health interventions. This study analyses the psychosocial effects associated with the emergence of CCHF in order to identify key challenges for epidemic interventions within a broader context of climate-related health risks. A mixed-methods approach was conducted across eight regions of Senegal, combining surveys, observations, and in-depth interviews (IDIs). Quantitative surveys were administered to 434 livestock keepers at the household level, alongside interviews with 6 farmers to assess knowledge of zoonotic diseases and risk perception. In 2023, field observations focused on surveillance activities, followed in 2024 by IDIs with 10 directly affected individuals, including bereaved families, and 6 health professionals involved in case management. The findings reveal limited knowledge and low risk perception of zoonotic diseases among livestock keepers, who often rely on informal practices for disease management. High levels of psychological distress, including fear, panic, insomnia, and social stigma, were reported among patients, relatives, and communities. Isolation measures and restrictions on visits intensified suffering, eroded trust in response teams, and in some cases triggered hostility toward intervention actors. Health professionals experienced ethical dilemmas between their duty of care and fear of infection, exacerbated by harsh climatic conditions. The study highlights the need for systemic and multidisciplinary risk-reduction strategies that extend beyond biomedical control. This call for Integrating structured psychosocial support, community engagement, and culturally sensitive communication. Strengthening the links between environmental change, disease emergence, mental health, and social behaviour is essential to enhancing resilience and preparedness for future epidemics in climate-vulnerable contexts.
Keywords: emerging zoonotic diseases, CCHF, climate-related health risks, risk perception, psychosocial effects, epidemic intervention, Senegal.

How to cite: Ndoye, F., Sène, M., Ndione, A. G., Sow, A., Tine, J. A., Leneman, M., Boersma, K., Ndour, A. P., and Ngowi, H. A.: Psychosocial effects and intervention challenges during the re-emergence of Crimean–Congo Hemorrhagic Fever (CCHF) in Senegal, EGU General Assembly 2026, Vienna, Austria, 3–8 May 2026, EGU26-21166, https://doi.org/10.5194/egusphere-egu26-21166, 2026.

Despite great reductions in the global burden of diarrheal disease, it remains a leading cause of mortality among children under five years old. Climate change threatens these gains, as extreme weather events such as floods, droughts, and heavy rainfall following dry periods are associated with increased risk. The impacts of climate change on childhood diarrheal disease burden depend on interactions between climate hazards, vulnerabilities, and pathogen exposures, although pathogen-specific impacts are not well understood. Improved understanding of how hydrometeorological factors influence pathogen-specific diarrheal disease is needed to predict future diarrheal disease risk and inform preventive action. The SPRINGS project (Supporting Policy Regulations and Interventions to Negate aggravated Global diarrheal disease due to future climate Shocks) brings together scientists from multiple disciplines to collaborate with communities, public authorities, and policymakers to address these challenges within a Planetary Health framework. The case study in Akuse, Ghana integrates epidemiology, environmental sampling, and weather data.  

This study aims to determine how hydrometeorological variables influence the incidence of medically-attended diarrheal disease among children under five in Akuse, Ghana. More specifically, this study aims to assess whether the influence of hydrometeorological variables on diarrhea is direct or acts through intermediate impacts on water quality and other water, sanitation and hygiene (WaSH) factors. By identifying climate-sensitive transmission pathways, this study will improve projections of future diarrheal disease risk and identify potential targets for intervention to mitigate the impact of climate change on diarrheal disease in this area in Ghana. 

This two-year epidemiological study employs a case-control study design, with a nested case-crossover study. Children under the age of five presenting to four selected health facilities with and without diarrheal disease will be recruited as cases and controls, respectively. Surveys administered by local nurses will collect data about individual- and household-level risk factors, including WASH conditions and animal ownership. In addition, stool samples will be collected to estimate the attributable incidence of diarrheal disease due to four key diarrheal pathogens: rotavirus, Campylobacter, Cryptosporidium, and Giardia. Local weather conditions during the study will be monitored by weather stations positioned near each health facility. Throughout the study, water samples will be collected from various sources in the study area to be tested for multiple water quality parameters, including the presence of the four diarrheal pathogens of interest. Additionally, anthropological research will improve the understanding of human behaviours and perceptions related to diarrheal disease risk and climate change in this area.  

By linking weather variability, environmental pathogen presence, WASH factors, and child health outcomes, this study illustrates how a Planetary Health approach can improve understanding of climate-sensitive diarrheal disease risk and provide evidence to inform adaptation strategies and child health interventions in Ghana.

How to cite: Kooiman, F.: The influence of hydrometeorological variables on childhood diarrheal disease: A Planetary Health approach, EGU General Assembly 2026, Vienna, Austria, 3–8 May 2026, EGU26-22160, https://doi.org/10.5194/egusphere-egu26-22160, 2026.

EGU26-1311 | ECS | Posters virtual | VPS32

Black Carbon Exposure as a Risk Factor for Child Health in India 

Rajesh Bag


Black Carbon Exposure as a Risk Factor for Child Health  in India

Rajesh Bag1,2, Debajit Sarkar2, Ram Pravesh Kumar1, Sagnik Dey2,3

1School of Environmental Sciences, Jawaharlal Nehru University, New Delhi, India.

2Centre for Atmospheric Sciences, Indian Institute of Technology (IIT) Delhi, New Delhi, India.

3Adjunct faculty, Korea University, Seoul, South Korea.

Email: rajeshgeovu@gmail.com

Keywords: Black carbon; stunting; wasting; low birth weight.

Introduction

Black Carbon (BC), a short-lived climate pollutant and a major light-absorbing component of fine particulate matter (PM2.5) plays a dual role in driving climate change and adversely impacting human health. In India, persistently high levels of ambient PM2.5 are compounded by household air pollution from biomass combustion, resulting in chronic BC exposure across large sections of the population. Child undernutrition manifested as stunting, wasting, and Low Birth Weight (LBW) continues to be a critical public health challenge in India, contributing to elevated child morbidity, mortality, and long-term developmental deficits. Despite the biological plausibility linking BC exposure to quantifying associated health effects in the Indian context is limited. Addressing this gap, the present study investigates the association between chronic BC exposure and three key indicators of child undernutrition, thereby providing novel insights into the intersection of air pollution and child health.

Methodology

We utilized nationally representative data from the National Family Health Surveys (NFHS-4: 2015-16 and NFHS-5: 2019-21), comprising 437,908 children under five years of age. Among them 10,362 observations had missing mean BC exposure and 35,386 had missing information on fuel type, wealth index, mother Body Mass Index (BMI), mother age, mother education, residence, child sex and mother smoking status. These records were excluded from the analysis. After removing all missing values, the final analytic sample included 402,508 children. Monthly mean BC exposure (2010-2021) at 1 km × 1 km resolution was merged with geocoded DHS cluster coordinates (Dey et al., 2020). For stunting and wasting exposure was averaged from child birth to the month of interview. For in-utero exposure related to LBW, we averaged BC concentrations from 9th months prior to birth through the month of birth. Generalized Linear Model (GLM) and Generalized Linear Mixed Models (GLMM) were used to estimate associations between long-term BC exposure and odds of stunting, wasting, and LBW, adjusting for household fuel type, mother education, mother wealth index, residence, mother age, mother BMI, child gender and mother smoking status. We estimated the exposure response relationship using a Generalized Additive Model (GAM) incorporating a cubic spline for BC. Effect modification by all covariates was evaluated using multiplicative interaction terms. Stratified ORs with 95% uncertainty intervals were reported only for significant interactions. All models were adjusted for the same covariates.

Results & discussions

 After adjusting for confounders, the odds of stunting and wasting increased to 1.03 (95% UI 1.026-1.032) and 1.04 (95% UI 1.026-1.032) respectively for each 1 μg/m³ increase in long-term ambient BC exposure . Under the GAM framework the exposure response curves for stunting and wasting showed a monotonic increase with rising BC levels.


How to cite: Bag, R.: Black Carbon Exposure as a Risk Factor for Child Health in India, EGU General Assembly 2026, Vienna, Austria, 3–8 May 2026, EGU26-1311, https://doi.org/10.5194/egusphere-egu26-1311, 2026.

Small Island Developing States (SIDS) experience disproportionate vulnerability to natural and climate related hazards driven by geographic constraints, demographic trends, limited economic diversification and growing development pressures. In the Caribbean, flooding is one of the region’s most devastating and recurrent hazards, contributing to substantial socio-economic losses. Despite frequent events, many SIDS lack the long-term datasets needed to characterize flood behavior, particularly for coastal compound flooding, involving the interaction of multiple drivers such as storm surge, waves, tides, precipitation, runoff and river discharge. Climate change, including sea level rise, is expected to alter these processes and increase uncertainty in both magnitude and frequency.

Coastal ecosystems such as mangrove forests are increasingly recognized for their potential as Nature-based Coastal Solutions (NBCS), offering coastal protection alongside social, environmental and economic co-benefits. However, key gaps remain, including limited understanding of their flood mitigative properties across varying hydrodynamic conditions and stages of ecosystem maturity and health. Although numerical models are widely used to assess flood hazards, their ability to represent multiple interacting drivers and incorporate NBCS remains limited, a challenge that is particularly pronounced in data-sparse regions. Addressing these limitations requires field data to develop numerical models.

The relevance of these challenges becomes particularly clear in Trinidad’s South Oropouche River Basin (SORB), a low lying and highly flood prone watershed on the southwest coast that includes mangrove areas within the Godineau Swamp. This study therefore centers on collecting the necessary datasets and integrating them into the numerical modelling needed to characterize compound flooding in this basin. Field monitoring in SORB includes weather stations, water level loggers, short-term ADCP deployments, and a paired camera and water level logger system designed to capture flood depth and extent at a high resolution. Additional measurements including water quality parameters and vegetation characteristics from field surveys and satellite imagery, will support the mangrove related parameterization.

The modelling will be forced primarily using open-source datasets, with field observations used to assess their performance and suitability. Comparison of radar rainfall with in-situ measurements will enable the development of a bias-corrected relationship, allowing long-term radar datasets to be translated into site-specific rainfall inputs for compound flood modelling. These observations will be supplemented by historical datasets, including river discharge, Intensity–Duration–Frequency (IDF) curves, bathymetry and land cover. Thus, the numerical model will simulate the key hydrodynamic processes driving compound flooding while mangrove influences will be represented using vegetation-drag formulations to capture momentum dissipation and associated reductions in inundation. Field observations will be used to calibrate and validate the model, enabling spatial estimates of flood depth and extent under different forcing scenarios.

Field monitoring in SORB is expected to provide new insights into how flood drivers interact to generate inundation, as well as emerging trends and patterns, while deterministic modelling will quantify the degree to which mangroves mitigate flooding. Together, the data-collection and modelling approaches offer a practical means of improving compound flood assessment in regions with limited long-term observations and support a more holistic evaluation of NBCS for SIDS.

How to cite: Williams, A.: Field Data Collection to Support the Numerical Modelling of Mangrove Contributions to Compound Flood Mitigation, EGU General Assembly 2026, Vienna, Austria, 3–8 May 2026, EGU26-1439, https://doi.org/10.5194/egusphere-egu26-1439, 2026.

Mangrove forests provide critical shoreline protection in tropical and sub-tropical regions through wave attenuation, soil accretion and floodwater storage. These protective mechanisms relate to both ecosystem functionality and persistence (Lovelock et al. 2024). Multiple studies over the past decades have effectively shown that mangrove forest extent can lead to reduced wave heights between 50-99%, with vegetative characteristics slowly being introduced as a critical element (McIvor et al. 2013). Increasing evidence has identified that the eco-geomorphological conditions shape the consistency and scale of protection but have not been properly considered. Ecological, hydrodynamic and geomorphological processes which occur at various temporal and spatial scales influence species-specific interactions, functional type formations and habitat structure (Gijsman et al. 2021). Mangrove forests can develop into distinct ecotypes over time (Twilley and Rivera-Monroy 2009), directly influenced by tidal exchanges between the mangrove forests and nearshore environments, affecting the level of productivity within the mangroves (Mitsch and Gosselink 2015). These interactions influence the mangrove forest structure through variability in sediment deposition rates, biomass accumulation, seedling recruitment and overall forest productivity (van Hespen et al. 2023).

Since variations in eco-geomorphological features affect mangrove functionality and persistence at multiple scales, this research will investigate how these differences can affect the ability of mangroves to provide consistent coastal protection. Building on existing modelling approaches (Beselly, van Der Wegen, and Roelvink 2025), the aim is to design an ideal model capable of capturing nuanced interactions between mangrove ecosystems and the geomorphological features. For instance, predictive models (WAPROMAN), designed to capture wave propagation through a uniform forest, utilised drag coefficients (McIvor et al. 2013), while a measure of mangrove forest extent seaward followed a mechanistic approach using the window of opportunity for seedling establishment predictions (van Hespen et al. 2023).

The current workflow will identify and isolate the key drivers and traits of crucial mangrove forests that affect mangrove functionality and persistence, for parameterisation. As a preliminary approach, these parameters will be integrated into a numerical model, incorporating elements from previous mechanistic and empirical approaches, modified to ascertain and accommodate the variability in mangrove eco-geomorphology and sediment dynamics (Gijsman et al. 2021). This process can facilitate the quantification of impact and identify key thresholds that these selected attributes of mangrove forests have on the function and persistence related to long-term coastal protection. Through this integration of multiple layers of eco-geomorphological variability, this work offers insights into how mangrove systems work as Nature-based Solutions and how they thrive within our changing climate.


How to cite: Emmanuel, S.: Mangrove traits influencing coastal protection under varying environmental and eco-geomorphic conditions. , EGU General Assembly 2026, Vienna, Austria, 3–8 May 2026, EGU26-1457, https://doi.org/10.5194/egusphere-egu26-1457, 2026.


Northern Pakistan’s mountain regions are changing quickly under climate change. Rising temperatures, shifting rainfall, and more frequent extreme events are increasing landslides, flash floods, glacial lake outburst floods, and related hazards. At the same time, communities are expanding into more exposed locations, often without reliable data or early warning systems. In many high elevation valleys, environmental monitoring is minimal or absent, which makes safe planning and climate adaptation difficult.

In response, AI Geo Navigators developed a practical geospatial tool and tested it in Gilgit Baltistan, Swat, and Chitral. The approach combines freely available satellite imagery, digital elevation models, drone surveys, and open datasets to map multiple, overlapping risks. These include unstable slopes, flood prone areas, proximity to seismic zones, and locations affected by past disasters. The hazard information is analysed together with settlement locations, roads, agricultural land, and surrounding ecosystems to better understand who and what is exposed.

A central part of the work was direct engagement with local communities. Rather than relying only on desk based analysis, field visits, mapping sessions, and conversations with residents were used to document past flood paths, landslide zones, and land use changes that are not visible in satellite data alone. This local knowledge helped correct gaps in the remote analysis and grounded the results in lived experience.

The results show that combining low cost geospatial tools with community input produces a much clearer and more realistic picture of risk in complex mountain terrain. The approach supports safer settlement planning, climate adaptation efforts, and improved local risk communication in areas where official monitoring and warning systems remain weak. It demonstrates that meaningful climate risk assessment in mountain social ecological systems does not require large budgets, but does require integration of technology with people who know the landscape best.

How to cite: Javid, A. and Ahmad, J.: Integrating Geospatial Intelligence and Community Knowledge to Assess Climate Risks in Mountain Social Ecological Systems of Northern Pakistan, EGU General Assembly 2026, Vienna, Austria, 3–8 May 2026, EGU26-2072, https://doi.org/10.5194/egusphere-egu26-2072, 2026.

EGU26-2312 | Posters virtual | VPS32

Mythogenic Mountain Landscapes and Shakta Sacred Geographies: Cultural Memory of Geodynamic Processes in the Indian Subcontinent 

Nigam Dave, Shrishti Kushwah, Ankita Srivastava, and Dharmanshu Vaidya

Mythogenic Mountain Landscapes and Shakta Sacred Geographies: Cultural Memory of Geodynamic Processes in the Indian Subcontinent

Nigam Dave, Shrishti Kushwah, Ankita Srivastava, Dharmanshu Vaidya


Mountain landscapes of India are characterised by active tectonics, complex relief, and frequent exposure to earthquakes, landslides, and hydrological disasters. While geospatial hazard research models these processes using physical datasets, culturally grounded responses to long-term environmental instability remain less expolored within landscape-based analyses. This paper examines mythogenic mountain landscapes by analysing how Shakta sacred geographies function as spatial expressions of cultural memory associated with geodynamic processes.


The study focuses on selected Shakta-associated sacred sites situated in tectonically and geomorphically dynamic regions, including Kamakhya (Nilachal Hill, Assam), Jwalamukhi/Jwala Devi (Kangra Valley, Himachal Pradesh), Naina Devi and Chintpurni (Shivalik foothills, Himachal Pradesh), and Jayanti at Nartiang (Jaintia Hills, Meghalaya). Using GIS-based spatial profiling, site locations are analyzed in relation to relief, drainage corridors, and regional deformation zones. We also comparatively interpret recurring mythic motifs and ritual-temporal practices.


The analysis reveals patterned concentrations of sacred sites along mountain–plain transitions and structurally complex landscapes associated with environmental volatility. By situating landscape-scale patterning rather than site-specific belief, the study invites cross-disciplinary discussion on the role of geomythology in geoheritage interpretation and risk awareness. Recognising such mythogenic landscapes suggests culturally grounded perspectives for disaster-risk communication in regions facing increasing multi-hazard pressures.

How to cite: Dave, N., Kushwah, S., Srivastava, A., and Vaidya, D.: Mythogenic Mountain Landscapes and Shakta Sacred Geographies: Cultural Memory of Geodynamic Processes in the Indian Subcontinent, EGU General Assembly 2026, Vienna, Austria, 3–8 May 2026, EGU26-2312, https://doi.org/10.5194/egusphere-egu26-2312, 2026.

Coastal cities in fragile and conflict-affected states face unprecedented challenges in maintaining infrastructure and protecting ecosystems. In Sudan, Port Sudan has recently emerged as the temporary administrative capital, experiencing rapid urban pressure alongside heightened climate vulnerability. This research evaluates the integration of Nature-based Coastal Solutions (NBCS), such as coral reef and mangrove preservation, into the city’s urban recovery framework. Utilizing GIS and satellite-based geoscience monitoring, the study assesses the current state of coastal assets and their protective capacity. A major barrier to implementing these solutions is the financing gap and high perceived risk in fragile economies. This study explores innovative financial frameworks, specifically the role of Development Finance Institutions (DFIs) in providing 'patient capital' and de-risking investments for sustainable coastal infrastructure. By combining interdisciplinary financial modeling with environmental assessment, the research proposes a strategic roadmap for financing resilient coastal protection. The findings demonstrate that NBCS can significantly reduce infrastructure restoration costs while serving as a vital catalyst for long-term economic stability and post-conflict recovery.

Final results, including a detailed comparative cost-benefit analysis and quantified financial projections, will be presented at the conference. This will provide a rigorous evidence-based framework for integrating Nature-based Solutions into Port Sudan’s post-conflict urban recovery.


How to cite: Ahmed, M.: Resilient Recovery: Financing Nature-based Coastal Solutions for Port Sudan’s Urban Infrastructure., EGU General Assembly 2026, Vienna, Austria, 3–8 May 2026, EGU26-2636, https://doi.org/10.5194/egusphere-egu26-2636, 2026.

Decarbonization is essential to combat climate change, but policies may unintentionally exacerbate inequities between communities. Although energy policy increasingly acknowledges equity concerns, most studies focus narrowly on distributional equity, often overlooking its procedural and contextual dimensions. Further, existing analytical tools used to inform policymaking rarely integrate all three aspects of equity systematically.

This study addresses these limitations by developing a framework for incorporating distributional, procedural, and contextual equity into decision-support models. The framework is applied to inform a strategy for the phaseout of natural gas power plants in California. Key equity-relevant metrics are identified through a structured literature review, and a large language model (LLM) is used with carefully designed prompts and operational definitions to weigh the relative importance of these metrics under different resource allocation (or shapes of justice) principles. This LLM-enabled procedure is used as a scalable, transparent method to rapidly synthesize the literature by systematically surfacing the range of interpretations reported in prior work and representing uncertainty in metric weights (rather than aiming for one optimized value). The resulting metric set is incorporated into a multicriteria decision-making (MCDM) model that assesses how different shapes of justice principles and equity metrics influence phaseout priorities. The framework is designed to accommodate broader stakeholder input and address common critiques of technocratic, top-down approaches. Together, these contributions introduce a novel methodological framework for integrating multiple dimensions of equity into energy transition decision-support models.


How to cite: Chowdhury, S.: Equity Consideration in Analytical Models Used for Decision Making: Conceptual Framework, and Case Study, EGU General Assembly 2026, Vienna, Austria, 3–8 May 2026, EGU26-2694, https://doi.org/10.5194/egusphere-egu26-2694, 2026.

EGU26-3848 | Posters virtual | VPS32

From Co-Design to Mainstreaming: Using Augmented Reality to Communicate Nature-Based Solutions for Water Resilience 

Tina Katika, Konstantinos Koukoudis, Alexis Touramanis, Panagiotis Michalis, and Angelos Amditis

Strengthening water resilience in Europe requires the widespread adoption of Nature-Based Solutions (NbS) that are easily understood, trusted and supported by citizens and local stakeholders. This study focuses on the development of an Augmented Reality (AR) engagement system designed to communicate how different NbSs function in real-world scenarios and address water-related challenges. The AR experiences were co-created with local communities through dedicated focus groups, co-design workshops and structured discussions with key stakeholders, ensuring that the content reflects local priorities and practical needs at each pilot location.

The AR system brings together a set of NbS demonstrations into a unified series of interactive experiences. These include: (i) soil restoration and small-scale water retention measures in dry island landscapes that can reduce runoff, prevent erosion and enhance soil water storage for agricultural resilience; (ii) green walls that can treat greywater within a public building, enabling its safe reuse for non-potable applications such as toilet flushing; (iii) urban NbSs (including pocket forests, bioswales, permeable surfaces and soil improvement) that can mitigate flooding, reduce urban heat stress, and enhance environmental quality; and (iv) hydroponic wall systems that support urban gardening by combining seasonal planting, traditional knowledge and water-efficient practices.

The AR campaigns integrate maps, 3D models, photographs and explanatory narratives to guide users through each process step-by-step (e.g. users can follow the flow of greywater through a treatment system or observe the gradual transformation of degraded land as NbS are applied). By making otherwise invisible processes tangible and spatially explicit, the AR mobile application enhances understanding of how NbS improve water availability, reduce flood risks, support local food production and contribute to healthier and more resilient living environments.

The next phase of the work focuses on real-world validation across various pilot areas, involving diverse user groups (including residents, farmers, students, local authorities, and planners) to interact with the AR experiences on site and obtain their feedback to refine content clarity, usability and relevance for local planning processes and everyday decision-making.

The use of the AR mobile application demonstrates how visual storytelling combined with participatory design and field-based feedback can enhance awareness, build trust and support the mainstreaming of NbSs, contributing to strengthened water resilience across Mediterranean and broader European contexts.

 Acknowledgement:

This research has been funded by European Union’s Horizon Europe research and innovation programme under CARDIMED project (Grant Agreement No. 101112731) (Climate Adaptation and Resilience Demonstrated in the MEDiterranean region).

How to cite: Katika, T., Koukoudis, K., Touramanis, A., Michalis, P., and Amditis, A.: From Co-Design to Mainstreaming: Using Augmented Reality to Communicate Nature-Based Solutions for Water Resilience, EGU General Assembly 2026, Vienna, Austria, 3–8 May 2026, EGU26-3848, https://doi.org/10.5194/egusphere-egu26-3848, 2026.

EGU26-3947 | Posters virtual | VPS32

Immersive Citizen Engagement for Climate-Resilient Rural–Urban Interfaces 

Kostas Naskou, Tina Katika, Alexis Touramanis, Konstantinos Koukoudis, and Angelos Amditis

Cities and their surrounding rural areas face growing pressures from climate change, environmental degradation, biodiversity loss, and social inequalities. Responding to these challenges requires approaches that not only use environmental data, but also actively involve citizens and local actors in understanding problems and shaping solutions. This contribution presents a European multi-country experience that explores how immersive technologies can support citizen participation, shared understanding, and evidence-informed discussion in rural–urban contexts. 

A multi-platform Extended Reality (XR) ecosystem was developed, combining mobile Augmented Reality (AR) and Mixed Reality (MR) head-mounted display applications. These tools were designed to present complex environmental, social, and territorial information through interactive and three-dimensional experiences. Six pilot co-creation laboratories were established in Greece, Spain, Germany, Austria, Lithuania, and the Czech Republic, providing structured spaces where policymakers, citizens, and local stakeholders could jointly explore challenges and opportunities at the rural–urban interface. The XR applications were validated through hands-on workshops and semi-structured interviews, allowing participants to interact with the content and provide direct feedback. 

The immersive experiences addressed six thematic domains known to support bi-directional rural–urban synergies and the development of well-being economies: (i) circular bioeconomy, (ii) ecosystem and biodiversity restoration, (iii) improved logistics and shorter value chains, (iv) user engagement, empowerment, and territorial awareness, (v) culture, landscape, and heritage access and promotion, and (vi) enhanced mobility. By visualizing these topics in three dimensions, participants were able to better understand connections, trade-offs, and future options that are often difficult to grasp through conventional maps or reports. 

The evaluation followed a structured user-engagement methodology, integrating pre- and post-experience questionnaires directly into the AR and MR applications. This enabled the collection of comparable qualitative and quantitative feedback across all pilot sites. Results show strong educational and communicative value, with 81% of participants reporting perceived learning gains and overall usability rated at 68%.  

Overall, the findings demonstrate how immersive technologies can complement citizen science approaches by strengthening inclusion, supporting dialogue between experts and non-experts, and improving environmental literacy. The approach shows clear potential to support participatory planning and climate adaptation efforts in rural–urban areas, contributing to more inclusive and informed decision-making for resilient and sustainable territories. 

Acknowledgement: 

This research has been funded by European Union’s Horizon Europe research and innovation programme under RURBANIVE project (Grant Agreement No. 101136597) (RUral-uRBAN synergies emerged in an immersIVE innovation ecosystem). 

How to cite: Naskou, K., Katika, T., Touramanis, A., Koukoudis, K., and Amditis, A.: Immersive Citizen Engagement for Climate-Resilient Rural–Urban Interfaces, EGU General Assembly 2026, Vienna, Austria, 3–8 May 2026, EGU26-3947, https://doi.org/10.5194/egusphere-egu26-3947, 2026.

EGU26-5175 | ECS | Posters virtual | VPS32

Accessibility-driven habitat vulnerability in the tropical mountain landscape of Idukki district, India 

Drisiya Jalaja and Sarmistha Singh

Mountain districts within biodiversity hotspots often experience increasing ecological pressure despite retaining extensive forest cover. In the Western Ghats of India, Idukki district has undergone rapid tourism expansion, infrastructure development, and land-use reconfiguration over the past decade. This study assesses how changes in urban nature accessibility and population demand influence ecosystem service distribution and habitat vulnerability using the InVEST modelling framework. Urban Nature Access and balance indicators accessibility, per-capita balance, and total population balance were evaluated alongside a Habitat Risk Assessment for 2011 and 2025. The results indicate a growing spatial mismatch between population demand and accessible natural spaces, with strongly negative urban nature balance values expanding across central and southern Idukki by 2025. Accessibility and population pressure have become increasingly concentrated along valley floors, plantation belts, and transport corridors, while large forested areas remain functionally inaccessible. Habitat Risk Assessment results show that human-modified land-cover classes experience disproportionately higher risk, with built-up areas exhibiting the highest mean risk (R̄ = 0.42), followed by plantations (R̄ = 0.38) and croplands (R̄ = 0.34). Deciduous forests display lower vulnerability (R̄ = 0.22), and water bodies remain largely unaffected (R̄ = 0.05). More than one-third of built-up and plantation landscapes fall within medium to high habitat risk categories. High-risk zones identified by the model spatially coincide with landslide-prone regions that experienced repeated slope failures during extreme monsoon years (2018–2020), particularly in tourism-intensive areas such as Munnar, Adimali, and Peermade. These patterns indicate that ecological vulnerability in Idukki is driven less by absolute forest loss than by accessibility-induced concentration of human activities within steep, geophysically fragile landscapes. The findings emphasize the importance of integrating accessibility-aware ecosystem service assessments with hazard-sensitive nature-based land-use planning to reduce ecological degradation and disaster risk while supporting sustainable tourism and development in the Western Ghats.

How to cite: Jalaja, D. and Singh, S.: Accessibility-driven habitat vulnerability in the tropical mountain landscape of Idukki district, India, EGU General Assembly 2026, Vienna, Austria, 3–8 May 2026, EGU26-5175, https://doi.org/10.5194/egusphere-egu26-5175, 2026.

EGU26-5739 | ECS | Posters virtual | VPS32

An Indicator Service Framework for assessing and integrating climate adaptation–mitigation interdependencies across spatial scales 

Ivan Murano, Gigliola D'Angelo, Venera Pavone, Paola Del Prete, and Giulio Zuccaro

As climate change impacts intensify, cities and regions are increasingly required to address adaptation and mitigation in parallel. In practice, however, these two dimensions are often planned and implemented separately, leading to missed co-benefits or unintended trade-offs. Thus, there is a growing need for traceable and operational methods capable of revealing, assessing, and integrating the interdependencies between adaptation and mitigation across sectors and spatial scales. To address this gap, this paper introduces the Indicator Service Framework (ISF), produced in the context of the ClimEmpower project (EU Horizon 2020) This methodological approach translates climate indicators into actionable insights, bridging the two fields of study to improve spatial analysis and local-to-regional decision-making.

The ISF operationalizes climate science by translating robust climate indicators into actionable policy insights. Its design is deliberately anchored in three core principles: multi-scale applicability, ensuring relevance from local to regional levels; data-agnostic design, allowing compatibility with any data source derived from hazard, exposure, and vulnerability assessments; and explicitness of decision logic. A central element of the ISF is the focus on identifying the most appropriate indicators for specific policy objectives, clearly establishing their relationship to the underlying climate risks and local conditions.

The framework employs a streamlined two-step process: first, indicator values are rigorously classified according to their scientific meaning,or against a defined benchmark (e.g., a European average or median value), which subsequently establishes the threshold for policy recommendations; second, they are standardized into harmonized classes. This standardization is crucial, as it enables systematic comparability across regions and facilitates the mapping of results to tailored recommendations. This mechanism is key to identifying concrete opportunities for co-benefits, such as mobility policies that simultaneously reduce emissions and enhance urban thermal comfort.

By structuring a clear pathway from climate data to policy decisions, the ISF functions as more than just a tool; it provides a clear strategic "reading frame" upon which climate actions can be anchored. This approach ensures that the resulting recommendations are systematically adapted to foster the overarching objective of 'climate resilient development' (IPCC 2022). The framework offers a practical contribution to integrated climate governance, enhancing stakeholder awareness and supporting more coherent, resilient, and sustainable strategies under conditions of multi-sectoral complexity.

How to cite: Murano, I., D'Angelo, G., Pavone, V., Del Prete, P., and Zuccaro, G.: An Indicator Service Framework for assessing and integrating climate adaptation–mitigation interdependencies across spatial scales, EGU General Assembly 2026, Vienna, Austria, 3–8 May 2026, EGU26-5739, https://doi.org/10.5194/egusphere-egu26-5739, 2026.

EGU26-6983 | ECS | Posters virtual | VPS32

A Satellite-Based Climatology of Fog and Low Stratus to Support Nature-Based Water Harvesting in Arid Areas of Morocco 

Abderrahim Mouhtadi, Driss Bari, and Soumia Mordane

 In arid and semi-arid landscapes like many areas in Morocco, addressing water scarcity requires innovative nature-based solutions (NbS). Fog and Low Stratus (FLS) clouds constitute a major atmospheric feature in Morocco, simultaneously representing a significant hazard for air, maritime, and road transportation and a valuable nature-based water resource for arid and semi-arid ecosystems through fog-water harvesting. However, effective implementation of such NbS depends on precise identification of viable locations and optimal collection periods. In a country characterized by strong climatic heterogeneity and limited ground-based observations, satellite remote sensing provides a critical means for assessing the spatial and temporal availability of this underutilized water source under current and future climate variability. This study introduces a novel nighttime FLS detection algorithm specifically designed for Morocco’s diverse climatic regimes, using only infrared observations from the Meteosat Second Generation (MSG) SEVIRI instrument. Hourly satellite data spanning 2020–2024 were processed to produce the first high-resolution, national-scale climatology of FLS occurrence over Morocco. Designed for the region's heterogeneous climates, the tool provides essential monitoring for assessing NbS potential. The algorithm was systematically validated using coincident hourly SYNOP observations from the Moroccan Directorate General of Meteorology network. Validation results demonstrate reliable performance, with a probability of detection exceeding 54%, a false alarm ratio close to 45%, and a frequency bias generally within 1.4. The resulting climatology reveals two major coastal hotspots of persistent FLS occurrence along Morocco’s Atlantic façade, in the Northwest and Southwest, both exhibiting pronounced seasonal and diurnal cycles. These regions coincide with areas of high potential for fog-water harvesting, offering a climate-resilient, nature-based solution to enhance water availability in water-stressed environments. These findings directly inform hydrological planning by pinpointing areas where fog harvesting projects are most likely to be effective and resilient. By providing spatially explicit and operationally robust information on FLS occurrence, this study supports the integration of satellite-based monitoring into the planning and upscaling of fog-water harvesting systems. The results contribute to broader NbS strategies aimed at improving water security, supporting ecosystem services, and strengthening climate adaptation in arid and semi-arid landscapes.

How to cite: Mouhtadi, A., Bari, D., and Mordane, S.: A Satellite-Based Climatology of Fog and Low Stratus to Support Nature-Based Water Harvesting in Arid Areas of Morocco, EGU General Assembly 2026, Vienna, Austria, 3–8 May 2026, EGU26-6983, https://doi.org/10.5194/egusphere-egu26-6983, 2026.

EGU26-7797 | Posters virtual | VPS32

No critical slowing down in the Atlantic Overturning Circulation in historical CMIP6 simulations 

Maya Ben Yami, Lana Blaschke, Sebastian Bathiany, and Niklas Boers

The Atlantic Meridional Overturning Circulation (AMOC) is a key component of the Earth’s climate system, and has been suggested to have multiple stable states. Critical slowing down (CSD) can detect stability changes in Earth system components, and has been found in sea-surface temperature (SST) based fingerprints of the AMOC. Here, we look for CSD in historical simulations from 27 models from the sixth Climate Model Intercomparison Project (CMIP6). We calculate three different CSD indicators for the AMOC streamfunction strengths at 26.5°N and 35°N, as well as for a previously suggested SST-based AMOC index (ASSTI) based on averaging SSTs in the subpolar gyre region. No model shows CSD in the ASSTI, which is in marked disagreement with the real-world. This lack of CSD is reflected in the AMOC streamfunctions in most models, although individual ensemble members in some models do show signs of CSD even under a conservative significance calculation. We thus conclude that: 1) The historical AMOC in CMIP6 models is not losing stability, 2) studies of AMOC stability must consider an ensemble of realisations, 3) no other physical process in the 1850-2014 period causes signs of CSD in North-Atlantic SSTs, and thus the CSD in the observed ASSTI is likely a sign of a change in the AMOC. This final result suggests that observed changes in the ASSTI could indicate a loss of stability in the real-world AMOC.

How to cite: Ben Yami, M., Blaschke, L., Bathiany, S., and Boers, N.: No critical slowing down in the Atlantic Overturning Circulation in historical CMIP6 simulations, EGU General Assembly 2026, Vienna, Austria, 3–8 May 2026, EGU26-7797, https://doi.org/10.5194/egusphere-egu26-7797, 2026.

EGU26-8304 | ECS | Posters virtual | VPS32

The effectiveness of Temporary Storage Areas for Natural Flood Management: Empirical evidence from a lowland catchment, UK 

James Bishop, Gareth Old, Ponnambalam Rameshwaran, Andrew Wade, John Robotham, David Gasca-Tucker, Ann Berkeley, Joanne Old, and David McKnight

Temporary storage areas (TSAs) are a nature-based solution for attenuating flood peaks through the temporary detention of floodwaters in small (up to 10,000 m3) storage ponds on hillslopes or floodplains. Despite their increasing prevalence as part of Natural Flood Management (NFM) schemes in the UK, empirical evidence demonstrating their capability to mitigate flooding at catchment scales is limited. Addressing this evidence gap is a key priority for informing future flood risk management policies.

In this study, we intensively monitored a prominent NFM scheme in the Littlestock Brook, a lowland rural sub-catchment (6.4 km2) of the River Evenlode in England. Ten TSAs providing a combined 25,000 m3 of flood storage were implemented between 2018 and 2020 to protect a flood-prone settlement. Measurements of river discharge (5 min), TSA stored volume (5 min), and precipitation (10 min) enabled the filling and drainage dynamics of individual TSAs to be quantified. The monitoring period (2019-2021) captured several notable storm events, including one with an estimated return period of 1 in 37 years. 

To quantify the aggregated impact of multiple TSAs on flood hydrographs at the catchment scale, observed TSA inflows and river discharge were used within a time-of-travel based hydrograph reconstruction approach to enable the estimation of downstream discharge in the absence of TSAs. Comparison of observed (with TSAs) and reconstructed (without TSAs) hydrographs indicate a 23% reduction in peak discharge for a 1 in 16-year return period storm. Furthermore, analysis of individual TSAs revealed substantial variation in storage utilisation and drainage during and after storms. These results provide quantitative evidence of how TSAs function both individually and in combination. The potential effectiveness of TSAs as a sustainable Natural Flood Management intervention will be discussed.

How to cite: Bishop, J., Old, G., Rameshwaran, P., Wade, A., Robotham, J., Gasca-Tucker, D., Berkeley, A., Old, J., and McKnight, D.: The effectiveness of Temporary Storage Areas for Natural Flood Management: Empirical evidence from a lowland catchment, UK, EGU General Assembly 2026, Vienna, Austria, 3–8 May 2026, EGU26-8304, https://doi.org/10.5194/egusphere-egu26-8304, 2026.

EGU26-9676 | ECS | Posters virtual | VPS32

Deforestation-Driven Surface Warming and Heat Exposure in a Tropical Dry Forest District. 

Sweeti Rani and Subir Sen

Deforestation-Driven Surface Warming and Heat Exposure in a Tropical Dry Forest District

Deforestation is widely understood as an important driver of local-scale climate warming in tropical regions, yet its consequences for human heat exposure and associated health risks remain poorly quantified at fine spatial scales. Forest cover regulates land surface temperature through canopy shading and evapotranspiration, suggesting that forest loss may amplify near-surface warming and intensify heat stress beyond background climate change. While global and regional studies have documented warming associated with deforestation, most analyses are conducted at coarse spatial scales and offer limited insight into district-level impacts relevant for human exposure. This gap is particularly evident in tropical dry deciduous forest regions, which experience pronounced seasonal heat stress and support populations heavily dependent on outdoor labor. In India, this type of landscape is widespread, yet fine-resolution assessments linking forest-cover change to heat exposure remain scarce.

This study proposes a district-level investigation of deforestation-driven warming and heat exposure in a district of Jharkhand, which is an ecologically stressed dry tropical forest region characterized by forest degradation and extreme summer temperatures. Forest-cover change since 2000 is quantified using Landsat-based Hansen Global Forest Change data, while land surface temperature patterns are examined using MODIS daytime LST observations. Hourly temperature and humidity fields from ERA5 reanalysis are used to reconstruct diurnal heat exposure and derive heat-stress indicators relevant to outdoor working conditions. Population-weighted exposure metrics and established temperature–health response functions from global burden datasets are employed to explore potential implications for heat-related mortality and losses in safe working hours.

By integrating high-resolution forest, climate, and population datasets, this work aims to isolate the contribution of local forest loss to heat exposure beyond broader regional warming trends. The analysis is expected to provide early evidence of how deforestation can intensify heat risks in vulnerable rural districts, with direct relevance for heat-adaptation planning, forest conservation priorities, and occupational health policies. These insights can inform district-level climate action plans, guide nature-based cooling strategies, and also support targeted interventions to reduce heat exposure among outdoor workers and farmers in tropical dry forest regions.

How to cite: Rani, S. and Sen, S.: Deforestation-Driven Surface Warming and Heat Exposure in a Tropical Dry Forest District., EGU General Assembly 2026, Vienna, Austria, 3–8 May 2026, EGU26-9676, https://doi.org/10.5194/egusphere-egu26-9676, 2026.

EGU26-16078 | ECS | Posters virtual | VPS32

Constraining irrigation simulation in Global Hydrological Model H08 using satellite-derived dynamic targets 

Xin Huang, Qing He, Naota Hanasaki, and Taikan Oki

Accurate simulation of irrigation water use is essential for quantifying human impacts on the global water cycle. Given that continuous large-scale in situ monitoring of irrigation is scarce, the fidelity of irrigation estimates relies heavily on how models represent soil-moisture deficits and management targets. In many global hydrological models (e.g., H08), irrigation demand is commonly computed using a soil-moisture deficit approach: water is applied to refill the soil when moisture levels fall below a prescribed target. However, this target is typically implemented as a static, empirically specified parameter. While computationally efficient, this practice introduces substantial uncertainty into simulated irrigation water use.

Here, we develop a satellite-based framework that utilizes observed surface soil moisture to constrain irrigation demand in hydrological models. We first construct a day-of-year climatology of satellite-derived surface soil moisture to capture multi-year mean irrigation conditions and management requirements. Subsequently, we employ a vertical extrapolation strategy to translate satellite-derived surface targets into a root-zone proxy compatible with the H08 model. We validate this strategy in non-irrigated regions before applying it to irrigated areas to enable dynamic, observation-constrained irrigation targets. Preliminary diagnostics indicate that this framework offers a practical pathway for integrating satellite soil-moisture data into H08, improving the spatial realism of irrigation demand and facilitating more consistent evaluations against independent benchmarks.

How to cite: Huang, X., He, Q., Hanasaki, N., and Oki, T.: Constraining irrigation simulation in Global Hydrological Model H08 using satellite-derived dynamic targets, EGU General Assembly 2026, Vienna, Austria, 3–8 May 2026, EGU26-16078, https://doi.org/10.5194/egusphere-egu26-16078, 2026.

EGU26-16183 | Posters virtual | VPS32

Projecting bilateral virtual water trade of rice and wheat toward 2100 under different SSP scenarios 

Kazuki Tsuda, Taichi Sano, Taikan Oki, and Toshichika Iizumi

Virtual water trade (VWT) redistributes water embodied in agricultural commodities across borders and thereby shapes global interdependence between water resources and food security. Recent studies have increasingly used integrated assessment models (IAMs)—including GCAM, a partial-equilibrium IAM—to project future agricultural production and trade balances under future climate and socio-economic change and to infer virtual water transfer flows(e.g., Graham et al., 2020). However, such approaches assume that commodities are traded in a single global markets, making it difficult to explicitly quantify bilateral exporter–importer dependency structures.
In this study, we develop a scenario-based framework to estimate bilateral virtual water trade of rice and wheat toward 2100 by combining projections of harvested area (land-use), climate-driven yield changes, and population dynamics with an extrapolation of current trade structures. Using baseline bilateral trade matrices from FAOSTAT, we assume that (i) exporter-specific allocation to destination countries and (ii) national export-to-production ratios remain fixed, and we scale bilateral trade volumes in accordance with scenario-driven changes in production and demand. We then compute bilateral VWT by linking projected crop flows with crop- and location-specific water-use coefficients. The analysis focuses on SSP2 as the primary scenario, with additional SSP comparison(SSP126 and SSP585). This framework enables assessment of how future VWT magnitude and bilateral dependency patterns may evolve differently between rice—characterized by relatively thin international markets—and wheat, which is traded in thicker global markets, providing insights for water–food security assessment under future climate and socio-economic change.

How to cite: Tsuda, K., Sano, T., Oki, T., and Iizumi, T.: Projecting bilateral virtual water trade of rice and wheat toward 2100 under different SSP scenarios, EGU General Assembly 2026, Vienna, Austria, 3–8 May 2026, EGU26-16183, https://doi.org/10.5194/egusphere-egu26-16183, 2026.

EGU26-16816 | ECS | Posters virtual | VPS32

Heat Stress Impacts on Elite Tennis Performance: Evidence from the Australian Open 

Gökcan Kahraman, Mustafa Tufan Turp, and Nazan An

Increasing temperatures create more challenges for outdoor elite sports, particularly high-intensity tournaments such as the Australian Open, where players frequently experience high thermal stress. This study investigates the impact of environmental heat stress on professional tennis performance using high-resolution data from professional tennis matches with environmental performance diagnostics. To quantify these impacts, ATP and WTA singles matches played at various Australian Open tournaments have been analysed in conjunction with ERA5-Land reanalysis data averaged per hour, covering air temperature, relative humidity, global radiation, and wind speed. Heat stress was computed using the Wet Bulb Globe Temperature index and categorised into heat danger levels according to the heat danger classification of Sports Medicine Australia. A hypothesis-driven, uncertainty-aware statistical framework was employed, utilising robust non-parametric tests, trend analyses, and Spearman rank correlations to evaluate the sensitivity of key performance metrics to escalating levels of heat stress. Overall, the results indicate that severe heat stress conditions negatively affect the efficiency of serve and return, the number of unforced errors, the level of performance variability, and the length of a match in ATP and WTA events. More specifically, aggressive serve-related variables, such as aces, demonstrate a partial level of resilience in severe heat, while rally complexity, shot variety, and return length decrease with increased levels of heat stress. When analysed by set status, the results further suggest that while one of the most elite players controls their playstyle in severe heat conditions, the lower-seeded players take more risks and tend to make errors. Taken together, these findings provide large-scale empirical evidence of the impacts of environmental stress during the Australian Open tournament games. In light of these findings, the Australian Open tournament should adjust its schedule to prioritise tennis players’ health, and future tournaments should be scheduled more precisely according to reports from climate scientists and data-informed schedules.

How to cite: Kahraman, G., Turp, M. T., and An, N.: Heat Stress Impacts on Elite Tennis Performance: Evidence from the Australian Open, EGU General Assembly 2026, Vienna, Austria, 3–8 May 2026, EGU26-16816, https://doi.org/10.5194/egusphere-egu26-16816, 2026.

EGU26-16979 | ECS | Posters virtual | VPS32

Integrating drought indices and socio-ecological theory to analyze long-term drought impacts: A review of South Africa’s rural communities. 

Katlego Mothapo, Fhumulani Mathivha, Hector Chikoore, and Elisabeth Krueger

Drought remains a pervasive environmental and socio-economic challenge across developing countries, with rural and semi-arid regions such as South Africa’s particularly vulnerable. In recent decades, climate variability has exacerbated the frequency, severity, and duration of droughts, prompting an expanding body of literature on resilience and adaptation. Traditional monitoring tools such as the Standardized Precipitation Index, Standardized Streamflow Index, and NDVI provide valuable biophysical insights but often fail to capture the socio-economic dimensions that shape community vulnerability and response. This review explores the evolution and application of the socio-ecological systems (SES) framework in drought resilience research within developing contexts. The SES approach offers a holistic lens to understand the complex interplay between environmental stressors, livelihoods, governance, and social systems. Emerging literature highlights the growing use of SES yet also reveals persistent gaps including weak integration between quantitative climate data and qualitative social insights, limited longitudinal studies, and inadequate incorporation of local knowledge. Drawing on studies from sub-Saharan Africa and other Global South regions, this review synthesizes key trends, methodological advancements, and research gaps in SES-informed drought resilience. It underscores the need for interdisciplinary, participatory, and context-sensitive approaches to support equitable and sustainable adaptation strategies aligned with global frameworks such as SDG 13 and the Sendai Framework.

How to cite: Mothapo, K., Mathivha, F., Chikoore, H., and Krueger, E.: Integrating drought indices and socio-ecological theory to analyze long-term drought impacts: A review of South Africa’s rural communities., EGU General Assembly 2026, Vienna, Austria, 3–8 May 2026, EGU26-16979, https://doi.org/10.5194/egusphere-egu26-16979, 2026.

Responding to the challenges of a changing climate requires information that is relevant and actionable at the local scale where adaptation actions take place. To address these needs within Denmark, Klimaatlas, the Danish National Climate Atlas, was developed to provide information to ministries, regional authorities, businesses and citizens about climate change in Denmark.  Here we present the lessons learnt since the inception of the project in 2018, with a focus on those that are relevant to the development of similar tools in other regions. We will examine issues around the conception and setup of the climate service, particularly the need to identify users, work with champions and set limits. Communication is a critical aspect of such a service and we will discuss our approach of communicating on multiple levels, and taking up the challenge of uncertainty. Updatability, maintenance and operationalisation are also key, and the merits of the “rolling-releases” model used by Klimaatlas will be discussed, together with our efforts to open our codebase via the KAPy project. Finally, we discuss issues around future maintenance and possible expansions of Klimaatlas, including the use of convection permitting simulations, incorporation of compound events, updates between IPCC cycles and extensions to new sectors.

How to cite: Payne, M. R.: Lessons in climate service development from Klimaatlas, the Danish National Climate Atlas., EGU General Assembly 2026, Vienna, Austria, 3–8 May 2026, EGU26-17146, https://doi.org/10.5194/egusphere-egu26-17146, 2026.

EGU26-18030 | Posters virtual | VPS32

Urban Geo-climate Footprint (UGF) for Classifying Italian Cities by Geological and Climatic Features 

Saverio Romeo, Mauro Bonasera, Maria Paola Campolunghi, Gianluigi Di Paola, Paolo Maria Guarino, Gabriele Leoni, Raffaele Proietti, and Francesco La Vigna

Urban areas are increasingly exposed to complex interactions of geological, climatic, and anthropogenic pressures. The UGF methodology (Lentini et al., 2024), already applied to more than 40 European cities, provides a structured approach to assess these multi-dimensional conditions and support urban planning and risk management. In this study, UGF was applied to 21 Italian regional capitals, selected to capture the geographic, climatic, and structural diversity of the country, from alpine regions to coastal plains and southern volcanic districts. Italy thus represents an ideal natural laboratory to test the methodology, offering a wide range of geological and climatic settings within a single country.

The methodology integrates multiple drivers: deep geological processes (DEE, e.g., seismicity and volcanism, gas emissions), superficial processes (SUP, e.g., landslides, subsidence, floods, coastal erosion), exogenous processes (EXO, e.g. heavy rains, droughts, sea level change), geological complexity (GEO, e.g., stratigraphy, groundwater, slope), and anthropogenic pressures (SAP, e.g., land use change, soil sealing, pollution). For each city, the UGF Index quantifies the intensity of these drivers, allowing classification into four UGF classes that reflect the spectrum of urban geo-climatic conditions.

Results from Italy highlight a wide range of situations: Trento and Campobasso fall into UGF-1, indicating minimal geologic-climatic pressures, while Napoli and Genova are classified as UGF-4 due to the combined influence of high-intensity drivers, including active volcanism, high seismicity, subsidence, and strong anthropogenic pressures. Intermediate classes (UGF-2 and UGF-3) include cities such as Milano, Firenze, Bari, and Venezia, where moderate interactions of these drivers prevail.

Geographical patterns emerge from the analysis of drivers. UGF index generally increases southward, reflecting higher exposure to Mediterranean climatic extremes, active seismicity along the Apennines, and southern volcanic districts. Coastal cities show high SUP and EXO contributions due to erosion, storm surges, and sea-level rise, while SAP is prominent in large urban centers, reflecting land consumption, groundwater contamination, and subsurface instability. The GEO driver is relatively consistent across the country, emphasizing Italy’s intrinsic geodiversity.

It is important to note that UGF classes do not rank cities by “risk” or “misfortune,” but rather identify the prevailing geological, climatic, and anthropogenic pressures to support planning and mitigation. A semi-qualitative assessment of geo-benefits further highlights positive contributions to urban systems, with cities such as Milano, Napoli, Palermo, Roma, Trento, Trieste, and Venezia showing higher scores.

Overall, the UGF approach provides an explicit and concise understanding of urban geo-climatic conditions, also integrating natural hazards, climatic pressures, and human impacts. It highlights local differences often masked by traditional indicators and offers a valuable tool for evidence-based urban planning, climate adaptation, risk reduction, and sustainable urban regeneration. The methodology emphasizes the recognition of the subsurface as a primary urban infrastructure, essential for resilient city development.


Lentini, A., Galve, J. P., Benjumea, B., Bricker, S., Devleeschouwer, X., Guarino, P. M., Kearsey, T., Leoni, G., Puzzilli, L. M., Romeo, S., Venvik, G., & La Vigna, F. (2024). The Urban Geo-climate Footprint approach: Enhancing urban resilience through improved geological conceptualisation. Cities, 145, 105287. https://doi.org/10.1016/j.cities.2024.105287 

How to cite: Romeo, S., Bonasera, M., Campolunghi, M. P., Di Paola, G., Guarino, P. M., Leoni, G., Proietti, R., and La Vigna, F.: Urban Geo-climate Footprint (UGF) for Classifying Italian Cities by Geological and Climatic Features, EGU General Assembly 2026, Vienna, Austria, 3–8 May 2026, EGU26-18030, https://doi.org/10.5194/egusphere-egu26-18030, 2026.

EGU26-18217 | ECS | Posters virtual | VPS32

Gaps, Challenges, and Priorities for Future Adaptation of Heat Action Plans in India 

Shradha Deshpande and Mahua Mukherjee

The rising temperatures and intensification of global heat hazards have evolved beyond occasional or seasonal heatwaves into a frequent state of chronic heat stress, amplifying both the duration and impact of extreme heat events. Driven by rising temperatures, humidity, rapid industrialization, and urbanization, the South Asian region, specifically India, faces escalating vulnerability to this compound hazard, which threatens public health, livelihoods, economic productivity, ecosystem balance, and overall quality of life.
India’s institutional response began with Ahmedabad’s pioneering 2013 Heat Action Plan (HAP), which catalysed the adoption of city- and state-level HAPs nationwide. To understand this evolution, 'content analysis' was conducted for 40 Heat Action Plans of 17 Indian states, available officially and publicly, founded against the National Disaster Management Authority’s (NDMA) 2019 guidelines and a global standards study from the WHO and UNDRR. The 23 heatwave-prone states were identified since 2013, only 18 currently have an official HAP.

This review evaluates document structure, its regional contextualization, accessibility to data, and institutional framework. While the NDMA’s (2019) heatwave framework has enabled widespread adoption, it is heatwave-centric and would benefit from explicitly incorporating heat stress through a nationally identified temperature–humidity index, as experimentally presented by IMD in 2023. Although the NOAA Heat Index is frequently cited in HAP documents, it is not suited to Indian conditions, as it does not reliably capture the extreme temperature–humidity regimes prevalent across the country. Furthermore, less than 50% of HAPs include localized vulnerability assessments, which should ideally contextualize physiological and social intricacies, regionally.

Additionally funding ambiguity is another persistent challenge, with most plans lacking identified financial sources or budgetary commitments. Communication gaps are evident, as less than 10% of HAPs provide materials in regional languages, constraining access to vulnerable populations in terms of educational limitation. Although, Ahmedabad’s evolving model remains the most comprehensive in this context. Notably, over 35% of HAPs fail to address land-use land-cover change, urban development plans, or localized climate-resilient design, despite strong links between the built environment and rising heat exposure. Data limitations, fragmented institutional accountability, and the lack of regional context with multi-sector actionability further weaken adaptive governance.
Altogether, these findings highlight the urgent need to move from fragmented, reactive heat responses toward anticipatory, multi-sectoral resilience planning. While the efficacy of HAPs depends on regional contextuality, this diversity must be supported by a replicable national framework guide that acknowledges heat stress while enabling inter-regional comparability. HAPs are primarily action-oriented instruments, this should reflect in the accessibility through local language translations, simplified formats with infographic tools, alongside comprehensive technical format that addresses meteorological services, health surveillance, funding mechanisms, and urban planning and design.

Resilience shouldn’t wait for the next disaster. The global shift toward proactive disaster risk management and the legacy of Ahmedabad’s 2010 heat-related mortality should motivate preparedness over response. Institutionalizing and updating HAPs primarily across all heatwave-prone states followed by the rest is central to embedding preparedness within India’s climate governance and recognizing heat as a structural climate–development challenge, rather than a seasonal hazard.

How to cite: Deshpande, S. and Mukherjee, M.: Gaps, Challenges, and Priorities for Future Adaptation of Heat Action Plans in India, EGU General Assembly 2026, Vienna, Austria, 3–8 May 2026, EGU26-18217, https://doi.org/10.5194/egusphere-egu26-18217, 2026.

EGU26-18296 | ECS | Posters virtual | VPS32

Environmental Education and the Anthropocene: Convergences, Distances, and Contemporary Challenges 

Samuel Pinheiro, Raizza Lopes, and Maxime Bordes

We live in the Anthropocene (Crutzen & Stoermer, 2000) or, in Stengers’ (2015) terms, in the time of catastrophes, a period marked by the intensification of interdependencies between socio-environmental crises. Scientific literature on the Anthropocene has produced increasingly consistent diagnoses of ongoing biogeophysical transformations, grounded primarily in contributions from the Earth System Sciences (Steffen et al., 2018) and the Geological Sciences (Zalasiewicz et al., 2021), which are extensively systematised in the works of Wallenhorst (2020; 2025). These studies provide a robust framework for understanding planetary boundaries, dynamics of acceleration, and systemic risks associated with transformations driven by the capitalist mode of production. In parallel, the concept of the Anthropocene has been further developed by scholars working at the interface between Earth sciences and the humanities, incorporating economic, historical and political dimensions into the understanding of the contemporary crisis. In this regard, contributions by Veiga (2019; 2023; 2025) and Latour (2017; 2021) shift the debate beyond a strictly biogeophysical perspective, interrogating models of development, forms of social organisation and regimes of knowledge production that sustain socio-environmental collapse, while offering occasional reflections on the role of education. It is within this context that a central question emerges, guiding this proposal: in the face of the gravity of the Anthropocene, is what we lack a deeper knowledge of the urgency of the times in which we live, or do existing bodies of knowledge rather collide with political, economic and institutional interests that hinder their translation into social transformation? The aim of this article is to address this question from the perspective of Environmental Education (EE), exploring its analytical contributions to understanding the relationships between science, power and socio-environmental inequalities. EE is here understood as a field in permanent (re)foundation in response to socio-environmental transformations. As noted by Reigota (2004), EE emerged as a response to environmental issues produced by a predatory and unsustainable capitalist economic model, gaining international visibility from the Stockholm Conference (1972) onwards. However, as indicated by Leite Lopes (2004) and Carvalho (2001), some early approaches adopted a conservationist and normative character, centred on individual responsibility and avoiding a critical interrogation of the social structures that produce environmental degradation. Over recent decades, authors such as Layrargues (2012) and Carvalho (2014) have deepened the critical foundations of EE, highlighting it as a field traversed by epistemological, ethical and political disputes. Methodologically, this proposal is based on a bibliographic review of scientific productions from the Earth sciences, the humanities and Environmental Education, with an emphasis on articulations between the Anthropocene, scientific knowledge, politics and socio-environmental justice. In dialogue with Carvalho and Ortega (2024), we argue that the dimension of catastrophes should not be understood solely as collapse, but also as an opportunity to reinvent ways of doing science, educating and inhabiting the world, reaffirming the centrality of Environmental Education in the construction of socially just responses to the Anthropocene.


How to cite: Pinheiro, S., Lopes, R., and Bordes, M.: Environmental Education and the Anthropocene: Convergences, Distances, and Contemporary Challenges, EGU General Assembly 2026, Vienna, Austria, 3–8 May 2026, EGU26-18296, https://doi.org/10.5194/egusphere-egu26-18296, 2026.

EGU26-18945 | Posters virtual | VPS32

A System Dynamics Model to Assess Water Resilience in the North China Plain 

Liang Junkun, He Qing, He Xizhu, Lu Hui, and Oki Taikan

In the context of escalating global population, rapid economic development, and ongoing climate change, water resource management is confronted with a multitude of challenges. The North China Plain (NCP), as the economic powerhouse of China, is facing a multifaceted set of water-related issues, including inefficient water use under persistent scarcity, complex virtual water trade flows, and the increasing pressure on allocating water resource among cities through water diversion projects. Traditional water resource models often overlook the two-way feedbacks between water supply sources and demand sectors, therefore may not adequately represent the real-world water resilience dynamics. To address these challenges, this study constructs a System Dynamic (SD) model in NCP, building on water supply and demand statistics from local governmental reports. Different from previous SD-based water models for this region, we explicitly consider the roles of different water supply sources and municipal emergency water reserves. This provides a unique advantage for assessing urban water system resilience under extreme climate conditions.  In this presentation, we will first show the validation of our model in the historical period (2000-2020) compared to water agency statistics. We will also illustrate how the interactions between each urban water system components may change under different future climate scenarios. By investigating the  dynamic feedbacks between the natural and anthropogenic water cycles, our model is set to provide a scientific reference for governments to plan flexible and adaptive water resource management strategies.

Key word: Water Management; System Dynamic Model; North China Plain.

How to cite: Junkun, L., Qing, H., Xizhu, H., Hui, L., and Taikan, O.: A System Dynamics Model to Assess Water Resilience in the North China Plain, EGU General Assembly 2026, Vienna, Austria, 3–8 May 2026, EGU26-18945, https://doi.org/10.5194/egusphere-egu26-18945, 2026.

EGU26-19386 | Posters virtual | VPS32

Climate Resiliency through Restoration using New Water Paradigm Methods 

Michal Kravčík and Zuzana Mulkerin

The Challenge: 

Establishing a viable and systematic approach to measure the volume of stormwater runoff that can be captured to replenish aquifers and enhance climate resilience. Droughts, floods, erosion, heat domes, and crop failures are interconnected issues related to water, food, climate, and economics. Scaling up science-based methods across large areas presents challenges. 

Overview: 

Water is a common thread in climate change manifestation. Anthropological land use changes have transformed hydrology in various regions. Opportunities exist to integrate stormwater capture into water and climate management. It is important to consider rainwater as a valuable resource rather than something that is discarded. Conventional infrastructure drains rainwater excessively from agricultural, forested, and urban lands, wasting resources and threatening ecosystem stability and biodiversity. 

Solutions: 

Solution explores stakeholder-supported volumetric stormwater capture projects to deliver net positive water resource benefits, enhance climate resilience, and provide multiple co-benefits. This integration leads to financial returns and improved community satisfaction. A new water paradigm can help restore water resources on land. 

Case Study: In Slovakia, a new water paradigm approach has emerged over the last three decades, focusing on critical rainwater management. The authors discuss their experience in implementing past projects and their positive impact on the community, detailing the new Košice Region restoration plan in Slovakia. The new water paradigm approach attracted the attention of the UN Foresight Brief and UN Decade on Ecosystem Restoration and within the EU Climate-ADAPT framework.


How to cite: Kravčík, M. and Mulkerin, Z.: Climate Resiliency through Restoration using New Water Paradigm Methods, EGU General Assembly 2026, Vienna, Austria, 3–8 May 2026, EGU26-19386, https://doi.org/10.5194/egusphere-egu26-19386, 2026.

EGU26-22058 | Posters virtual | VPS32

A framework to facilitate inclusion of NbS ecosystem service benefits in cost-benefit analysis 

Rose Noggle, Dilruba Akter, Md Adilur Rahim, and Rubayet Bin Mostafiz

Uncertainty and perceived lack of quantifiability in the evaluation of nature-based solution (NbS) benefits relating to non-market ecosystem services remains a barrier to the ready adoption of NbS as water resilience projects. We aim to bridge this gap for coastal and riverine NbS by creating a framework to improve inclusion of the entire range of ecosystem services provided by NbS in cost-benefit analysis of water resilience project alternatives. We have conducted a literature review of NbS and natural and nature-based feature (NNBF) literature and case studies to determine which ecosystem services are associated with wetlands, dunes and beaches, seagrass meadows, barrier islands, and forested ecosystems. Through the review, we have identified ecological and environmental, carbon capture, coastal land loss reduction, hazard risk reduction, socio-economic and cultural, and economic and financial services of each NbS type, along with the range of metrics currently used to evaluate project output of these benefits. We created a fully cited framework detailing the benefits and metrics for each NbS type, and implemented it in both a knowledge graph and interactive radial graph formats. The interactive radial graph provides support for human user exploration of the framework and cited literature and case studies. The knowledge graph will serve to support retrieval-augmented generative agent tools in the future. In future work, we will improve on the framework with inclusion of cost and limitation information, as well as a basic method for estimating market values of non-market benefits based on those of market benefits. 

How to cite: Noggle, R., Akter, D., Rahim, M. A., and Mostafiz, R. B.: A framework to facilitate inclusion of NbS ecosystem service benefits in cost-benefit analysis, EGU General Assembly 2026, Vienna, Austria, 3–8 May 2026, EGU26-22058, https://doi.org/10.5194/egusphere-egu26-22058, 2026.

CC BY 4.0